# GuardWare Knowledge Base

Find practical guides, training, and reference material for every stage.

{% hint style="success" %}

### Welcome to GuardWare!

GuardWare is a data-centric security platform that helps organisations discover, monitor, and protect sensitive information across on-premises and cloud environments.\
\
Rather than focusing solely on network perimeters, GuardWare secures data throughout its lifecycle, from identifying where sensitive data resides, to monitoring how it is accessed and shared, to protecting it wherever it goes.
{% endhint %}

### Start your GuardWare journey

<table data-view="cards"><thead><tr><th></th><th></th><th data-hidden data-card-target data-type="content-ref"></th><th data-hidden data-card-cover data-type="image">Cover image</th></tr></thead><tbody><tr><td></td><td>Brief guides covering the essential steps to begin using GuardWare. Use them to set up the products and start your journey quickly.</td><td><a href="https://docs.guardware.com/getting-started/">Getting Started</a></td><td><a href="https://3173611555-files.gitbook.io/~/files/v0/b/gitbook-x-prod.appspot.com/o/spaces%2FDrJMuASCAeWV8yxJbO3q%2Fuploads%2FOSI8StR5dU541wZaf0ez%2FGetting%20Started.png?alt=media&amp;token=76acd979-704a-490f-afba-bfa21bf46e98">Getting Started.png</a></td></tr><tr><td></td><td>Training resources with visual walkthroughs and detailed course content. Use self-paced videos for flexible learning, or instructor-led courses for in-person training and ask questions.</td><td><a href="https://docs.guardware.com/training-centre/">Training Centre</a></td><td><a href="https://3173611555-files.gitbook.io/~/files/v0/b/gitbook-x-prod.appspot.com/o/spaces%2FDrJMuASCAeWV8yxJbO3q%2Fuploads%2FB9FEZlkxc2NTUeOyto58%2FTraining%20Centre.png?alt=media&amp;token=695fa7d7-7b80-40f0-8376-d3587e017a4a">Training Centre.png</a></td></tr><tr><td></td><td>User guides for all GuardWare products. Use it for complete product guidance and detailed reference information.</td><td><a href="https://docs.guardware.com/documentation/">Home</a></td><td><a href="https://3173611555-files.gitbook.io/~/files/v0/b/gitbook-x-prod.appspot.com/o/spaces%2FDrJMuASCAeWV8yxJbO3q%2Fuploads%2F8rdRUnscMtuS5R589VEw%2FDocumentation.png?alt=media&amp;token=7363d685-83ef-44dd-87b5-e629cae8c6d3">Documentation.png</a></td></tr></tbody></table>

{% hint style="warning" %}

### See what's new in GuardWare!

#### <i class="fa-circle-check" style="color:$success;">:circle-check:</i> Latest releases

**Product**           |       **Latest version**

***

**DISCOVER**        |         `V1.3.2.73`

**INSIGHT**          |         `v5.5.24.6`

**PROTECT**        |         `v1.2.65.3`

***

[Read the release notes here.](https://docs.guardware.com/product-updates/)
{% endhint %}


# GuardWare Service Level Agreement (SLA)

## &#x20;1. Purpose&#x20;

This Service Level Agreement (SLA) defines the support, maintenance and service commitments provided by GuardWare Australia to its customers. It establishes measurable standards, support responsibilities and escalation procedures to promote consistent and reliable service delivery.&#x20;

## 2. Scope of Services&#x20;

The SLA covers the following services:&#x20;

* Software bug identification and resolution&#x20;
* Server-side software updates and maintenance&#x20;
* Client software updates&#x20;
* Security patches and vulnerability remediation&#x20;
* Product enhancements and version upgrades&#x20;
* Technical support and incident management&#x20;

## 3. Service Availability & Support Hours&#x20;

* Standard Support Hours&#x20;
  * Monday to Friday, 8:00 AM to 8:00 PM, excluding public holidays&#x20;
  * Weekends and public holidays, 9:00 AM to 6:00 PM on an on-call basis&#x20;
* Extended / Critical Support&#x20;
  * Support for Highest Severity incidents may be made available on a 24/7 basis, where applicable&#x20;
  * Any support provided outside the standard support hours shall be treated as extended support and may be subject to additional charges&#x20;
* **Support Channels:** &#x20;

<table data-header-hidden><thead><tr><th width="198"></th><th></th></tr></thead><tbody><tr><td>Email </td><td><a href="mailto:help@guardware.com.au">help@guardware.com.au</a> </td></tr><tr><td>Portal </td><td><a href="https://help.guardware.com.au/">https://help.guardware.com.au</a>  </td></tr><tr><td>Phone </td><td>+61 (02) 8551 8500 </td></tr><tr><td>WhatsApp </td><td>+61 (02) 8551 8500 </td></tr><tr><td>Remote Assistance </td><td>Microsoft Quick Assist, AnyDesk, TeamViewer, Remote Desktop Protocol (RDP), where permitted, Zoom or Microsoft Teams screen sharing, where appropriate, any other mutually agreed secure remote support tools approved by GuardWare and the Customer.</td></tr></tbody></table>

{% hint style="info" %}
*Support is provided during the agreed business hours of the relevant support region. For customers in different time zones, the applicable support window will be based on the contracted service region or otherwise agreed in writing. SLA timeframes will be measured against the agreed support window.*
{% endhint %}

## 4. Incident Severity Classification&#x20;

<table data-header-hidden="false" data-header-sticky><thead><tr><th width="286">Severity</th><th>Description</th></tr></thead><tbody><tr><td>Critical (Highest) </td><td>Complete service outage or major business disruption </td></tr><tr><td>High </td><td>Significant functionality impacted, limited workaround available </td></tr><tr><td>Medium </td><td>Partial impact, workaround available </td></tr><tr><td>Low </td><td>Minimal or no business impact </td></tr><tr><td>Service Request (Others) </td><td>Non-incident requests such as information requests, minor changes or enhancement enquiries. </td></tr></tbody></table>

## 5. Service Level Targets&#x20;

### 5.1 General Service Level Targets

| Severity        | Response Time | Resolution Time | Update Frequency |
| --------------- | ------------- | --------------- | ---------------- |
| Critical        | 1 hour        | 2 hours         | Every 30 minutes |
| High            | 2 hours       | 4 hours         | Every 2 hour     |
| Medium          | 4 hours       | 8 hours         | Daily            |
| Low             | 8 hours       | 3 business days | As required      |
| Service Request | 24 hours      | As agreed       | As required      |

{% hint style="info" %}

* Resolution times refer to restoration of service or implementation of a workable mitigation.&#x20;
* Permanent fixes may be delivered in a later scheduled release.&#x20;
  {% endhint %}

### 5.2  Cloud Server Availability&#x20;

For customer environments hosted and managed by GuardWare, the target availability for cloud server infrastructure is 98% per calendar month, excluding approved maintenance windows, emergency maintenance, failures caused by third-party service providers, customer-controlled configurations, and events outside GuardWare’s reasonable control.&#x20;

## Incident Management Process&#x20;

Incidents are handled through a structured process to ensure timely assessment, clear communication, and effective resolution. Escalation is triggered where SLA thresholds are at risk or where additional technical review is required.&#x20;

1. Issue is logged via email or the support portal.&#x20;
2. Ticket is acknowledged and assigned an initial severity.&#x20;
3. Initial diagnosis and response are performed by the support team.&#x20;
4. A resolution or workaround is implemented where possible.&#x20;
5. Root cause analysis is completed for High and Critical incidents, where applicable.&#x20;
6. If no response or further communication is received from the customer for 48 hours, the ticket may be automatically closed.&#x20;
7. Ticket is closed following customer confirmation, documented resolution, or automatic closure due to lack of customer response.&#x20;

<div data-with-frame="true"><figure><img src="https://233628638-files.gitbook.io/~/files/v0/b/gitbook-x-prod.appspot.com/o/spaces%2FSeE5xviWNLLmIs5MMiGs%2Fuploads%2Fzqro25u4X1C3dUhpMzRh%2Funknown.png?alt=media&amp;token=8454396a-a5e5-4027-b1f1-cbe10ded531f" alt="" width="271"><figcaption></figcaption></figure></div>

{% hint style="warning" %}
**Escalation principle:** If an issue cannot be resolved within the applicable support tier or within target response windows, it will be escalated for additional review and action.&#x20;
{% endhint %}

## 7. Customer Responsibilities&#x20;

To support effective service delivery, customers are expected to:&#x20;

* Provide accurate and complete information when logging issues
* Provide appropriate system access for troubleshooting where required&#x20;
* Maintain supported environments and configurations&#x20;
* Apply recommended updates, patches and remediation actions&#x20;
* Nominate a primary point of contact for operational coordination&#x20;
* Where required provide remote connectivity to the environment for further analysis&#x20;

## 8. Updates, Patches and Release Management&#x20;

### 8.1 Software updates and patch management&#x20;

* All updates are tested in a controlled environment before release&#x20;
* Customers are notified prior to deployment where applicable&#x20;
* Emergency patches may be released outside standard schedules when required&#x20;

### 8.2 Version update policy&#x20;

Major releases include new features, enhancements and architectural changes and are typically delivered one to two times per year. Minor releases generally include bug fixes and security patches and are typically released monthly or as required.&#x20;

### 8.3 Release Management&#x20;

* All releases include release notes and change information&#x20;
* Deployment windows are communicated in advance where practical&#x20;
* Rollback procedures are maintained for critical failures&#x20;

## 9. Service Exclusions&#x20;

Unless otherwise agreed in writing, this SLA does not cover:&#x20;

* Issues caused by third-party systems or services&#x20;
* Unsupported configurations or environments&#x20;
* Customer-side misconfigurations or unauthorised changes&#x20;
* Force majeure events or circumstances beyond reasonable control&#x20;

## 10. Confidentiality&#x20;

All information exchanged under this SLA is classified as Confidential - Commercially Sensitive and must be handled with appropriate care.&#x20;


# Welcome

If you are new to GuardWare, we recommend getting familiar with the platform before starting the installation. GuardWare consists of a central server and three major products, DISCOVER, INSIGHT, and PROTECT, that work together to help you discover, monitor, and protect data across your organisation.

Once you understand the basics, you can proceed with the installation.

#### Recommended setup path

Follow these steps to get started with GuardWare:

{% stepper %}
{% step %}

### **Watch the video guides**

Learn about GuardWare, its products, and how they operate. This gives you the context you need before setting up the system. You can watch the video guides [here](/training-centre/self-paced-video-training/server-and-agent-installation-video-guides).
{% endstep %}

{% step %}

### **Install the GuardWare Server**

The GuardWare Server provides the central Management Console for managing GuardWare products. Follow the guide below to install the server.

<table data-view="cards"><thead><tr><th data-hidden data-card-target data-type="content-ref"></th><th data-hidden data-card-cover data-type="image">Cover image</th></tr></thead><tbody><tr><td><a href="/getting-started/install-guardware-server/install-guardware-management-console">INSTALL GuardWare Server</a></td><td><a href="https://1357541741-files.gitbook.io/~/files/v0/b/gitbook-x-prod.appspot.com/o/spaces%2FJOGWHv3yxVOZRUKbJJWY%2Fuploads%2F30V6pO6wCvIZQOz2yytc%2FServer%20installation.png?alt=media&amp;token=227668cb-a1d9-49b1-94b2-c2f0520db1b1">Server installation.png</a></td></tr></tbody></table>
{% endstep %}

{% step %}

### Whitelist Components

Review and whitelist components required by your product:

* [**Whitelist DISCOVER**](/getting-started/install-discover-agent/whitelist-discover)
* [**Whitelist INSIGHT**](/getting-started/install-insight-agent/whitelist-insight)
* [**Whitelist PROTECT**](/getting-started/install-protect-agent/whitelist-protect)
  {% endstep %}

{% step %}

### Set Up and Install Agents

* **DISCOVER:** [**Download DISCOVER Agent**](/getting-started/install-discover-agent/download-discover-agent), then [**install DISCOVER Agent**](/getting-started/install-discover-agent/install-discover-agent).
* **INSIGHT:** [**Download INSIGHT Agent**](/getting-started/install-insight-agent/download-insight-agent), then [**install INSIGHT Agent**](/getting-started/install-insight-agent/install-insight-agent).
* **PROTECT:** [**Download PROTECT Agent**](/getting-started/install-protect-agent/download-protect-agent), then [**install PROTECT Agent**](/getting-started/install-protect-agent/install-protect-agent).
  {% endstep %}

{% step %}

### Follow the Quick Start Guides Below

{% endstep %}
{% endstepper %}

### Quick Start Guides

After installing the server, choose the product you want to configure.

<table data-view="cards"><thead><tr><th></th><th data-hidden data-card-target data-type="content-ref"></th><th data-hidden data-card-cover data-type="image">Cover image</th></tr></thead><tbody><tr><td>Find sensitive data across endpoints, file servers, Microsoft 365, and cloud storage. Review findings, investigate files, and remediate confirmed risks.</td><td><a href="/getting-started/quick-start-guides/getting-started-with-discover">Getting Started with DISCOVER</a></td><td><a href="https://1357541741-files.gitbook.io/~/files/v0/b/gitbook-x-prod.appspot.com/o/spaces%2FJOGWHv3yxVOZRUKbJJWY%2Fuploads%2FVecgfFimXFvLYlLVe5Ud%2Fdiscover.png?alt=media&amp;token=16d0fdf8-9aa3-4418-af74-d1baf3e74eb9">discover.png</a></td></tr><tr><td>Monitor user activity and data movement across endpoints and Microsoft 365. Detect risky behaviour, possible data leaks, and policy violations.</td><td><a href="/getting-started/quick-start-guides/getting-started-with-insight">Getting Started with INSIGHT</a></td><td><a href="https://1357541741-files.gitbook.io/~/files/v0/b/gitbook-x-prod.appspot.com/o/spaces%2FJOGWHv3yxVOZRUKbJJWY%2Fuploads%2FDNjP7TNW2eDn0GkP3W5n%2Finsight.png?alt=media&amp;token=04ad5928-1d55-41ca-a0ef-5b954e9a759c">insight.png</a></td></tr><tr><td>Encrypt sensitive files and control who can access them. Apply protection across endpoints, email, cloud storage, and shared files.</td><td><a href="/getting-started/quick-start-guides/getting-started-with-protect">Getting Started with PROTECT</a></td><td><a href="https://1357541741-files.gitbook.io/~/files/v0/b/gitbook-x-prod.appspot.com/o/spaces%2FJOGWHv3yxVOZRUKbJJWY%2Fuploads%2FTTYSu1StHeg72hTK7BU6%2Fprotect.png?alt=media&amp;token=c745197d-7da8-49a8-b2ae-fceb5766305c">protect.png</a></td></tr></tbody></table>

## Are you a GuardWare partner?

If you are a **GuardWare partner**, use the guide below to learn more about the partner portal. The quick start guide covers the key concepts, workflows, and configuration steps you will need when deploying GuardWare.

<table data-view="cards"><thead><tr><th></th><th data-hidden data-card-target data-type="content-ref"></th><th data-hidden data-card-cover data-type="image">Cover image</th></tr></thead><tbody><tr><td>Access the Partner Portal to begin partner-specific setup and use the available partner resources.</td><td><a href="/getting-started/quick-start-guides/getting-started-with-partner-portal">Getting Started with Partner Portal</a></td><td data-object-fit="contain"><a href="https://1357541741-files.gitbook.io/~/files/v0/b/gitbook-x-prod.appspot.com/o/spaces%2FJOGWHv3yxVOZRUKbJJWY%2Fuploads%2FCrbzHBLaLCklT6BCXrzr%2Fpartner%20portal.png?alt=media&amp;token=6ae8f5c8-94e9-4de3-840d-150b12b7e9db">partner portal.png</a></td></tr></tbody></table>


# Install GuardWare Management Console

{% embed url="<https://www.youtube.com/watch?v=aYpEUusHQUw>" %}

The GuardWare Management Console is the central platform that coordinates GuardWare DISCOVER, INSIGHT, and PROTECT across your organisation. From a single interface, you can deploy agents, define policies, schedule scans, monitor data activity, and receive alerts when anomalies or policy violations are detected.

This guide walks through the complete installation process, covering all necessary dependencies and configurations.

## System Requirements

Ensure the device hosting the Management Console has sufficient privileges and meets the following requirements:

<table data-header-hidden="false" data-header-sticky><thead><tr><th width="131">Organisation Size</th><th width="191">Operating System</th><th width="111">CPU Cores</th><th width="105">Memory (RAM)</th><th width="111">Disk Space</th><th>Network Ports</th></tr></thead><tbody><tr><td><strong>Small to Medium (1–1,000 clients)</strong></td><td>Microsoft Windows Server 2019 or later (64-bit), fully updated with all patches</td><td>8 cores</td><td>16 GB</td><td>500 GB–1 TB</td><td><p><code>443</code></p><p><code>3306</code></p><p><code>6379</code></p></td></tr><tr><td><strong>Large (1,001–5,000 clients)</strong></td><td>Microsoft Windows Server 2019 or later (64-bit), fully updated with all patches</td><td>12 cores</td><td>32 GB</td><td>2 TB</td><td><p><code>443</code></p><p><code>3306</code></p><p><code>6379</code></p></td></tr><tr><td><strong>Enterprise (5,000+ clients)</strong></td><td>Microsoft Windows Server 2019 or later (64-bit), fully updated with all patches</td><td>Contact GuardWare support</td><td>​Contact GuardWare support</td><td>​Contact GuardWare support</td><td>​Contact GuardWare support</td></tr></tbody></table>

## Pre-Installation Requirements

{% hint style="danger" %}

### **IMPORTANT:** <mark style="color:$danger;">Before proceeding, ensure that Windows is fully updated with the latest applicable security and quality updates. Outdated Windows components may cause compatibility issues during installation, particularly with applications affected by Windows security features such as Control-flow Enforcement Technology (CET).</mark>

{% endhint %}

The following software dependencies must be installed on the Management Console host before proceeding. Each component supports a specific aspect of GuardWare's server functions.

You can download the installer files from their official websites by jumping to the desired section below and following the links there.

<table><thead><tr><th width="216">Component</th><th>Purpose</th></tr></thead><tbody><tr><td><a href="#install-microsoft-visual-c-redistributable">Microsoft Visual C++ Redistributable</a></td><td>Required to run applications built with Visual C++ libraries, including runtime components used by MySQL and its associated services.</td></tr><tr><td><a href="#install-and-configure-mysql">MySQL (v8.4.4 or higher)</a></td><td>Serves as the database backend for GuardWare. It stores configuration details, encryption metadata, user profiles, and other operational data.</td></tr><tr><td><a href="#install-openssl">OpenSSL (3.6.0 Light)</a></td><td>Provides SSL/TLS certificate generation for HTTPS access and cryptographic operations. Used to create self-signed certificates or prepare certificates for Azure integration.</td></tr><tr><td><a href="#install-iis">IIS (Internet Information Services)</a></td><td>Required to run GuardWare components and handle all HTTPS requests.</td></tr><tr><td><a href="#install-the-iis-url-rewrite-module">IIS URL Rewrite Module</a></td><td>Ensures all incoming requests are routed correctly through GuardWare, enabling proper handling of application paths and APIs.</td></tr><tr><td><a href="#install-application-request-routing-arr">Application Request Routing</a></td><td>Acts as a reverse proxy between users and the GuardWare application, routing Management Console requests to the correct backend port and proxying WebSocket connections</td></tr><tr><td><a href="#install-7-zip">7-Zip (26.01 or higher)</a></td><td>Required to compress and protect files generated by the server.</td></tr></tbody></table>

{% stepper %}
{% step %}

## Install Microsoft Visual C++ Redistributable

The Microsoft Visual C++ Redistributable contains runtime libraries required by MySQL and its associated services to function correctly on Windows.

Without the Visual C++ Redistributable, the MySQL installation will fail, or MySQL services will not start, preventing GuardWare from accessing its database.

1. Download Microsoft Visual C++ Redistributable from [**Microsoft’s official website**](https://learn.microsoft.com/en-us/cpp/windows/latest-supported-vc-redist?view=msvc-170#latest-supported-redistributable-version).<br>

   <div align="left"><figure><img src="https://1357541741-files.gitbook.io/~/files/v0/b/gitbook-x-prod.appspot.com/o/spaces%2FJOGWHv3yxVOZRUKbJJWY%2Fuploads%2FOQskRiNiAdGgBTb6XLRE%2Fimage.png?alt=media&amp;token=aa295732-b284-48bb-890a-179e31e5e8e8" alt="" width="528"><figcaption></figcaption></figure></div>
2. Double-click the Microsoft Visual C++ Redistributable installer file to begin the installation.
3. Read and accept the licence terms and conditions and click **Install**.<br>

   <div align="left"><img src="https://1357541741-files.gitbook.io/~/files/v0/b/gitbook-x-prod.appspot.com/o/spaces%2FJOGWHv3yxVOZRUKbJJWY%2Fuploads%2FyRSlIcBzO7TufIHew1Lq%2FUnknown%20image?alt=media&amp;token=5e9a50b9-2ba4-4852-a16d-0ac21a1e0c17" alt="" width="375"></div>
4. Click **Restart** to reboot the device and complete the installation process.
   {% endstep %}

{% step %}

## Install and Configure MySQL

MySQL is a relational database management system that serves as GuardWare's central data repository. Every time you modify configuration settings, manage user permissions, or perform operations through the Management Console, that information is written to and retrieved from the MySQL database. The database does not store actual files or sensitive data from your environment.

1. [**Visit MySQL**](https://downloads.mysql.com/archives/community/), ​download the installer file for MySQL (v8.4.4 or later).
2. Click **Download** to save the MSI installer.<br>

   <div align="left"><figure><img src="https://1357541741-files.gitbook.io/~/files/v0/b/gitbook-x-prod.appspot.com/o/spaces%2FJOGWHv3yxVOZRUKbJJWY%2Fuploads%2F2s7EewIGmiwmM8LsfzF7%2Fimage.png?alt=media&amp;token=311fb30a-5aa2-4269-a182-25a97e2d0b90" alt="" width="563"><figcaption></figcaption></figure></div>
3. Locate the MSI installer, double-click it to launch MySQL Server Setup, then click **Next**.
4. Read and accept the End User Licence Agreement (EULA) and click **Next.**<br>

   <div align="left"><img src="https://1357541741-files.gitbook.io/~/files/v0/b/gitbook-x-prod.appspot.com/o/spaces%2FJOGWHv3yxVOZRUKbJJWY%2Fuploads%2FKfsvQ9CcyVHYFlpFofDl%2FUnknown%20image?alt=media&amp;token=29a06357-e137-4d38-9011-44500f282bbb" alt="" width="375"></div>
5. When selecting the setup type, you have the option to choose between:

   <table data-header-hidden="false" data-header-sticky><thead><tr><th width="152">Installation type</th><th>Description</th></tr></thead><tbody><tr><td><strong>Typical</strong></td><td>Installs the server, client, and essential tools quickly. Provides everything GuardWare needs without extra components.</td></tr><tr><td><strong>Complete</strong></td><td>Includes all optional components, sample databases, and documentation. Larger footprint.</td></tr></tbody></table>
6. Select **Typical** or **Complete** and click **Next**.<br>

   <div align="left"><img src="https://1357541741-files.gitbook.io/~/files/v0/b/gitbook-x-prod.appspot.com/o/spaces%2FJOGWHv3yxVOZRUKbJJWY%2Fuploads%2FBAxonPPXrSqBovYQFojB%2FUnknown%20image?alt=media&amp;token=64a2d8d3-8196-42d5-8045-edca57d0ba46" alt="" width="375"></div>
7. Click **Install** to begin the installation.<br>

   <div align="left"><figure><img src="https://1357541741-files.gitbook.io/~/files/v0/b/gitbook-x-prod.appspot.com/o/spaces%2FJOGWHv3yxVOZRUKbJJWY%2Fuploads%2FrQNIxnuFftkXZ6l1cKy0%2Fimage.png?alt=media&amp;token=7d3a7fef-52db-4f2c-932c-f0d5af1224aa" alt="" width="375"><figcaption></figcaption></figure></div>
8. Select **Run MySQL Configurator** to launch it automatically after clicking **Finish**, then proceed to step 10.

   <div align="left"><figure><img src="https://1357541741-files.gitbook.io/~/files/v0/b/gitbook-x-prod.appspot.com/o/spaces%2FJOGWHv3yxVOZRUKbJJWY%2Fuploads%2FYV5u0dZjAB4wyy0BxERl%2Fimage.png?alt=media&amp;token=a7d89d83-f738-487b-b00a-0f0f5e10e252" alt="" width="375"><figcaption></figcaption></figure></div>
9. If **Run MySQL Configurator** was not selected, search for **MySQL Configurator** in **Search** and click **Open**.

   <div align="left"><img src="https://1357541741-files.gitbook.io/~/files/v0/b/gitbook-x-prod.appspot.com/o/spaces%2FJOGWHv3yxVOZRUKbJJWY%2Fuploads%2FqR4KRBeFf0mckNZC5H0t%2FUnknown%20image?alt=media&amp;token=341c6da9-cf99-48d3-a0b6-aa81b9f94cdc" alt="" width="375"></div>
10. Click **Next** on the Welcome screen.<br>

    <div align="left"><img src="https://1357541741-files.gitbook.io/~/files/v0/b/gitbook-x-prod.appspot.com/o/spaces%2FJOGWHv3yxVOZRUKbJJWY%2Fuploads%2FUTyoedb5tGmK7A5zk1AW%2FUnknown%20image?alt=media&amp;token=e2266671-0657-40dd-aa5e-771980b94430" alt="" width="375"></div>
11. Select a path to the data directory. You can browse the path by clicking the button beside the dialogue box. This is where MySQL will store all database files, including the GuardWare database. Ensure the selected location has sufficient space for database growth as scan history accumulates. Click **Next**.<br>

    <div align="left"><img src="https://1357541741-files.gitbook.io/~/files/v0/b/gitbook-x-prod.appspot.com/o/spaces%2FJOGWHv3yxVOZRUKbJJWY%2Fuploads%2FDkNass3V9iihRGdcbps5%2FUnknown%20image?alt=media&amp;token=f91ba4ff-a3b5-41b0-b46f-78ef05a48f54" alt="" width="375"></div>
12. In the **Type and Networking** window, keep the default settings and note down the assigned port number. The default port is **3306**. You will need this port number when configuring the GuardWare Server to connect to MySQL. Click **Next**.<br>

    <div align="left"><img src="https://1357541741-files.gitbook.io/~/files/v0/b/gitbook-x-prod.appspot.com/o/spaces%2FJOGWHv3yxVOZRUKbJJWY%2Fuploads%2FoSv50Vjf0uBwvcm1mZlA%2FUnknown%20image?alt=media&amp;token=270920de-563b-48b3-855f-d63df9f66515" alt="" width="375"></div>
13. The root account has full administrative privileges over all MySQL databases. Set a strong password and click **Next**.

    <div align="left"><img src="https://1357541741-files.gitbook.io/~/files/v0/b/gitbook-x-prod.appspot.com/o/spaces%2FJOGWHv3yxVOZRUKbJJWY%2Fuploads%2FcNGZfrTUDlc8Wnz2FGhz%2FUnknown%20image?alt=media&amp;token=a1d06241-1a49-40a4-be9f-9c925ca8e28d" alt="" width="375"></div>

{% hint style="info" %}
You will require the **username (root)** and **password** created here during the GuardWare Management Console installation process. Store these credentials securely.
{% endhint %}

14. In **Windows Service**, enable **Configure MySQL Server as a Windows Service** and **Start the MySQL Server at System Startup**, then click **Next**. This ensures MySQL starts automatically when the server boots, so GuardWare can always access the database without manual intervention.<br>

    <div align="left"><figure><img src="https://1357541741-files.gitbook.io/~/files/v0/b/gitbook-x-prod.appspot.com/o/spaces%2FJOGWHv3yxVOZRUKbJJWY%2Fuploads%2Fz8zQXkhMN5BSpMwLseH6%2Fimage.png?alt=media&amp;token=1b458d4b-d0a4-4536-a436-87f7d2f93109" alt="" width="375"><figcaption></figcaption></figure></div>
15. Adjust file permission settings as required for your environment (default is **Yes, grant full access**), and click **Next**.<br>

    <div align="left"><figure><img src="https://1357541741-files.gitbook.io/~/files/v0/b/gitbook-x-prod.appspot.com/o/spaces%2FJOGWHv3yxVOZRUKbJJWY%2Fuploads%2F9AavSWAP0Mmg3kMMWU2C%2Fimage.png?alt=media&amp;token=da909332-3a43-46e5-a884-89e4fc200975" alt="" width="375"><figcaption></figcaption></figure></div>
16. Skip the sample database creation and click **Next**.<br>

    <div align="left"><figure><img src="https://1357541741-files.gitbook.io/~/files/v0/b/gitbook-x-prod.appspot.com/o/spaces%2FJOGWHv3yxVOZRUKbJJWY%2Fuploads%2FsDVkkjJ7RbMRnAlGfBnf%2Fimage.png?alt=media&amp;token=dd71612b-a79d-4a47-9c6a-fb80adfa700f" alt="" width="375"><figcaption></figcaption></figure></div>
17. Review the summary and click **Execute** to apply the configurations.<br>

    <div align="left"><img src="https://1357541741-files.gitbook.io/~/files/v0/b/gitbook-x-prod.appspot.com/o/spaces%2FJOGWHv3yxVOZRUKbJJWY%2Fuploads%2FgJc0JG6iwAyEuwFKfPWY%2FUnknown%20image?alt=media&amp;token=4a6b42ce-6337-4b19-9ac0-0cc852e21bdb" alt="" width="375"></div>
18. After configuration completes, click **Next** and click **Finish** to exit the configurator.

MySQL is now installed and running as a Windows service, ready to store GuardWare's operational data.

### Add MySQL to System PATH

After installing MySQL on Windows, the `bin` folder (e.g., `C:\Program Files\MySQL\bin`) must be added to the system PATH environment variable. PATH tells Windows where to look for executables when you type a command in Command Prompt. Without this, you would need to specify the full path each time.

1. Open **Run**, enter `sysdm.cpl`, and click **OK**.<br>

   <div align="left"><img src="https://1357541741-files.gitbook.io/~/files/v0/b/gitbook-x-prod.appspot.com/o/spaces%2FJOGWHv3yxVOZRUKbJJWY%2Fuploads%2FTJ81H62g6gZVdLqVEISy%2FUnknown%20image?alt=media&amp;token=1d790fb8-cbbe-4b52-90ce-098e317cb8b6" alt="" width="375"></div>
2. Go to **Advanced** and click **Environment Variables.**<br>

   <div align="left"><img src="https://1357541741-files.gitbook.io/~/files/v0/b/gitbook-x-prod.appspot.com/o/spaces%2FJOGWHv3yxVOZRUKbJJWY%2Fuploads%2F4j2tTYCbTtnaOrGrnzoO%2FUnknown%20image?alt=media&amp;token=e269f958-1ab5-435c-8103-90daf32645db" alt="" width="375"></div>
3. In the **System Variables** section, search for **Path** and click **Edit.**<br>

   <div align="left"><img src="https://1357541741-files.gitbook.io/~/files/v0/b/gitbook-x-prod.appspot.com/o/spaces%2FJOGWHv3yxVOZRUKbJJWY%2Fuploads%2FoM7hvOexAnJofHJfntyh%2FUnknown%20image?alt=media&amp;token=99947211-f401-4082-b60e-328a17bdb817" alt="" width="375"></div>
4. Click **New** and enter the MySQL path `C:\Program Files\MySQL\MySQL Server 8.4\bin` to the system PATH environment variable.<br>

   <div align="left"><figure><img src="https://1357541741-files.gitbook.io/~/files/v0/b/gitbook-x-prod.appspot.com/o/spaces%2FJOGWHv3yxVOZRUKbJJWY%2Fuploads%2FUOYms0sS3gfqB0kkE3NO%2Fimage.png?alt=media&amp;token=dc5d1208-6f28-45a5-80a3-1834a046343a" alt="" width="395"><figcaption></figcaption></figure></div>
5. Click **OK** on all windows to save the changes.
6. To verify MySQL is correctly added to PATH, open a new Command Prompt window and type `mysql --version`. The MySQL version will be displayed.<br>

   <div align="left"><figure><img src="https://1357541741-files.gitbook.io/~/files/v0/b/gitbook-x-prod.appspot.com/o/spaces%2FJOGWHv3yxVOZRUKbJJWY%2Fuploads%2Fp9KUhOquIA0HNRWoqtak%2Fimage.png?alt=media&amp;token=96a0e738-6d43-481d-bf82-4ee32f0aa477" alt="" width="509"><figcaption></figcaption></figure></div>

{% endstep %}

{% step %}

## Install OpenSSL

OpenSSL is a cryptographic toolkit used to generate and manage SSL/TLS certificates for secure communications. When uploaded to Azure Entra ID and associated with an App Registration, the certificate allows GuardWare to authenticate with Azure services without using client secrets.

1. Download [**Win32/64 OpenSSL for Windows**](https://slproweb.com/products/Win32OpenSSL.html) (Win64 OpenSSL v3.6.0 Light or higher recommended).<br>

   <div align="left"><figure><img src="https://1357541741-files.gitbook.io/~/files/v0/b/gitbook-x-prod.appspot.com/o/spaces%2FJOGWHv3yxVOZRUKbJJWY%2Fuploads%2FAk22lCxOkwPUHHDH5BUA%2Fimage.png?alt=media&amp;token=8932aeb1-3c5b-4fb0-ac28-66f5e6d6fcaf" alt="" width="563"><figcaption></figcaption></figure></div>
2. Locate the installer (`.msi` or `.exe`) and double-click to launch it.
3. Read and accept the licence agreement and click **Next**.<br>

   <div align="left"><img src="https://1357541741-files.gitbook.io/~/files/v0/b/gitbook-x-prod.appspot.com/o/spaces%2FJOGWHv3yxVOZRUKbJJWY%2Fuploads%2F9SVbgZcCAGyNwebn7PiM%2FUnknown%20image?alt=media&amp;token=e66e018f-bbf3-4278-952e-ff3e5034510a" alt="" width="375"></div>
4. Select the installation directory (default: `C:\Program Files\OpenSSL-Win64\`) and click **Next**.<br>

   <div align="left"><img src="https://1357541741-files.gitbook.io/~/files/v0/b/gitbook-x-prod.appspot.com/o/spaces%2FJOGWHv3yxVOZRUKbJJWY%2Fuploads%2FRHEShYGmkoomAnKiRZI2%2FUnknown%20image?alt=media&amp;token=a134937c-8568-4f6c-a784-2466ee89ccc6" alt="" width="375"></div>
5. Select a location to store the program’s shortcuts and click **Next.**<br>

   <div align="left"><img src="https://1357541741-files.gitbook.io/~/files/v0/b/gitbook-x-prod.appspot.com/o/spaces%2FJOGWHv3yxVOZRUKbJJWY%2Fuploads%2FeUzMOZqUvz0Uqew3JhrS%2FUnknown%20image?alt=media&amp;token=6cb6585e-e2ee-4da1-86fb-9c6979b26d8f" alt="" width="375"></div>
6. In the **Select Additional Tasks** window, choose **The OpenSSL binaries (/bin) directory**. This copies the OpenSSL DLL files to the OpenSSL installation folder rather than the Windows system directory. Click **Next**.<br>

   <div align="left"><figure><img src="https://1357541741-files.gitbook.io/~/files/v0/b/gitbook-x-prod.appspot.com/o/spaces%2FJOGWHv3yxVOZRUKbJJWY%2Fuploads%2FzJE9PeaszYMk1U1rviZM%2Fimage.png?alt=media&amp;token=de12343f-68be-43ef-a7b7-3571abdce157" alt="" width="374"><figcaption></figcaption></figure></div>
7. Click **Install** to begin the installation.<br>

   <div align="left"><figure><img src="https://1357541741-files.gitbook.io/~/files/v0/b/gitbook-x-prod.appspot.com/o/spaces%2FJOGWHv3yxVOZRUKbJJWY%2Fuploads%2F4X4kGRg30SKsOPAhsudo%2Fimage.png?alt=media&amp;token=6666beec-06d7-4fb0-a771-ff0056a5f0d0" alt="" width="374"><figcaption></figcaption></figure></div>
8. Click **Finish** to exit the setup wizard.

### Add OpenSSL to System PATH

After installing OpenSSL on Windows, the `bin` folder (e.g., `C:\Program Files\OpenSSL-Win64\bin`) must be added to the system PATH environment variable. PATH tells Windows where to look for executables when you type a command in Command Prompt.

Without this, you would need to specify the full path to `openssl.exe` each time. Once added to PATH, you can run commands such as `openssl version` and the certificate generation commands required in later steps.

1. Press <i class="fa-windows">:windows:</i> `key + R` to open **Run**, type `sysdm.cpl`, and click **OK**.<br>

   <div align="left"><img src="https://1357541741-files.gitbook.io/~/files/v0/b/gitbook-x-prod.appspot.com/o/spaces%2FJOGWHv3yxVOZRUKbJJWY%2Fuploads%2FTJ81H62g6gZVdLqVEISy%2FUnknown%20image?alt=media&amp;token=1d790fb8-cbbe-4b52-90ce-098e317cb8b6" alt="" width="375"></div>
2. Go to **Advanced** and click **Environment Variables**<br>

   <div align="left"><img src="https://1357541741-files.gitbook.io/~/files/v0/b/gitbook-x-prod.appspot.com/o/spaces%2FJOGWHv3yxVOZRUKbJJWY%2Fuploads%2F4j2tTYCbTtnaOrGrnzoO%2FUnknown%20image?alt=media&amp;token=e269f958-1ab5-435c-8103-90daf32645db" alt="" width="375"></div>
3. In the **System Variables** section, search for **Path** and click **Edit.**<br>

   <div align="left"><img src="https://1357541741-files.gitbook.io/~/files/v0/b/gitbook-x-prod.appspot.com/o/spaces%2FJOGWHv3yxVOZRUKbJJWY%2Fuploads%2FoM7hvOexAnJofHJfntyh%2FUnknown%20image?alt=media&amp;token=99947211-f401-4082-b60e-328a17bdb817" alt="" width="375"></div>
4. Click **New** and enter the OpenSSL path `C:\Program Files\OpenSSL-Win64\bin` to the system PATH environment variable.<br>

   <div align="left"><img src="https://1357541741-files.gitbook.io/~/files/v0/b/gitbook-x-prod.appspot.com/o/spaces%2FJOGWHv3yxVOZRUKbJJWY%2Fuploads%2F24nwtmvYPUgfflpYfTEW%2FUnknown%20image?alt=media&amp;token=4762cb18-8c19-42f4-a7a9-87392a7f6f5e" alt="" width="375"></div>
5. Click **OK** on all windows to save the changes.
6. To verify OpenSSL is correctly added to PATH, open a new Command Prompt window and type `openssl version`. The OpenSSL version will be displayed.<br>

   <div align="left"><img src="https://1357541741-files.gitbook.io/~/files/v0/b/gitbook-x-prod.appspot.com/o/spaces%2FJOGWHv3yxVOZRUKbJJWY%2Fuploads%2FnEyjk1GICIHrvT4SOE9I%2FUnknown%20image?alt=media&amp;token=176a17e5-4b61-450f-b51e-b46cd3d8b3df" alt="" width="375"></div>

{% endstep %}

{% step %}

## Install IIS

Internet Information Services (IIS) is Microsoft's web server platform that hosts the GuardWare Management Console. IIS receives HTTPS requests from the browser and serves the web-based interface used to access the Management Console.

{% hint style="success" %}
Click the tabs below to view the relevant content, or use the links provided here to navigate to the desired section.

* [**Install IIS on Windows Server**](#install-iis-on-windows-server)
* [**Install IIS on Windows Desktop**](#install-iis-on-windows-alternative-option)
  {% endhint %}

{% tabs %}
{% tab title="Install IIS on Windows Server" %}

1. Click the **Start** menu, search for **Server Manager,** and open it.
2. Click **Add Roles and Features** on the home screen, or click **Manage** in the top-right corner, and select **Add Roles and Features.**<br>

   <div align="left"><img src="https://1357541741-files.gitbook.io/~/files/v0/b/gitbook-x-prod.appspot.com/o/spaces%2FJOGWHv3yxVOZRUKbJJWY%2Fuploads%2F8QkKH4ghtfoDJEvVYs3s%2FUnknown%20image?alt=media&amp;token=790bceaa-7b29-41f4-92d7-44a3b1d7eec8" alt="" width="480"></div>
3. On **Before You Begin**, click **Next.**<br>

   <div align="left"><figure><img src="https://1357541741-files.gitbook.io/~/files/v0/b/gitbook-x-prod.appspot.com/o/spaces%2FJOGWHv3yxVOZRUKbJJWY%2Fuploads%2FUsor89m8dj6eR7CKlk0l%2Fimage.png?alt=media&amp;token=575e290e-7035-4547-aae5-83d686de0755" alt="" width="563"><figcaption></figcaption></figure></div>
4. On the **Select installation type**, select **Role-based or feature-based installation,** and click **Next.**<br>

   <div align="left"><img src="https://1357541741-files.gitbook.io/~/files/v0/b/gitbook-x-prod.appspot.com/o/spaces%2FJOGWHv3yxVOZRUKbJJWY%2Fuploads%2F1AKmXAKtt5QfUPJY9Bi9%2FUnknown%20image?alt=media&amp;token=3f25fc43-5317-45cb-8571-ce9e87f3ec38" alt="" width="480"></div>
5. On **Server Selection**, click **Select a server from the server pool,** choose the server from the list, and click **Next**.<br>

   <div align="left"><img src="https://1357541741-files.gitbook.io/~/files/v0/b/gitbook-x-prod.appspot.com/o/spaces%2FJOGWHv3yxVOZRUKbJJWY%2Fuploads%2FvLhmGtyZiaEqQ4CmFKTt%2FUnknown%20image?alt=media&amp;token=6dd3f88d-dbcb-4101-a77e-0bc99b24ea7f" alt="" width="480"></div>
6. On **Server Roles**, select **Web Server (IIS)** and also select the **Include Management tools (if applicable)**. Click **Add Features** to close the window, and click **Next**.<br>

   <div align="left"><img src="https://1357541741-files.gitbook.io/~/files/v0/b/gitbook-x-prod.appspot.com/o/spaces%2FJOGWHv3yxVOZRUKbJJWY%2Fuploads%2FNOMdbUr4oCvwWLcd1qiv%2FUnknown%20image?alt=media&amp;token=f73e1d8c-2482-46d9-b733-5eb2c4f4a354" alt="" width="480"></div>
7. Click **Next** on **Features.**
8. Click **Next** on **Web Server Role (IIS)**.
9. The following features are required for GuardWare to process dynamic content through CGI, handle API requests through ISAPI extensions, compress responses for better performance, log requests for auditing, and enforce security restrictions. Expand the **Role Services** under Web Server (IIS), and add the following features:

<div align="left"><figure><img src="https://1357541741-files.gitbook.io/~/files/v0/b/gitbook-x-prod.appspot.com/o/spaces%2FJOGWHv3yxVOZRUKbJJWY%2Fuploads%2FYSunQhtlnodGJQTxY35M%2FMermaid%20Chart%20-%20Create%20complex%2C%20visual%20diagrams%20with%20text.-2026-03-03-114221.png?alt=media&amp;token=abc86d79-a9b6-4452-8065-b616fbb1f8f1" alt="" width="563"><figcaption></figcaption></figure></div>

10. Click **Next** and select **Install** to begin the installation. Wait for the installation to complete, then click **Close**.
11. Verify by opening **Run**, typing `inetmgr` to launch IIS, or navigating to `http://localhost` in a browser to confirm the IIS welcome page loads.

<div align="left"><img src="https://1357541741-files.gitbook.io/~/files/v0/b/gitbook-x-prod.appspot.com/o/spaces%2FJOGWHv3yxVOZRUKbJJWY%2Fuploads%2FBsNgEh9tmOnrI00KoVPI%2FUnknown%20image?alt=media&amp;token=774d352a-e7c8-45d1-b003-705e4ad6362e" alt="" width="375"></div>
{% endtab %}

{% tab title="Install IIS on Windows Desktop (Alternative Option)" %}

1. Open **Run,** type `optionalfeatures`, and press **Enter**.<br>

   <div align="left"><img src="https://1357541741-files.gitbook.io/~/files/v0/b/gitbook-x-prod.appspot.com/o/spaces%2FJOGWHv3yxVOZRUKbJJWY%2Fuploads%2Fr6c3ozJA39xBnx1i2drK%2FUnknown%20image?alt=media&amp;token=d73606fd-d706-4488-bf78-4d4d9c7bb8a6" alt="" width="375"></div>
2. Expand **Internet Information Services**.<br>

   <div align="left"><img src="https://1357541741-files.gitbook.io/~/files/v0/b/gitbook-x-prod.appspot.com/o/spaces%2FJOGWHv3yxVOZRUKbJJWY%2Fuploads%2FSFeNAQrG76J9VIYjVW0Q%2FUnknown%20image?alt=media&amp;token=d9214e14-97db-4cfb-8260-c2b3ee0c2cb2" alt="" width="375"></div>
3. Select and add the following features:

<div align="left"><figure><img src="https://1357541741-files.gitbook.io/~/files/v0/b/gitbook-x-prod.appspot.com/o/spaces%2FJOGWHv3yxVOZRUKbJJWY%2Fuploads%2F7v74Sov09Q8VTy0Rh8Op%2FIIS%20Desktop.png?alt=media&amp;token=06af3c7b-b5d7-456b-aeea-4f4471480d80" alt="" width="563"><figcaption></figcaption></figure></div>

4. Click **OK** to begin the installation. Wait for the installation to complete.
5. Verify by opening **Run**, typing `inetmgr` to launch IIS, or, navigating to `http://localhost` in a browser to confirm the IIS welcome page loads.

   <div align="left"><img src="https://1357541741-files.gitbook.io/~/files/v0/b/gitbook-x-prod.appspot.com/o/spaces%2FJOGWHv3yxVOZRUKbJJWY%2Fuploads%2FBsNgEh9tmOnrI00KoVPI%2FUnknown%20image?alt=media&amp;token=774d352a-e7c8-45d1-b003-705e4ad6362e" alt="" width="375"></div>

{% endtab %}
{% endtabs %}
{% endstep %}

{% step %}

## Install the IIS URL Rewrite Module

{% hint style="info" %}
Ensure [**IIS is installed**](#install-iis) before proceeding with this step.
{% endhint %}

The IIS URL Rewrite Module routes all incoming requests through `index.php`, enabling correct handling of application paths and API calls. It is required for the GuardWare Management Console to function under IIS.

1. [**Download the IIS URL Rewrite**](https://www.iis.net/downloads/microsoft/url-rewrite) installer (64-bit).<br>

   <div align="left"><figure><img src="https://1357541741-files.gitbook.io/~/files/v0/b/gitbook-x-prod.appspot.com/o/spaces%2FJOGWHv3yxVOZRUKbJJWY%2Fuploads%2FouGTrQgnKNFheTkg7Is6%2Fimage.png?alt=media&amp;token=66f2daca-0b76-47f7-86c0-1bb22991efac" alt="" width="563"><figcaption></figcaption></figure></div>
2. Locate the `.msi` and double-click to launch it.
3. On the **IIS URL Rewrite Module 2 Setup** welcome screen, read and accept the licence agreement.
4. Click **Install** to begin the URL rewrite process and wait until it completes.<br>

   <div align="left"><img src="https://1357541741-files.gitbook.io/~/files/v0/b/gitbook-x-prod.appspot.com/o/spaces%2FJOGWHv3yxVOZRUKbJJWY%2Fuploads%2FZIZ6lNJwuagTGfKZBiMD%2FUnknown%20image?alt=media&amp;token=2aa3bdab-8fb0-458f-81e7-34f631ed734e" alt="" width="375"></div>
5. Click **Finish** to exit the setup wizard.
   {% endstep %}

{% step %}

## Install Application Request Routing (ARR)

{% hint style="info" %}
Ensure [**IIS is installed**](#install-iis) before proceeding with this step.
{% endhint %}

Application Request Routing (ARR) is an IIS extension that acts as a reverse proxy between users and GuardWare. When a request is sent to the Management Console, ARR forwards it to the GuardWare application running on the appropriate backend port and returns the response to the user.

It also proxies WebSocket connections, enabling real-time communication between the Management Console and connected agents.

1. [**Download ARR**](https://www.iis.net/downloads/microsoft/application-request-routing) **(64-bit)** from Microsoft's official website.<br>

   <div align="left"><figure><img src="https://1357541741-files.gitbook.io/~/files/v0/b/gitbook-x-prod.appspot.com/o/spaces%2FJOGWHv3yxVOZRUKbJJWY%2Fuploads%2FqaDrf4zu1ynt0ialgSx5%2Fimage.png?alt=media&amp;token=356f9e1b-3f09-4bd1-b6cd-a0307af80e81" alt="" width="563"><figcaption></figcaption></figure></div>
2. Locate the `.msi` and double-click to launch it.
3. Accept the Licence Agreement and click **Install**.<br>

   <div align="left"><figure><img src="https://1357541741-files.gitbook.io/~/files/v0/b/gitbook-x-prod.appspot.com/o/spaces%2FJOGWHv3yxVOZRUKbJJWY%2Fuploads%2FWze0W0UN2wrrCF5OOiNE%2Fimage.png?alt=media&amp;token=361800ab-69f1-41eb-a9c8-077c910223f3" alt=""><figcaption></figcaption></figure></div>
4. Click **Finish** to exit the setup wizard.
   {% endstep %}

{% step %}

## Install 7-Zip

7-Zip is a file archiving tool that GuardWare uses to compress and protect server-generated files from direct modification.

1. [**Download 7-Zip**](https://www.7-zip.org/download.html) (64-bit).<br>

   <div align="left"><figure><img src="https://1357541741-files.gitbook.io/~/files/v0/b/gitbook-x-prod.appspot.com/o/spaces%2FJOGWHv3yxVOZRUKbJJWY%2Fuploads%2Fwpl34qdDQSUXuEgCpnMq%2Fimage.png?alt=media&amp;token=a73473f7-099f-473f-8406-8bc943824588" alt="" width="563"><figcaption></figcaption></figure></div>
2. Locate the `.exe` and double-click to launch it.
3. Select the installation directory and click **Install**.<br>

   <div align="left"><figure><img src="https://1357541741-files.gitbook.io/~/files/v0/b/gitbook-x-prod.appspot.com/o/spaces%2FJOGWHv3yxVOZRUKbJJWY%2Fuploads%2F0plGKP4aQ08t1M3QLUcZ%2Fimage.png?alt=media&amp;token=c23b93d7-4a50-4f2c-9751-26154ee41083" alt=""><figcaption></figcaption></figure></div>
4. Click **Close** to exit the setup.
   {% endstep %}

{% step %}

## Install the GuardWare Management Console

The GuardWare Management Console Setup prepares the runtime environment for GuardWare and connects to MySQL. Ensure you have installed and configured all prerequisites listed above before proceeding.

1. Double-click the server installer file received from [**GuardWare**](mailto:sales@guardware.com.au) or your IT service provider, and click **Next**.<br>

   <div align="left"><figure><img src="https://1357541741-files.gitbook.io/~/files/v0/b/gitbook-x-prod.appspot.com/o/spaces%2FJOGWHv3yxVOZRUKbJJWY%2Fuploads%2FjLHf4wfBGT3xss3bTfWk%2Fimage.png?alt=media&amp;token=fa0a3abe-bde3-4e88-b487-327f61e2096c" alt="" width="369"><figcaption></figcaption></figure></div>
2. Read and accept the EULA and click **Next**.<br>

   <div align="left"><figure><img src="https://1357541741-files.gitbook.io/~/files/v0/b/gitbook-x-prod.appspot.com/o/spaces%2FJOGWHv3yxVOZRUKbJJWY%2Fuploads%2FRmdfxE6gT3iWdmW8ymvh%2Fimage.png?alt=media&amp;token=fceaa395-ec36-4eb9-bd4e-8369e9c8ccec" alt="" width="368"><figcaption></figcaption></figure></div>
3. Choose a folder to install the GuardWare Server and click **Next**.<br>

   <div align="left"><figure><img src="https://1357541741-files.gitbook.io/~/files/v0/b/gitbook-x-prod.appspot.com/o/spaces%2FJOGWHv3yxVOZRUKbJJWY%2Fuploads%2Faw0HfGGRmAYbdllVVLHQ%2Fimage.png?alt=media&amp;token=4569667b-132a-4518-a337-8594a744f244" alt="" width="369"><figcaption></figcaption></figure></div>

### Fresh Installation

{% hint style="info" %}
If you have the Management Console installed and only wish to update it, jump to [**Update Management Console**](#update-management-console).
{% endhint %}

1. If installing for the first time, select **Fresh Install** and click **Next**.<br>

   <div align="left"><figure><img src="https://1357541741-files.gitbook.io/~/files/v0/b/gitbook-x-prod.appspot.com/o/spaces%2FJOGWHv3yxVOZRUKbJJWY%2Fuploads%2FHqALaMHKzz9zqlJ847vA%2Fimage.png?alt=media&amp;token=b0e368c4-445f-402a-94c3-a36b8280fb1e" alt="" width="367"><figcaption></figcaption></figure></div>
2. Enter the following information on the Configure Database Connection page:<br>

   <div align="left"><figure><img src="https://1357541741-files.gitbook.io/~/files/v0/b/gitbook-x-prod.appspot.com/o/spaces%2FJOGWHv3yxVOZRUKbJJWY%2Fuploads%2FGQRHT73n19GpkOkkYZ4r%2Fimage.png?alt=media&amp;token=d7a93d95-baf3-422a-a267-f3d15b856d16" alt="" width="370"><figcaption></figcaption></figure></div>

<table><thead><tr><th width="112">Field</th><th width="191">Particulars</th><th>Description</th></tr></thead><tbody><tr><td><strong>DB Host</strong></td><td><code>localhost</code>,<br>domain name <code>db.example.com</code> or<br><code>IP address</code></td><td>Database host address location that GuardWare connects to</td></tr><tr><td><strong>DB Port</strong></td><td><code>3306</code> (most common)</td><td>Network endpoint number that a database server uses to listen for incoming connections</td></tr><tr><td><strong>DB Name</strong></td><td>Name of the specific database you want to connect to on a database server.</td><td>Ensure the <strong>DB Name</strong> is unique to avoid conflicts with any existing MySQL databases</td></tr><tr><td><strong>DB Username</strong></td><td><code>root</code> (default)</td><td>Database user account name that GuardWare uses to log in to the database</td></tr><tr><td><strong>Password</strong></td><td>Enter password created during the MySQL setup</td><td><strong>DB Password</strong> is the password associated with the <strong>DB Username</strong>. It is used to authenticate and allow access to the database.</td></tr></tbody></table>

3. Click **Test Connection** to validate the connection with the database and click **Next**.
4. If you have configured a password for Redis, enter it here and click **Next**.<br>

   <div align="left"><figure><img src="https://1357541741-files.gitbook.io/~/files/v0/b/gitbook-x-prod.appspot.com/o/spaces%2FJOGWHv3yxVOZRUKbJJWY%2Fuploads%2FjWFuFzmSa0fg3JxYBM0p%2Fimage.png?alt=media&amp;token=c7dcb416-32ab-4ec4-be48-4a1ff486d949" alt="" width="367"><figcaption></figcaption></figure></div>
5. Enter the Super Admin's name, email, and password. Store these credentials securely, then click **Next**.

   <div align="left"><figure><img src="https://1357541741-files.gitbook.io/~/files/v0/b/gitbook-x-prod.appspot.com/o/spaces%2FJOGWHv3yxVOZRUKbJJWY%2Fuploads%2Fsqvbs7egN5oDKrRozKn0%2Fimage.png?alt=media&amp;token=ced824ad-9b34-4176-891e-3341ea968606" alt="" width="368"><figcaption></figcaption></figure></div>
6. Select **HTTPS** and enter the following information:<br>

   <div align="left"><figure><img src="https://1357541741-files.gitbook.io/~/files/v0/b/gitbook-x-prod.appspot.com/o/spaces%2FJOGWHv3yxVOZRUKbJJWY%2Fuploads%2FL60xR2bC8DLwdsFiP2SD%2Fimage.png?alt=media&amp;token=72f8e943-104b-45ad-8b4f-7f9603934838" alt="" width="371"><figcaption></figcaption></figure></div>

<table><thead><tr><th width="136">Field</th><th>Particulars</th></tr></thead><tbody><tr><td><strong>Domain Name</strong></td><td>The website address that users type in a browser to access the GuardWare Management Console.</td></tr><tr><td><strong>Certificate</strong></td><td>SSL/TLS certificate used to secure and encrypt HTTPS connections</td></tr><tr><td><strong>Certificate Password</strong></td><td>Password to access the SSL/TLS private key (if it is encrypted), which may be set during key generation or certificate export.</td></tr></tbody></table>

{% hint style="warning" %}
Provide the **Domain Name** to the GuardWare team after configuration. GuardWare uses this information to configure the required redirect URI for your Azure application.
{% endhint %}

7. Click **Install** to begin the process and wait for the installation to complete. Click **Finish** to exit the setup wizard.<br>

   <div align="left"><figure><img src="https://1357541741-files.gitbook.io/~/files/v0/b/gitbook-x-prod.appspot.com/o/spaces%2FJOGWHv3yxVOZRUKbJJWY%2Fuploads%2F7KPSm3JL5UfbUt5lNmSk%2Fimage.png?alt=media&amp;token=32403690-a512-426f-9b18-09d93a1c8501" alt="" width="371"><figcaption></figcaption></figure></div>

### Update Management Console

{% hint style="warning" %}
Select Update only if you have installed GuardWare on your device and want to update it. If GuardWare is not installed and you select **Update Existing Installation**, the server installation will fail.
{% endhint %}

1. Select **Update Existing Installation.**<br>

   <div align="left"><figure><img src="https://1357541741-files.gitbook.io/~/files/v0/b/gitbook-x-prod.appspot.com/o/spaces%2FJOGWHv3yxVOZRUKbJJWY%2Fuploads%2Fy2fM1NVzdMlwRskPOAU6%2Fimage.png?alt=media&amp;token=9455e0a2-5958-4df7-8a40-1c7e88c69819" alt="" width="371"><figcaption></figcaption></figure></div>
2. Click **Test Installation Path** to check and validate the Management Console installation path, and click **Next.**
3. Click **Install** and wait until the process completes.<br>

   <div align="left"><figure><img src="https://1357541741-files.gitbook.io/~/files/v0/b/gitbook-x-prod.appspot.com/o/spaces%2FJOGWHv3yxVOZRUKbJJWY%2Fuploads%2FyQXH8x2lwLJ5JgBLlGux%2Fimage.png?alt=media&amp;token=83e20588-1360-4fed-a2ca-55aebbd46573" alt="" width="371"><figcaption></figcaption></figure></div>
4. Click **Finish** to exit the setup wizard.
   {% endstep %}

{% step %}

## Update the Licence (For On-Prem Installations Only)

This process applies primarily to high-security environments where network and data access are tightly controlled, and internet connectivity is often restricted or prohibited entirely.

The licence activates GuardWare and grants access to the Management Console. It also determines which GuardWare products and modules are enabled for the client, ensuring that only licensed and required products become available to the user.

1. Obtain the new licence file from GuardWare and rename it to `license.txt` if required.
2. Open File Explorer and navigate to `C:\inetpub\wwwroot\backend`.
3. Replace the existing `license.txt` file with the new licence file.
   {% endstep %}

{% step %}

## Log in to the Management Console

After installation, the Management Console automatically opens in your default browser.

1. To open the Management Console manually, use the URL that matches how the server was configured.

<table><thead><tr><th width="150">Access Method</th><th width="276">URL Format</th><th>Notes</th></tr></thead><tbody><tr><td><strong>Local access</strong></td><td><p><code>https://localhost/gwapp/login</code></p><p><code>https://localhost/gwapp/&#x3C;org_name>/login</code></p></td><td>Use this when accessing GuardWare locally on the server.</td></tr><tr><td><strong>Access via configured domain</strong></td><td><p><code>https://&#x3C;domain_name>/gwapp/login</code></p><p><code>https://&#x3C;domain_name>/gwapp/&#x3C;org_name>/login</code></p></td><td>Requires the domain to resolve to GuardWare's server IP via DNS or the hosts file.</td></tr></tbody></table>

2. Navigate to the login URL and sign in with your organisation-provided credentials or Microsoft 365 account.
3. If signing in with email credentials for the first time:
   1. Set up Two-Factor Authentication by scanning the QR code with an authenticator app (Google or Microsoft Authenticator) and entering the generated verification code.
   2. Update your password when prompted.
4. Accept the EULA to proceed.

Once logged in, the Management Console is ready to use. [**Proceed to deploy agents**](broken://pages/yPDNQmmov2zrBbmKHQFy), configure data classification policies, and set up your organisation's GuardWare environment.
{% endstep %}

{% step %}

## Enable the AIP Service for MIP Protection (For PROTECT only) <a href="#id-7.-enable-the-aip-service-for-mip" id="id-7.-enable-the-aip-service-for-mip"></a>

{% hint style="info" %}
To use MIP protection, your organisation must have a Microsoft **licence** that includes Microsoft Purview Information Protection (sensitivity labelling) capabilities, such as **Microsoft 365 E3, Microsoft 365 E5, Azure Information Protection P1/P2**.
{% endhint %}

Before GuardWare PROTECT can use Microsoft Information Protection (MIP) for classification and protection, the **Azure Information Protection (AIP) service** must be active in your tenant. The AIP service manages the encryption and labelling framework used by MIP to protect files.&#x20;

Enable and verify the AIP service by running the following PowerShell commands with administrative privileges.

1. Open PowerShell as an administrator.
2. Run the following commands in order:

   ```powershell
   #1) Install the stable version known to work
   Install-Module AIPService -RequiredVersion 2.0.0.3 -Force

   # 2) Import explicitly
   Import-Module AIPService -RequiredVersion 2.0.0.3 -Force

   # 3) Connect & check (Sign in with Global Admin/Compliance Admin account)
   Connect-AipService 
   Get-AipService | Format-List
   ```

If the service status returns **Enabled**, MIP is ready for use with PROTECT.

![](https://1357541741-files.gitbook.io/~/files/v0/b/gitbook-x-prod.appspot.com/o/spaces%2FJOGWHv3yxVOZRUKbJJWY%2Fuploads%2F2NXLUT03UVsPmBFZKYh3%2FPowershell%20script.png?alt=media\&token=4f01a6e3-e6d8-40dd-a93e-ed714d438779)

If the service status returns **Disabled,** run the following command to enable the service:

![](https://1357541741-files.gitbook.io/~/files/v0/b/gitbook-x-prod.appspot.com/o/spaces%2FJOGWHv3yxVOZRUKbJJWY%2Fuploads%2Fkmu8PFH9sPFyUjPaKN1N%2Fenable%20aip%20service.png?alt=media\&token=91c670ba-b098-4707-9b6b-2ca14eea0b08)
{% endstep %}
{% endstepper %}


# Whitelist DISCOVER

Anti-virus, EDR, and XDR solutions may block, quarantine, or interfere with DISCOVER components during scanning and monitoring. This can affect the reliability of background services, monitoring agents, and other components installed by the DISCOVER Scanning Server.

To prevent interference, add the following directories and executables to your security solution's exclusion or trusted applications list.

{% hint style="warning" %}
**Configure these exclusions in your security solution before installing the Scanning Server. Most anti-virus and endpoint security tools allow exclusions to be added before the specified files or directories exist on disk. Applying exclusions after installation may result in components being blocked or quarantined during the installation process itself.**
{% endhint %}

### Directories

Adding the DISCOVER installation directory and its subdirectories ensures that security tools do not scan or flag DISCOVER components during operation.

* `C:\Program Files\Guardware\GuardWare DISCOVER`
* `C:\Program Files\Guardware\GuardWare DISCOVER\MIPLabelHandler`

### Executables

The following executables should be added individually if your security solution requires per-file exclusions rather than directory-level exclusions.

<table><thead><tr><th width="272">Executable</th><th>Path</th></tr></thead><tbody><tr><td><code>GuardWareDiscoverAgent.exe</code></td><td>C:\Program Files\Guardware\GuardWare DISCOVER</td></tr><tr><td><code>GWActiveMon.exe</code></td><td>C:\Program Files\Guardware\GuardWare DISCOVER</td></tr></tbody></table>


# Download DISCOVER Agent

The Scanning Agent, DISCOVER Agent, or simply Agent, is the Windows service that performs scan work and reports results to the Management Console. It can be deployed in two ways, depending on whether you want each device to scan itself (local scan) or a central host to scan other devices remotely (agentless scan).

{% hint style="info" %}
Before proceeding, ensure the **GuardWare Management Console** is installed and reachable.
{% endhint %}

## Configure and Download the Agent Installer

1. Log in to GuardWare Management Console.
2. Navigate to **RESOURCES** > **Agent Download** and click **DISCOVER Agent**.
3. Set the **Location** and click **Submit**.<br>

   <div align="left"><figure><img src="https://1357541741-files.gitbook.io/~/files/v0/b/gitbook-x-prod.appspot.com/o/spaces%2FJOGWHv3yxVOZRUKbJJWY%2Fuploads%2Fa9pgf3jf0FSezeNXQLgY%2Fimage.png?alt=media&amp;token=0d70a984-c3ed-4edc-91b5-90f30ea57639" alt="" width="563"><figcaption></figcaption></figure></div>
4. After saving, the **Download Installer** link becomes available. Click it to download the agent with the configured settings.
5. Update the settings whenever required and download a new agent to apply the changes.

{% hint style="warning" %}
**The installer must be present on the device where it will be installed. Download it directly on that device, or download it on another machine and transfer it across.**
{% endhint %}

After downloading, proceed to [**install the DISCOVER Scanning Server**](/getting-started/install-discover-agent/install-discover-agent)<i class="fa-arrow-right">:arrow-right:</i>&#x20;


# System and Port Requirements for DISCOVER

Before proceeding, ensure:

{% hint style="info" %}

* You have administrator rights on the device where the Scanning Agent will be installed and can access the Management Console over HTTPS.
* Have the Tenant ID, Client ID, Global admin credentials, and client secret/certificate ready if you plan to scan Microsoft 365 services.
  {% endhint %}

### System Requirements:

<table data-header-hidden="false" data-header-sticky><thead><tr><th width="126">Component</th><th width="272">Minimum Requirements for Servers Performing Remote Scans</th><th>Minimum Requirements for Endpoints Performing Local Scans</th></tr></thead><tbody><tr><td>Processor</td><td>8 cores or more</td><td>4 cores or more</td></tr><tr><td>RAM</td><td>16 GB</td><td>8 GB</td></tr><tr><td>Disk Space</td><td>Atleast 500 GB</td><td>5 GB or more</td></tr><tr><td>Operating System</td><td>Windows 10, Windows 11, Windows Server 2019+</td><td>Windows 10, Windows 11, Windows Server 2019+</td></tr></tbody></table>

### Port Requirements:

<table><thead><tr><th width="110">Port</th><th width="157">Service</th><th>Use</th></tr></thead><tbody><tr><td>22</td><td>SSH</td><td>Remote scans to other endpoints</td></tr><tr><td>443</td><td>HTTPS</td><td>Management Console, Microsoft 365, Exchange Online, SharePoint Online</td></tr><tr><td>445</td><td>SMB</td><td>Remote scans of SMB file shares</td></tr><tr><td>5985</td><td>WinRM (HTTP)</td><td>Remote scans of Windows endpoints</td></tr><tr><td>5986</td><td>WinRM (HTTPS)</td><td>Remote scans of Windows endpoints</td></tr><tr><td>3306</td><td>MySQL</td><td>DISCOVER database connection</td></tr><tr><td>6379</td><td>Redis</td><td>DISCOVER cache and message broker</td></tr></tbody></table>

For firewall setup, DISCOVER targets need **outbound** access from the scanning server for remote scans as well.


# Install DISCOVER Agent

The Scanning Agent, DISCOVER Agent, or simply Agent, is the Windows service that performs scan work and reports results to the Management Console. It can be deployed in two ways, depending on whether you want each device to scan itself (local scan) or a central host to scan other devices remotely (agentless scan).

{% hint style="warning" %}
Before installing the Agent, [**whitelist DISCOVER**](/getting-started/install-discover-agent/whitelist-discover) and confirm the host meets the [**system requirements**](/getting-started/install-discover-agent/install-discover-agent#prerequisites).
{% endhint %}

{% stepper %}
{% step %}

## Install the Agent

1. Double-click the `.msi` file to launch the installer.
2. Click **Next**, then click **Install**.
3. Wait for the installation to complete.

<div align="left"><img src="https://1357541741-files.gitbook.io/~/files/v0/b/gitbook-x-prod.appspot.com/o/spaces%2FJOGWHv3yxVOZRUKbJJWY%2Fuploads%2FaBcZeHYx8AIzrLgwedXW%2FUnknown%20image?alt=media&amp;token=798f6144-ce45-46d6-9dd1-19445e194ce9" alt="" width="375"></div>

The Scanning Agent installs and runs as a Windows background service. Once running, the scanning agent registers with the Management Console by using the device name and is ready to receive and execute instructions.

### 1.1 Verify the Installation

Confirm the Scanning Agent is running before proceeding:

1. Open **Task Manager** (`Ctrl + Shift + Esc`).
2. Click **Processes**, type **GuardWare Scan Utility** and confirm that it appears under **Background processes**.

<div align="left"><figure><img src="https://1357541741-files.gitbook.io/~/files/v0/b/gitbook-x-prod.appspot.com/o/spaces%2FJOGWHv3yxVOZRUKbJJWY%2Fuploads%2FXfLguRQbWz5UWQIWaYgi%2Fimage.png?alt=media&amp;token=fc024c5e-3ca0-4a05-b710-48ec1fad0dc3" alt="" width="480"><figcaption></figcaption></figure></div>

3. Next, open **Run**, type `services.msc`, and press **Enter**. Confirm the GuardWare scanning service is listed and running.

<div align="left"><figure><img src="https://1357541741-files.gitbook.io/~/files/v0/b/gitbook-x-prod.appspot.com/o/spaces%2FJOGWHv3yxVOZRUKbJJWY%2Fuploads%2FEkFkL7csUC5DLU4AYw4a%2Fimage.png?alt=media&amp;token=c45ff240-e5b7-4ec3-b15a-b95b325f147f" alt="" width="480"><figcaption></figcaption></figure></div>
{% endstep %}

{% step %}

## Confirm Registration

1. Open a browser and log in to the **Management Console**.
2. Navigate to **DEVICES** > **DISCOVER**.<br>

   <figure><img src="https://1357541741-files.gitbook.io/~/files/v0/b/gitbook-x-prod.appspot.com/o/spaces%2FJOGWHv3yxVOZRUKbJJWY%2Fuploads%2F2kBDwGouvW7oGj63epkb%2Fimage.png?alt=media&amp;token=8a9edc48-c09e-4fdc-b2b1-338866c24989" alt="" width="563"><figcaption></figcaption></figure>
3. Confirm the Scanning Server appears in the list and its status shows as **Online**.

If the host does not appear, confirm it can reach the Management Console host over HTTPS and that no firewall is blocking the connection.
{% endstep %}

{% step %}

## Configure Certificate Verification

If a self-signed certificate is used, whether generated automatically by the installer or provided as a `.pfx` file during installation, you need to bypass certificate verification after installation.

Bypassing certificate verification disables validation of the certificate's authenticity, not the encryption itself and communication between the Scanning Server and the Management Console remains encrypted over HTTPS using SSL/TLS.

1. Open **Registry Editor**.
2. Navigate to `Computer\HKEY_LOCAL_MACHINE\SOFTWARE\GuardWare\DISCOVER`.
3. Right-click and select **New** > **String Value**.<br>

   <div align="left"><figure><img src="https://1357541741-files.gitbook.io/~/files/v0/b/gitbook-x-prod.appspot.com/o/spaces%2FJOGWHv3yxVOZRUKbJJWY%2Fuploads%2FOqEiDpLaKojksDTbNkTH%2Fimage.png?alt=media&amp;token=4412dda8-8b36-40f2-85ac-41fa27d7ab21" alt="" width="375"><figcaption></figcaption></figure></div>
4. Name the value `cert_verification` , set the value data to `0` and click **OK**.<br>

   <div align="left"><figure><img src="https://1357541741-files.gitbook.io/~/files/v0/b/gitbook-x-prod.appspot.com/o/spaces%2FJOGWHv3yxVOZRUKbJJWY%2Fuploads%2FLmU4k61lJx2TWvE1dlCr%2Fimage.png?alt=media&amp;token=0faba66b-1e49-450d-a222-31d4c9f9aaac" alt="" width="489"><figcaption></figcaption></figure></div>
5. Close the Registry Editor.
   {% endstep %}

{% step %}

## Configure Remote Access

{% hint style="danger" %}
If you only want to perform local scans or Microsoft 365 services, **skip the Configure Remote Access section** and continue to [**Whitelist GuardWare DISCOVER**](/getting-started/install-discover-agent/whitelist-discover). The following step is only required if the Scanning Server will scan targets remotely (agentless scans).
{% endhint %}

To perform a remote scan, each target device must have the appropriate protocol configured to accept connections from the Management Console. GuardWare provides PowerShell scripts that enable the required services, set permissions, and configure firewall rules.

For Microsoft 365 targets the Scanning Server only needs outbound HTTPS access and valid Microsoft Entra ID (Azure AD) Global admin credentials.

#### Ports Required

<table><thead><tr><th width="125">Target type</th><th width="82">Protocol</th><th width="94">Port(s)</th><th width="135">Direction</th><th>Notes</th></tr></thead><tbody><tr><td>Windows endpoints</td><td>WinRM</td><td>5985 (HTTP), 5986 (HTTPS)</td><td>Outbound from scanning server</td><td>Run the WinRM configuration script on each target.</td></tr><tr><td>Other endpoints</td><td>SSH</td><td>22</td><td>Outbound from scanning server</td><td>Run the OpenSSH configuration script on each target.</td></tr><tr><td>SMB file shares</td><td>SMB</td><td>445</td><td>Outbound from scanning server</td><td>Ensure the share is accessible with valid credentials.</td></tr><tr><td>Exchange Online / SharePoint Online</td><td>HTTPS</td><td>443</td><td>Outbound from scanning server</td><td>No device-side script required. Requires Microsoft Entra ID (Azure AD) Global Admin credentials.</td></tr></tbody></table>

### Remote Configuration for Linux

Follow the steps or download and execute the script given below to configure and enable remote configuration for Linux (Ubuntu/Debian/openSUSE) devices:

{% tabs %}
{% tab title="Ubuntu/Debian" icon="ubuntu" %}
If you wish to automate the entire process, download and execute the script given below or, follow the manual process.

{% file src="/files/MOgKOfOTSiP6P3LCQ5i6" %}

1. Install the SSH server

```bash
sudo apt update
sudo apt install -y openssh-server
```

2. Enable it at boot

```bash
sudo systemctl enable ssh
```

3. Start it

```bash
sudo systemctl start ssh
```

4. Verify

```bash
sudo systemctl status ssh
```

or

```bash
ss -tlnp | grep :22
```

You should see something listening on port `22`.

5. Allow SSH through the firewall (if UFW is enabled)

```bash
sudo ufw allow ssh
sudo ufw reload
```

{% endtab %}

{% tab title="openSUSE" icon="opensuse" %}
If you wish to automate the entire process, download and execute the script given below or, follow the manual process.

{% file src="/files/IWyySGe9moDRAR13bu8X" %}

1. Install OpenSSH (usually already installed)

```bash
sudo zypper install openssh
```

2. Enable the service

```bash
sudo systemctl enable sshd
```

3. Start it

```bash
sudo systemctl start sshd
```

4. Verify

```bash
sudo systemctl status sshd
```

or

```bash
ss -tlnp | grep :22
```

5. Open the firewall. If using firewalld:

```bash
sudo firewall-cmd --permanent --add-service=ssh
sudo firewall-cmd --reload
```

{% endtab %}
{% endtabs %}

### Remote Configuration for Windows

To enable remote management on Windows devices, you can choose to configure either WinRM or OpenSSH.

#### WinRM Configuration

Download and run the script as administrator to allow it to enable WinRM on your Windows device.

{% file src="/files/QGcrBEnqg5wceCeSpeGl" %}

#### SSH Configuration

Download **both files in the same folder** and double-click the `.bat` file to execute the script and enable SSH on your Windows device.&#x20;

{% file src="/files/P8S60CI03zGLfHhsIG6c" %}

{% file src="/files/IZX0BRN1uee5A0Ujjnz6" %}

### Remote Configuration Script Deployment Methods

{% hint style="info" %}
[**Microsoft Intune**](#deploy-script-via-microsoft-intune)

Recommended for cloud-managed or Entra ID (Azure AD)-joined devices. Go to the Intune admin center and deploy the script.

[**Group Policy (GPMC)**](#deploy-script-via-group-policy-management-console)

Recommended for Active Directory-joined devices. Assign as a Startup or Logon script via the Group Policy Management Console.

[**Local Deployment**](#deploy-the-script-locally)

Run the script directly on each target device using PowerShell with administrator rights. Suitable for small environments or one-off targets.
{% endhint %}

<details open>

<summary><strong>Deploy Script via Microsoft Intune</strong></summary>

Use this method for devices enrolled in Microsoft Intune and joined to Microsoft Entra ID (Azure AD). Devices must be running Windows 10 or 11 (version 1607 or later, excluding Home and S Mode) with .NET Framework 4.7.2 or later installed.

1. Open the [Microsoft Intune admin center](https://endpoint.microsoft.com/) and sign in using your administrator credentials.
2. Go to **Devices** > **Scripts and remediations** > **Platform scripts** and click **+Add**.

<div align="left"><img src="https://1357541741-files.gitbook.io/~/files/v0/b/gitbook-x-prod.appspot.com/o/spaces%2FJOGWHv3yxVOZRUKbJJWY%2Fuploads%2F6IRKZeFYttaSNggyd52Z%2FUnknown%20image?alt=media&amp;token=a652754a-ac67-42dd-bbb0-903b2df53125" alt="" width="563"></div>

3. Enter a **Name** for your script (e.g., *Configure WinRM* or *Configure SSH*), add a **Description** (optional), and click **Next**.

<div align="left"><figure><img src="https://1357541741-files.gitbook.io/~/files/v0/b/gitbook-x-prod.appspot.com/o/spaces%2FJOGWHv3yxVOZRUKbJJWY%2Fuploads%2Fn5LEFAgHpYG3tGSJL9ys%2Fimage.png?alt=media&amp;token=c094eb29-db7b-4698-87aa-a8b8aa3c4453" alt="" width="375"><figcaption></figcaption></figure></div>

4. Click the **folder icon** and upload the provided PowerShell script.
   1. Set to **No** to run as **System** (recommended for admin-level operations like remote access).
   2. **Enforce script signature check:** Enable only if your script is digitally signed.
   3. **Run the script in 64-bit PowerShell:** Set to **Yes**, then click **Next.**

<div align="left"><figure><img src="https://1357541741-files.gitbook.io/~/files/v0/b/gitbook-x-prod.appspot.com/o/spaces%2FJOGWHv3yxVOZRUKbJJWY%2Fuploads%2F1rZlOOcq0H78SJOxLV3U%2Fimage.png?alt=media&amp;token=fda376ff-05cd-4f36-a521-7a9589a3e504" alt="" width="375"><figcaption></figcaption></figure></div>

5. If your organisation uses **scope tags** for role-based access control, add them here and click **Next**.
6. Under **Included groups**, click **Add groups** and select the Entra ID (Azure AD) user or device groups you want to target.

<div align="left"><img src="https://1357541741-files.gitbook.io/~/files/v0/b/gitbook-x-prod.appspot.com/o/spaces%2FJOGWHv3yxVOZRUKbJJWY%2Fuploads%2F7I3qYWchsZB3FniivlyV%2FUnknown%20image?alt=media&amp;token=491cb4d1-2899-426f-aaba-876cddb16476" alt="" width="563"></div>

7. Optionally, configure **Excluded groups** and click **Next**.

<div align="left"><img src="https://1357541741-files.gitbook.io/~/files/v0/b/gitbook-x-prod.appspot.com/o/spaces%2FJOGWHv3yxVOZRUKbJJWY%2Fuploads%2FF6q15Wz9b6QMI5RTikdh%2FUnknown%20image?alt=media&amp;token=3935cbfc-940f-4baf-b817-9aaa113e697d" alt="" width="563"></div>

8. Review your configuration, then click **Create** to deploy the script.

<div align="left"><img src="https://1357541741-files.gitbook.io/~/files/v0/b/gitbook-x-prod.appspot.com/o/spaces%2FJOGWHv3yxVOZRUKbJJWY%2Fuploads%2FAKI5SO9ccuK1kyeVURXY%2FUnknown%20image?alt=media&amp;token=41826c1f-463d-4e0b-b176-07da226de4ed" alt="" width="563"></div>

</details>

<details>

<summary><strong>Deploy Script via Group Policy Management Console</strong></summary>

Use this method for devices joined to an Active Directory domain. The script runs automatically on target devices depending on the policy type assigned.

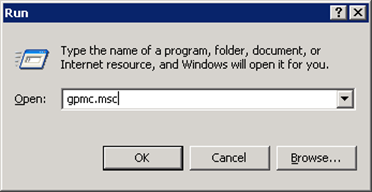
1. Press **Windows + R**, type `gpmc.msc`, and press **Enter** to open the **Group Policy Management Console (GPMC)**.

<div align="left"><img src="https://1357541741-files.gitbook.io/~/files/v0/b/gitbook-x-prod.appspot.com/o/spaces%2FJOGWHv3yxVOZRUKbJJWY%2Fuploads%2FqghlAntWxiZ43e3S6Amv%2FUnknown%20image?alt=media&amp;token=4ae925f7-4c1d-47c0-91e0-d38671ecc317" alt="" width="375"></div>

2. In the GPMC console, navigate to the **Organizational Unit (OU)** that contains the target devices.
3. Right-click the OU and select **Create a GPO in this domain, and Link it here**.

<div align="left"><img src="https://1357541741-files.gitbook.io/~/files/v0/b/gitbook-x-prod.appspot.com/o/spaces%2FJOGWHv3yxVOZRUKbJJWY%2Fuploads%2Fc5eRWHutJ281tk2qCx04%2FUnknown%20image?alt=media&amp;token=67802a75-40f2-4526-bf3c-ae7bc848ad10" alt="" width="563"></div>

4. Enter a name for the GPO (e.g., Remote Access Configuration) and click **OK**.

<div align="left"><img src="https://1357541741-files.gitbook.io/~/files/v0/b/gitbook-x-prod.appspot.com/o/spaces%2FJOGWHv3yxVOZRUKbJJWY%2Fuploads%2FVmZusn86Gua3ECSBxhgz%2FUnknown%20image?alt=media&amp;token=6c05be36-8b13-481e-8bd1-eb59373014cb" alt="" width="563"></div>

5. Right-click the newly created GPO and select **Edit** to open the **Group Policy Management Editor**.

<div align="left"><img src="https://1357541741-files.gitbook.io/~/files/v0/b/gitbook-x-prod.appspot.com/o/spaces%2FJOGWHv3yxVOZRUKbJJWY%2Fuploads%2F441O0pRno558h0qxz94A%2FUnknown%20image?alt=media&amp;token=47c16b6f-7ebf-4990-88fe-49f329355cf0" alt="" width="563"></div>

6. To deploy the script as a **Startup script (runs as System)**, navigate to **Computer Configuration** > **Policies** > **Windows Settings** > **Scripts (Startup/Shutdown)** > **Startup.**

<div align="left"><img src="https://1357541741-files.gitbook.io/~/files/v0/b/gitbook-x-prod.appspot.com/o/spaces%2FJOGWHv3yxVOZRUKbJJWY%2Fuploads%2Fxy3sDzaNROVFNJUC3Tyb%2FUnknown%20image?alt=media&amp;token=4b7192b0-ec64-4e0e-a1a5-b173cb275827" alt="" width="563"></div>

7. Click **Add**, then **Browse** to select your PowerShell script, or enter the **network path** if stored on a shared location, and click **OK** to save.

<div align="left"><img src="https://1357541741-files.gitbook.io/~/files/v0/b/gitbook-x-prod.appspot.com/o/spaces%2FJOGWHv3yxVOZRUKbJJWY%2Fuploads%2FoF9Ozy9p91YBmuT9ASf2%2FUnknown%20image?alt=media&amp;token=50389fca-a259-425e-988f-aedc80544396" alt="" width="563"></div>

8. To deploy the script as a **Logon script (runs as the logged-in user)**, navigate to **User Configuration** > **Policies** > **Windows Settings** > **Scripts (Logon/Logoff)** > **Logon**.

<div align="left"><img src="https://1357541741-files.gitbook.io/~/files/v0/b/gitbook-x-prod.appspot.com/o/spaces%2FJOGWHv3yxVOZRUKbJJWY%2Fuploads%2F9kwSzpkIknQnr3rPEnW8%2FUnknown%20image?alt=media&amp;token=62a85a90-e572-4d20-ae31-98c76c7978d9" alt="" width="563"></div>

9. Click **Add**, then **Browse** to select your PowerShell script and click **OK** to save.

<div align="left"><img src="https://1357541741-files.gitbook.io/~/files/v0/b/gitbook-x-prod.appspot.com/o/spaces%2FJOGWHv3yxVOZRUKbJJWY%2Fuploads%2FhKJ7jgNr6ajECkL4XxWV%2FUnknown%20image?alt=media&amp;token=25fbb4c2-9862-4fb7-8b45-c2c1c0735a5d" alt="" width="563"></div>

10. Close the editor, then ensure the GPO is **linked to the correct OU** that contains the target devices.
11. On a target device, open **Command Prompt** and run `gpupdate /force` to apply the new policy immediately, or wait for the next automatic Group Policy refresh.

<div align="left"><img src="https://1357541741-files.gitbook.io/~/files/v0/b/gitbook-x-prod.appspot.com/o/spaces%2FJOGWHv3yxVOZRUKbJJWY%2Fuploads%2FbRBAdaiIonPO7LitTQld%2FUnknown%20image?alt=media&amp;token=94204d24-c6e6-47bc-a8a5-659004b5e4e8" alt="" width="375"></div>

Once deployed, the script executes on target devices based on the assigned policy type (**Startup** or **Logon**) and automatically applies the intended configuration.

</details>

<details>

<summary><strong>Deploy the Script Locally</strong></summary>

Use this method to run the configuration script directly on an individual target device. Before running the SSH script, configure SSH sessions to open in PowerShell rather than the default Command Prompt.

#### Set PowerShell as the SSH default shell (SSH targets only)

1. Open **Run** and type `regedit` to open the **Registry Editor**.

<div align="left"><img src="https://1357541741-files.gitbook.io/~/files/v0/b/gitbook-x-prod.appspot.com/o/spaces%2FJOGWHv3yxVOZRUKbJJWY%2Fuploads%2FWwzM3D28w5yvjr9VrbEg%2FUnknown%20image?alt=media&amp;token=784fe1d4-d768-4fb7-bcea-a24c00537700" alt="" width="375"></div>

2. Navigate to `Computer\HKEY_LOCAL_MACHINE\SOFTWARE\OpenSSH`.

<div align="left"><img src="https://1357541741-files.gitbook.io/~/files/v0/b/gitbook-x-prod.appspot.com/o/spaces%2FJOGWHv3yxVOZRUKbJJWY%2Fuploads%2FJx1k53zyK0GtIx6gsOVQ%2FUnknown%20image?alt=media&amp;token=078ef241-7f66-40d2-9a5e-d2962fa711f6" alt="" width="563"></div>

3. Check for a string-value file named `DefaultShell`. If the file is not there, right-click on a space and select **New** > **String Value**. Name the value `DefaultShell` and open it.

<div align="left"><img src="https://1357541741-files.gitbook.io/~/files/v0/b/gitbook-x-prod.appspot.com/o/spaces%2FJOGWHv3yxVOZRUKbJJWY%2Fuploads%2FePuV3Kz6Z61cHEwFycD5%2FUnknown%20image?alt=media&amp;token=120c65bc-7f3b-4de9-8ee8-900f806791a2" alt="" width="375"></div>

4. Set the value data to:\
   `C:\Windows\System32\WindowsPowerShell\v1.0\powershell.exe`.\
   If PowerShell Core is installed and preferred, you may need to enter:\
   `C:\Program Files\PowerShell\7\pwsh.exe`.

<div align="left"><img src="https://1357541741-files.gitbook.io/~/files/v0/b/gitbook-x-prod.appspot.com/o/spaces%2FJOGWHv3yxVOZRUKbJJWY%2Fuploads%2FBcStQBFZHH5ThJNwEKVt%2FUnknown%20image?alt=media&amp;token=89a27fc9-cfc5-44d4-b890-048218bbd47b" alt="" width="375"></div>

5. Close the Registry Editor.

#### Run the Remote Configuration Script

1. Click **Start**, type **`PowerShell`** , right-click it, and select **Run as administrator**.

<div align="left"><img src="https://1357541741-files.gitbook.io/~/files/v0/b/gitbook-x-prod.appspot.com/o/spaces%2FJOGWHv3yxVOZRUKbJJWY%2Fuploads%2FEuV8SOPaZhcKSZjnrUnt%2FUnknown%20image?alt=media&amp;token=f336befe-51ab-4c68-8fbe-ca5c610f7f36" alt="" width="375"></div>

2. Run the following commands, replacing the filename with the script you are deploying:

{% code overflow="wrap" %}

```powershell
##Replace WinRM Configuration.ps1 with OpenSSH Configuration.ps1 if configuring SSH targets.

$scriptPath = Join-Path $env:USERPROFILE "Downloads\WinRM Configuration.ps1"
& $scriptPath
```

{% endcode %}

<figure><img src="https://1357541741-files.gitbook.io/~/files/v0/b/gitbook-x-prod.appspot.com/o/spaces%2FJOGWHv3yxVOZRUKbJJWY%2Fuploads%2FQlTmQjhJaabJMRFUWWzF%2Fimage.png?alt=media&amp;token=6fd9edda-95f6-47c7-8cc2-2bef15ae0c12" alt=""><figcaption></figcaption></figure>

3. Close **PowerShell.**

</details>
{% endstep %}
{% endstepper %}


# Whitelist INSIGHT

The GuardWare INSIGHT Agent installs multiple components, including background services, monitoring agents, executables, and system drivers. These components may be incorrectly flagged or blocked by Anti-Virus, EDR, or XDR solutions. To prevent this, add the INSIGHT components to your security software’s whitelist or trusted applications list.

Whitelist the entire installation directory and the following components individually:

```
C:\Program Files (x86)\Guardware
C:\ProgramData\Guardware
```

**Executable Applications (.exe)**

<table><thead><tr><th width="69.20001220703125" data-type="number">SN</th><th width="178.79998779296875">Component</th><th>Path</th></tr></thead><tbody><tr><td>1</td><td>GWApplication.exe</td><td>C:\Program Files (x86)\Guardware\INSIGHT\GWApplication.exe</td></tr><tr><td>2</td><td>GWChromiumProxy.exe</td><td>C:\Program Files (x86)\Guardware\INSIGHT\GWChromiumProxy.exe</td></tr><tr><td>3</td><td>GWClient.exe</td><td>C:\Program Files (x86)\Guardware\INSIGHT\GWClient.exe</td></tr><tr><td>4</td><td>GWConsole.exe</td><td>C:\Program Files (x86)\Guardware\INSIGHT\GWConsole.exe</td></tr><tr><td>5</td><td>GWFPInstaller.exe</td><td>C:\Program Files (x86)\Guardware\INSIGHT\GWFPInstaller.exe</td></tr><tr><td>6</td><td>GWHardware.exe</td><td>C:\Program Files (x86)\Guardware\INSIGHT\GWHardware.exe</td></tr><tr><td>7</td><td>GWHelperProcess64.exe</td><td>C:\Program Files (x86)\Guardware\INSIGHT\GWHelperProcess64.exe</td></tr><tr><td>8</td><td>GWInstallSecurity.exe</td><td>C:\Program Files (x86)\Guardware\INSIGHT\GWInstallSecurity.exe</td></tr><tr><td>9</td><td>GWProxy.exe</td><td>C:\Program Files (x86)\Guardware\INSIGHT\GWProxy.exe</td></tr><tr><td>10</td><td>GWProxyEncrypt.exe</td><td>C:\Program Files (x86)\Guardware\INSIGHT\GWProxyEncrypt.exe</td></tr><tr><td>11</td><td>GWSyncMonitor.exe</td><td>C:\Program Files (x86)\Guardware\INSIGHT\GWSyncMonitor.exe</td></tr><tr><td>12</td><td>GWW.exe</td><td>C:\Program Files (x86)\Guardware\INSIGHT\GWW.exe</td></tr><tr><td>13</td><td>GWWarn.exe</td><td>C:\Program Files (x86)\Guardware\INSIGHT\GWWarn.exe</td></tr><tr><td>14</td><td>install_driver.exe</td><td>C:\Program Files (x86)\Guardware\INSIGHT\install_driver.exe</td></tr><tr><td>15</td><td>installSecurity.exe</td><td>C:\Program Files (x86)\Guardware\INSIGHT\installSecurity.exe</td></tr><tr><td>16</td><td>ManageExplorer.exe</td><td>C:\Program Files (x86)\Guardware\INSIGHT\ManageExplorer.exe</td></tr><tr><td>17</td><td>ManageExplorer32.exe</td><td>C:\Program Files (x86)\Guardware\INSIGHT\ManageExplorer32.exe</td></tr><tr><td>18</td><td>ManageExplorer64.exe</td><td>C:\Program Files (x86)\Guardware\INSIGHT\ManageExplorer64.exe</td></tr><tr><td>19</td><td>MSMInstallerNet35.exe</td><td>C:\Program Files (x86)\Guardware\INSIGHT\MSMInstallerNet35.exe</td></tr><tr><td>20</td><td>MSMInstallerNet40.exe</td><td>C:\Program Files (x86)\Guardware\INSIGHT\MSMInstallerNet40.exe</td></tr><tr><td>21</td><td>RegisterLSP32.exe</td><td>C:\Program Files (x86)\Guardware\INSIGHT\RegisterLSP32.exe</td></tr><tr><td>22</td><td>RegisterLSP64.exe</td><td>C:\Program Files (x86)\Guardware\INSIGHT\RegisterLSP64.exe</td></tr><tr><td>23</td><td>ScreenDPI.exe</td><td>C:\Program Files (x86)\Guardware\INSIGHT\ScreenDPI.exe</td></tr><tr><td>24</td><td>SSExplorerLauncher.exe</td><td>C:\Program Files (x86)\Guardware\INSIGHT\SSExplorerLauncher.exe</td></tr><tr><td>25</td><td>SSHelperProcess64.exe</td><td>C:\Program Files (x86)\Guardware\INSIGHT\SSHelperProcess64.exe</td></tr><tr><td>26</td><td>Updater.exe</td><td>C:\Program Files (x86)\Guardware\INSIGHT\Updater.exe</td></tr></tbody></table>

## Firewall Configuration (If Required)

Firewall configuration is only required in environments where SSL inspection (HTTPS inspection) or strict outbound filtering is enabled.

In such cases, we recommend allowing and excluding INSIGHT-related traffic to ensure uninterrupted communication between the INSIGHT agent and the server.

#### Whitelist Guardware Server Domains

Add the following domain to your firewall’s allowlist or SSL inspection bypass list:

* `*.guardware.com.au`
* Example: `live07.guardware.com.au`

This ensures that traffic between the agent and server is not intercepted or modified.

#### Allow HTTPS Communication (Port 443)

Allow:

* Outbound HTTPS (TCP port 443)
* Inbound HTTPS (if required by your network policies)

#### Application-Based Firewall (If Applicable)

If your firewall uses application-level filtering, allow the following executable:

* `GWClient.exe`

This ensures that the INSIGHT agent can communicate with the server without restriction.


# Download INSIGHT Agent

The **GuardWare INSIGHT Agent** is installed on endpoint devices, such as desktops, laptops, and servers, within your organisation. It continuously monitors user activities and file interactions, such as file uploads, downloads, and copies, email attachments, print actions, and access to non-corporate websites and applications.

You can **download** the INSIGHT Agent directly **from the Management Console**. The downloaded agent includes the MSI configuration defined for your organisation, so no additional setup is required during installation.

## Prerequisite

To download the agent, you must first set up the Agent Installation Settings. These settings allow administrators to configure installation parameters for the GuardWare INSIGHT Agent MSI installer.&#x20;

The download link only appears after the configuration is complete.&#x20;

### Set up Agent Installation

1. Log in to the Management Console.
2. Navigate to **RESOURCES** > **Agent Download**, click **INSIGHT Agent**, and enter the following details.
3. **Organisation ID:** Enter the organisation identifier under which agents are registered.
4. **Server Name:** Enter the hostname or domain of the server that agents connect to.
5. **Server IP:** Enter the IP address of the server. This is used by the agents to establish communication with the server.
6. **Server Port**: Enter the port used for communication between the agent and the server. Ensure the port is allowed in the firewall when required. The standard HTTPS port is 443.
7. **Location:** Specify the location or site of the endpoint.
8. **Update Link**: Specify the URL of the agent update control file if it is hosted on a different server than the default. By default, agents look for this file on the connected Windows Server; however, you can use this field to point to a different server or location from which the agent retrieves update information.
9. **Uninstall Client Before Execute**: Enable this option to remove any existing agent before installing a new one. Use this when upgrading or redeploying the agent.&#x20;
10. **Proxy Override**: Enable **Proxy Override** and specify the override addresses or domains that should bypass the proxy. Traffic to these destinations is sent directly.
11. **Proxy Authentication**: Enable this option if the proxy requires authentication.
12. **Is Proxy Server**: Enable **Is Proxy Authentication** if endpoints connect to the server through a proxy.
    1. **Proxy Username**: Enter the username used to authenticate with the proxy server.
    2. **Proxy Password**: Enter the password used to authenticate with the proxy server.
13. **Advanced Options:**
    1. **Retain Advanced Options**: Enable this option to preserve selected advanced settings during updates or reinstallation.
    2. **Option Use WFP**: Enable this option to use Windows Filtering Platform (WFP) for network-level monitoring and control.
    3. **Option Kill Browsers During Uninstall**: Enable this option to close running browsers during uninstallation to avoid conflicts.
    4. **Option Server Installer**: Enable this option to allow the agent to be installed on a Windows Server. By default, installation is blocked on server operating systems; enabling this option overrides that restriction.
    5. **Option Check Close Wait**: Enable this option to ensure required applications are closed before installation continues.
14. **Driver Options:**
    1. **Retain Driver Option**: Enable this option to preserve selected driver settings during updates.
    2. **Enable** the required drivers. For a fresh installation, we recommend enabling all the following  drivers:
       1\.       GWDogFile: Prevents renaming and deletion of INSIGHT agent system files.
       2\. GWScanner: Monitors USB file transfers with respect to productivity functionality.
       3\. GWProcessGuardian: Prevents termination of INSIGHT agent processes.
       4\.       USBMon: Monitors USB file transfers for DLP functionality.
       5\. ChatDocMon: Monitors chat and cloud applications.
       6\. GWProxy: Monitors higher-level network traffic.
15. Click **Submit**.<br>

    <figure><img src="https://1357541741-files.gitbook.io/~/files/v0/b/gitbook-x-prod.appspot.com/o/spaces%2FJOGWHv3yxVOZRUKbJJWY%2Fuploads%2Fxab0cvkVCk0PTfl0zZmC%2FINSIGHT%20Agent%20Configuration.png?alt=media&amp;token=df903a27-5b7f-4e40-b4cc-06e05b52aeeb" alt=""><figcaption></figcaption></figure>

## Download the Agent

Once the installation settings are complete, the **Download Installer** link becomes available. Click it to download the agent with the configured settings.

<figure><img src="https://1357541741-files.gitbook.io/~/files/v0/b/gitbook-x-prod.appspot.com/o/spaces%2FJOGWHv3yxVOZRUKbJJWY%2Fuploads%2FeJQNXskfuBF2z9AhJYB5%2FINSIGHT%20MSI%20Ready.png?alt=media&amp;token=350594a7-0893-40bd-a0ff-132c1a594923" alt=""><figcaption></figcaption></figure>

{% hint style="info" %}
Update the settings whenever required and download a new agent to apply the changes.
{% endhint %}

For deployment instructions, see [Install INSIGHT Agent](/getting-started/install-insight-agent/install-insight-agent).


# System Requirements for INSIGHT

Verify that endpoint devices meet the following requirements before installing the Agent.

<table><thead><tr><th width="307">Component</th><th width="372">Minimum Requirements</th></tr></thead><tbody><tr><td><strong>Processor</strong></td><td> 8 core or higher</td></tr><tr><td><strong>Memory</strong></td><td>16 GB RAM</td></tr><tr><td><strong>Disk Space</strong></td><td>500 MB free</td></tr><tr><td><strong>Operating System</strong></td><td>Microsoft Windows 10 or later</td></tr></tbody></table>


# Install INSIGHT Agent

The GuardWare INSIGHT Agent is installed on endpoint devices and runs as a background service, continuously monitoring user activity and data movement. Activity data is transmitted securely to the INSIGHT Management Console via HTTPS, where administrators can review logs, identify risky behaviour, and enforce policies.

With the Agent deployed, organisations gain visibility into endpoint activity, apply protection policies at the device level, and detect or prevent data exfiltration attempts.

{% hint style="warning" %}
Before installing the Agent, [**whitelist INSIGHT**](/getting-started/install-insight-agent/whitelist-insight) and confirm the device meets the [**system requirements**](/getting-started/install-insight-agent/install-insight-agent#system-requirements).
{% endhint %}

## Installation Methods

The Agent supports multiple deployment methods to suit different infrastructure requirements.

{% hint style="info" %}
INSIGHT v5 can be installed directly over an existing INSIGHT v4 installation. To upgrade, follow the standard installation procedure mentioned below.
{% endhint %}

<table data-header-hidden="false" data-header-sticky><thead><tr><th width="248">Installation Type</th><th>Description</th></tr></thead><tbody><tr><td><a href="#manual-installation"><strong>Manual Installation</strong></a></td><td>Suitable for individual devices or small-scale deployments.</td></tr><tr><td><a href="#active-directory-deployment"><strong>Active Directory</strong></a></td><td>Automated deployment across domain-joined devices via Group Policy.</td></tr><tr><td><a href="#microsoft-intune-deployment"><strong>Microsoft Intune</strong></a></td><td>Cloud-based deployment for enrolled Windows devices.</td></tr><tr><td><a href="#third-party-deployment"><strong>Third-Party Solutions</strong></a></td><td>RMM tools for enterprise-scale deployments.</td></tr></tbody></table>

<details open>

<summary>Manual Installation</summary>

Manual installation is performed by running the installer directly on each endpoint device and completing the setup wizard.

1. Double-click the installer file.
2. In the Setup Wizard, click **Next** to continue.

   <div align="left"><img src="https://1357541741-files.gitbook.io/~/files/v0/b/gitbook-x-prod.appspot.com/o/spaces%2FJOGWHv3yxVOZRUKbJJWY%2Fuploads%2FnQWOSgfCN8smnO4eeoRK%2FUnknown%20image?alt=media&amp;token=7c8bdc8b-95c2-4072-a3c8-dc3e03a01c72" alt="" width="375"></div>
3. The Agent will be installed in `C:\Program Files (x86)\Guardware\INSIGHT`. Click **Next** to continue.

   <div align="left"><figure><img src="https://1357541741-files.gitbook.io/~/files/v0/b/gitbook-x-prod.appspot.com/o/spaces%2FJOGWHv3yxVOZRUKbJJWY%2Fuploads%2Fzje1ZVgQlFu0sENxbgIG%2Fimage.png?alt=media&amp;token=b5959b8f-f04e-4c44-99ab-562feabf4dca" alt="" width="375"><figcaption></figcaption></figure></div>
4. Click **Install** to begin the installation. The installation may take a few minutes to complete.<br>

   <div align="left"><figure><img src="https://1357541741-files.gitbook.io/~/files/v0/b/gitbook-x-prod.appspot.com/o/spaces%2FJOGWHv3yxVOZRUKbJJWY%2Fuploads%2F7GUMPci0XskRYdTcYtf9%2Fimage.png?alt=media&amp;token=9f1f73c6-a73f-4ec2-bf75-afb29a3aeaf8" alt="" width="375"><figcaption></figcaption></figure></div>
5. If a User Account Control (UAC) prompt appears, verify that the publisher is listed as **GuardWare Australia Pty Ltd**, then click **Yes** to proceed. Clicking **No** cancels the installation.
6. Once the installation is complete, click **Finish** to exit the wizard.

</details>

<details>

<summary>Active Directory Deployment</summary>

Group Policy-based deployment automates Agent installation across multiple domain-joined computers. This method ensures consistent deployment across organisational units with minimal manual intervention.

1. On the domain controller or an admin workstation with RSAT installed, open **Active Directory Users and Computers**.

   <div align="left"><img src="https://1357541741-files.gitbook.io/~/files/v0/b/gitbook-x-prod.appspot.com/o/spaces%2FJOGWHv3yxVOZRUKbJJWY%2Fuploads%2FSohfeUF96gD0k7aygy3F%2FUnknown%20image?alt=media&amp;token=531e78b2-43a5-43e1-8de1-5f9d29720d0c" alt="" width="375"></div>
2. On the toolbar, click **Create a new Organisational Unit (OU).** A dedicated OU prevents the deployment policy from conflicting with existing group policies.

   <div align="left"><img src="https://1357541741-files.gitbook.io/~/files/v0/b/gitbook-x-prod.appspot.com/o/spaces%2FJOGWHv3yxVOZRUKbJJWY%2Fuploads%2F8ZLyhxrp6gyh4nB34RrH%2FUnknown%20image?alt=media&amp;token=0cabba47-291c-40a2-bf4b-ac4528504081" alt="" width="563"></div>
3. Enter a name for the new OU, for example, **Install GW Agent v5,** and click **OK**.

   <div align="left"><img src="https://1357541741-files.gitbook.io/~/files/v0/b/gitbook-x-prod.appspot.com/o/spaces%2FJOGWHv3yxVOZRUKbJJWY%2Fuploads%2FkisId7SEV8hH2rGq2vYA%2FUnknown%20image?alt=media&amp;token=96e1d17f-9e1e-4eaf-b527-64a08420c2d6" alt="" width="375"></div>
4. Search for **Group Policy Management** and click to launch the console.

   <div align="left"><img src="https://1357541741-files.gitbook.io/~/files/v0/b/gitbook-x-prod.appspot.com/o/spaces%2FJOGWHv3yxVOZRUKbJJWY%2Fuploads%2FcRSC1TqFQIsVmJ3Y4ZKJ%2FUnknown%20image?alt=media&amp;token=83292380-bd53-4902-b878-8be78ae182f6" alt="" width="563"></div>
5. Locate the new OU, right-click it, and select **Create a GPO in this domain, and Link it here…**
6. Enter a descriptive name for the policy, such as **GW INSIGHT v5 Installation**, and click **OK**. The same GPO can be linked to additional OUs if required.

   <div align="left"><img src="https://1357541741-files.gitbook.io/~/files/v0/b/gitbook-x-prod.appspot.com/o/spaces%2FJOGWHv3yxVOZRUKbJJWY%2Fuploads%2FBu2WWKBVvFrjBNJIuAGB%2FUnknown%20image?alt=media&amp;token=69ea104a-42da-4a57-89f9-adcd9e3b1141" alt="" width="563"></div>
7. Right-click the new GPO and select **Edit** to open the **Group Policy Object Editor**.

   <div align="left"><img src="https://1357541741-files.gitbook.io/~/files/v0/b/gitbook-x-prod.appspot.com/o/spaces%2FJOGWHv3yxVOZRUKbJJWY%2Fuploads%2FLsH52R3DfrdQS0jXDaIY%2FUnknown%20image?alt=media&amp;token=211ab3e9-965f-49e7-a46f-1c48e874f2ec" alt="" width="563"></div>
8. In the GPM editor, go to **Computer Configuration** > **Policies** > **Software Settings** > **Software Installation**.

   <div align="left"><img src="https://1357541741-files.gitbook.io/~/files/v0/b/gitbook-x-prod.appspot.com/o/spaces%2FJOGWHv3yxVOZRUKbJJWY%2Fuploads%2FqWtNoq5ZAj85PBfAkZJ2%2FUnknown%20image?alt=media&amp;token=6cd5abe1-a505-4481-ba0f-e3a58b7fa0d4" alt="" width="563"></div>
9. Right-click **Software Installation**, select **New** > **Package…**, and browse to the v5 Agent MSI file.

   <div align="left"><img src="https://1357541741-files.gitbook.io/~/files/v0/b/gitbook-x-prod.appspot.com/o/spaces%2FJOGWHv3yxVOZRUKbJJWY%2Fuploads%2FIMnEj5ktDHYkcdwYZjGR%2FUnknown%20image?alt=media&amp;token=f9b665df-fd0b-4110-a67b-3f6a7c6f6f52" alt="" width="563"></div>
10. Enter the package path using the FQDN (Fully Qualified Domain Name) format, for example, `\\DC01\client\Agent.msi`, where `DC01` is the name of your domain controller, and `client` is the shared folder containing the MSI installer.
11. Select the package, click **Open** to add it to the policy, then close the **Group Policy Object Editor** once the package has been added.

    <div align="left"><img src="https://1357541741-files.gitbook.io/~/files/v0/b/gitbook-x-prod.appspot.com/o/spaces%2FJOGWHv3yxVOZRUKbJJWY%2Fuploads%2FGqNUxtKIztMWBFFc1cjb%2FUnknown%20image?alt=media&amp;token=d5aa9708-2c01-4e0f-8c84-2364908b74fa" alt="" width="563"></div>
12. In the Group Policy Management Console, confirm the new GPO is listed under **Linked Group Policy Objects** for the selected OU.

    <div align="left"><img src="https://1357541741-files.gitbook.io/~/files/v0/b/gitbook-x-prod.appspot.com/o/spaces%2FJOGWHv3yxVOZRUKbJJWY%2Fuploads%2Fn5JhGo15QBlIEwANIC8h%2FUnknown%20image?alt=media&amp;token=5930ea43-6cb1-4d7c-95e1-884537fbce90" alt="" width="563"></div>
13. Press **Win + R**, type `gpupdate /force`, and click **OK** to apply the policy on the local machine. Endpoints in the selected OU will receive the policy at their next startup or group policy refresh.

    <div align="left"><img src="https://1357541741-files.gitbook.io/~/files/v0/b/gitbook-x-prod.appspot.com/o/spaces%2FJOGWHv3yxVOZRUKbJJWY%2Fuploads%2FMEY5Bxq9N65NMHsvBElC%2FUnknown%20image?alt=media&amp;token=1831c384-c71f-47f0-97e3-9c0c01f36695" alt="" width="375"></div>

</details>

<details>

<summary>Microsoft Intune Deployment</summary>

Microsoft Intune enables centralised, automated deployment of the Agent to enrolled Windows devices.

1. Sign in to the [**Microsoft Intune Admin Center**](https://intune.microsoft.com/) using an administrator account.
2. From the left navigation menu, navigate to **Apps** > **All apps**.

   <div align="left"><img src="https://1357541741-files.gitbook.io/~/files/v0/b/gitbook-x-prod.appspot.com/o/spaces%2FJOGWHv3yxVOZRUKbJJWY%2Fuploads%2F81IV3qcKMOtiCc9DPjGO%2FUnknown%20image?alt=media&amp;token=02f3c905-17aa-43e7-a8aa-d5c26394035c" alt="" width="563"></div>
3. Select **Windows Apps** and click **+ Create** to create a new application.

   <div align="left"><img src="https://1357541741-files.gitbook.io/~/files/v0/b/gitbook-x-prod.appspot.com/o/spaces%2FJOGWHv3yxVOZRUKbJJWY%2Fuploads%2FTgtcl2aluh4Mv4vzaWq5%2FUnknown%20image?alt=media&amp;token=cf360a03-342b-4bc9-b2a2-17d3a98b0ed6" alt="" width="563"></div>
4. Under **Select app type**, choose **Line-of-business app**, and click **Select**.

   <div align="left"><img src="https://1357541741-files.gitbook.io/~/files/v0/b/gitbook-x-prod.appspot.com/o/spaces%2FJOGWHv3yxVOZRUKbJJWY%2Fuploads%2FvCi6gbA76HbV6brs9Y4N%2FUnknown%20image?alt=media&amp;token=b7708596-4991-47aa-817f-fcb84ace1392" alt="" width="375"></div>
5. In the **App information** section, click **Select app package file**, then browse and upload the GuardWare INSIGHT Agent installer file. Review the app details and click **OK**.

   <div align="left"><img src="https://1357541741-files.gitbook.io/~/files/v0/b/gitbook-x-prod.appspot.com/o/spaces%2FJOGWHv3yxVOZRUKbJJWY%2Fuploads%2F7WzmgxtEhA0YZHKbqAB9%2FUnknown%20image?alt=media&amp;token=d134fb5d-2d3a-45ee-b3a1-da28078a683c" alt="" width="375"></div>
6. Enter the following information in the **App information** section, then click **Next**.
   1. **Name:** Enter a display name of the application that appears in Intune and on endpoint devices during installation.
   2. **Description:** Enter a description for the application.
   3. **Publisher:** Enter the publisher’s name.

      <div align="left"><figure><img src="https://1357541741-files.gitbook.io/~/files/v0/b/gitbook-x-prod.appspot.com/o/spaces%2FJOGWHv3yxVOZRUKbJJWY%2Fuploads%2FjEFfEOML4jy2Z6sEbwbW%2FUnknown%20image?alt=media&amp;token=942ba326-5811-4a70-b44a-574bb8de1c06" alt="" width="563"><figcaption></figcaption></figure></div>
7. In the **Assignments** tab, click **Add group** under **Required** and select the Azure AD device or user groups that should receive the Agent.

   <div align="left"><figure><img src="https://1357541741-files.gitbook.io/~/files/v0/b/gitbook-x-prod.appspot.com/o/spaces%2FJOGWHv3yxVOZRUKbJJWY%2Fuploads%2FPxsE1oVTbQgFLpX7KJk1%2FUnknown%20image?alt=media&amp;token=fda06ff2-e0d8-4058-8f17-ee246e932ed4" alt="" width="563"><figcaption></figcaption></figure></div>
8. Click **Next**, review the configuration summary, and click **Create** to publish the deployment.

   <div align="left"><img src="https://1357541741-files.gitbook.io/~/files/v0/b/gitbook-x-prod.appspot.com/o/spaces%2FJOGWHv3yxVOZRUKbJJWY%2Fuploads%2FrJwKXwjccDDrgjSXB04W%2FUnknown%20image?alt=media&amp;token=c544bf9e-e708-4afb-823d-469533b91989" alt="" width="563"></div>

The Agent will install automatically on all assigned devices the next time they check in with Intune. Monitor installation progress under **Apps > Monitor > Installation status** in the Intune Admin Center.

</details>

<details>

<summary>Third-Party Deployment</summary>

The Agent can be deployed using third-party RMM tools such as PDQ Deploy, Datto RMM, ConnectWise Automate, or similar solutions. These tools support silent MSI installation using the following parameters:

```
msiexec /i "InsightAgent.msi" /quiet /norestart
```

{% hint style="warning" %}
Replace `InsightAgent.msi` with the filename of the downloaded installer.
{% endhint %}

Consult your RMM platform's documentation for specific deployment procedures. Most platforms support:

* Scheduled or immediate deployment.
* Target computer or group selection.
* Pre-installation scripts (for uninstallation of Agent v4 if installed).
* Post-installation verification scripts.
* Installation status reporting.

The client service starts automatically after installation. Verify deployment success by checking client connectivity in the INSIGHT Management Console.

</details>


# Update INSIGHT Agent

You can upload a new version of the INSIGHT Agent manually and deploy the new version to endpoints.

Only a valid INSIGHT Agent installation package in **.msi** format is supported. Ensure that the uploaded package is the correct version before deployment.

To upload the INSIGHT Agent:

1. Navigate to **Resources > Agent Update**.
2. Click the **INSIGHT Agent** tab.\
   ![](https://1357541741-files.gitbook.io/~/files/v0/b/gitbook-x-prod.appspot.com/o/spaces%2FJOGWHv3yxVOZRUKbJJWY%2Fuploads%2FChaTUpiPb50oh14qO4DC%2FUpdate%20INISGHT%20Agent.png?alt=media\&token=ea31b31c-5d00-4106-95ec-66a114292dee)
3. In the Upload area, drag and drop the MSI file or browse your computer for the file and click **Upload MSI**.&#x20;

{% hint style="info" %}
The maximum file size to upload is 500 MB.
{% endhint %}

Once uploaded, you can then deploy the new version to endpoints from **DEVICES > INSIGHT > Maintenance Mode > Update**. See [Devices](/documentation/insight/users-and-devices/insight-devices) for more details. <br>

<figure><img src="https://1357541741-files.gitbook.io/~/files/v0/b/gitbook-x-prod.appspot.com/o/spaces%2FJOGWHv3yxVOZRUKbJJWY%2Fuploads%2FEbuoGI1EeIpRhnwboOcc%2FUpdate%20Agent%20button%20-%20Devices.png?alt=media&amp;token=196f8e07-bd95-4986-9be4-3133abd5fac4" alt=""><figcaption></figcaption></figure>


# Whitelist PROTECT

The GuardWare PROTECT Agent installer deploys several components, including file system drivers, background services, and local daemons. These may be incorrectly flagged or blocked by AV, EDR, or XDR solutions. To avoid this, add the following PROTECT services to your security software’s whitelist or trusted applications list.

Whitelist the entire installation directory and the following components individually:

```
C:\Program Files\Guardware\PROTECT 
C:\ProgramData\Guardware
```

#### Executable Applications (.exe)

<table><thead><tr><th width="69" align="center">SN</th><th width="262">File Name</th><th>File Path</th></tr></thead><tbody><tr><td align="center">1</td><td>AZLogin.exe</td><td>C:\Program Files\GuardWare\PROTECT\AZLogin.exe</td></tr><tr><td align="center">2</td><td>Encryptor.exe</td><td>C:\Program Files\GuardWare\PROTECT\Encryptor.exe</td></tr><tr><td align="center">3</td><td>Fe2Policy.exe</td><td>C:\Program Files\GuardWare\PROTECT\Fe2Policy.exe</td></tr><tr><td align="center">4</td><td>GWDirectoryMonitor.exe</td><td>C:\Program Files\GuardWare\PROTECT\GWDirectoryMonitor.exe</td></tr><tr><td align="center">5</td><td>GWDirectoryMonitorService.exe</td><td>C:\Program Files\GuardWare\PROTECT\GWDirectoryMonitorService.exe</td></tr><tr><td align="center">6</td><td>GWProtectEncrypt.exe</td><td>C:\Program Files\GuardWare\PROTECT\GWProtectEncrypt.exe</td></tr><tr><td align="center">7</td><td>GWProtectPolicy.exe</td><td>C:\Program Files\GuardWare\PROTECT\GWProtectPolicy.exe</td></tr><tr><td align="center">8</td><td>GWZip.exe</td><td>C:\Program Files\GuardWare\PROTECT\GWZip.exe</td></tr><tr><td align="center">9</td><td>MailClientLauncher.exe</td><td>C:\Program Files\GuardWare\PROTECT\MailClientLauncher.exe</td></tr><tr><td align="center">10</td><td>ReadHeaderSa.exe</td><td>C:\Program Files\GuardWare\PROTECT\ReadHeaderSa.exe</td></tr><tr><td align="center">11</td><td>SampCheckEncryption.exe</td><td>C:\Program Files\GuardWare\PROTECT\SampCheckEncryption.exe</td></tr><tr><td align="center">12</td><td>SampCrypt.exe</td><td>C:\Program Files\GuardWare\PROTECT\SampCrypt.exe</td></tr><tr><td align="center">13</td><td>SampDir.exe</td><td>C:\Program Files\GuardWare\PROTECT\SampDir.exe</td></tr><tr><td align="center">14</td><td>SampUpdateHeader.exe</td><td>C:\Program Files\GuardWare\PROTECT\SampUpdateHeader.exe</td></tr><tr><td align="center">15</td><td>ScanDecryptService.exe</td><td>C:\Program Files\GuardWare\PROTECT\ScanDecryptService.exe</td></tr><tr><td align="center">16</td><td>Scanner.exe</td><td>C:\Program Files\GuardWare\PROTECT\Scanner.exe</td></tr><tr><td align="center">17</td><td>Toast.exe</td><td>C:\Program Files\GuardWare\PROTECT\Toast.exe</td></tr><tr><td align="center">18</td><td>WebView2DialogHost.exe</td><td>C:\Program Files\GuardWare\PROTECT\WebView2DialogHost.exe</td></tr><tr><td align="center">19</td><td>mip.exe</td><td>C:\Program Files\GuardWare\PROTECT\Mip\mip.exe</td></tr><tr><td align="center">20</td><td>pdfattach.exe</td><td>C:\Program Files\GuardWare\PROTECT\poppler-24.08.0\Library\bin\pdfattach.exe</td></tr><tr><td align="center">21</td><td>pdfdetach.exe</td><td>C:\Program Files\GuardWare\PROTECT\poppler-24.08.0\Library\bin\pdfdetach.exe</td></tr><tr><td align="center">22</td><td>pdffonts.exe</td><td>C:\Program Files\GuardWare\PROTECT\poppler-24.08.0\Library\bin\pdffonts.exe</td></tr><tr><td align="center">23</td><td>pdfimages.exe</td><td>C:\Program Files\GuardWare\PROTECT\poppler-24.08.0\Library\bin\pdfimages.exe</td></tr><tr><td align="center">24</td><td>pdfinfo.exe</td><td>C:\Program Files\GuardWare\PROTECT\poppler-24.08.0\Library\bin\pdfinfo.exe</td></tr><tr><td align="center">25</td><td>pdfseparate.exe</td><td>C:\Program Files\GuardWare\PROTECT\poppler-24.08.0\Library\bin\pdfseparate.exe</td></tr><tr><td align="center">26</td><td>pdftocairo.exe</td><td>C:\Program Files\GuardWare\PROTECT\poppler-24.08.0\Library\bin\pdftocairo.exe</td></tr><tr><td align="center">27</td><td>pdftohtml.exe</td><td>C:\Program Files\GuardWare\PROTECT\poppler-24.08.0\Library\bin\pdftohtml.exe</td></tr><tr><td align="center">28</td><td>pdftoppm.exe</td><td>C:\Program Files\GuardWare\PROTECT\poppler-24.08.0\Library\bin\pdftoppm.exe</td></tr><tr><td align="center">29</td><td>pdftops.exe</td><td>C:\Program Files\GuardWare\PROTECT\poppler-24.08.0\Library\bin\pdftops.exe</td></tr><tr><td align="center">30</td><td>pdftotext.exe</td><td>C:\Program Files\GuardWare\PROTECT\poppler-24.08.0\Library\bin\pdftotext.exe</td></tr><tr><td align="center">31</td><td>pdfunite.exe</td><td>C:\Program Files\GuardWare\PROTECT\poppler-24.08.0\Library\bin\pdfunite.exe</td></tr><tr><td align="center">32</td><td>zstd.exe</td><td>C:\Program Files\GuardWare\PROTECT\poppler-24.08.0\Library\bin\zstd.exe</td></tr><tr><td align="center">33</td><td>GWIconOverlayFix.exe</td><td>C:\Program Files\GuardWare\PROTECT\Server\GWIconOverlayFix.exe</td></tr><tr><td align="center">34</td><td>GWProtectClient.exe</td><td>C:\Program Files\GuardWare\PROTECT\Server\GWProtectClient.exe</td></tr><tr><td align="center">35</td><td>GWProtectDesktop.exe</td><td>C:\Program Files\GuardWare\PROTECT\Server\GWProtectDesktop.exe</td></tr><tr><td align="center">36</td><td>GWProtectExplorerInjector.exe</td><td>C:\Program Files\GuardWare\PROTECT\Detours\GWProtectExplorerInjector.exe</td></tr><tr><td align="center">37</td><td>GWProtectHooksService.exe</td><td>C:\Program Files\GuardWare\PROTECT\Detours\GWProtectHooksService.exe</td></tr><tr><td align="center">38</td><td>GWProtectIFEO.exe</td><td>C:\Program Files\GuardWare\PROTECT\Detours\GWProtectIFEO.exe</td></tr></tbody></table>

### Network Access Requirement (Azure Key Vault)

In addition to file-level whitelisting, configure a firewall exception to allow the PROTECT client to access Azure Key Vault without modifying the SSL certificate.

#### Firewall Rule Configuration

| Parameter        | Value                           |
| ---------------- | ------------------------------- |
| Application Name | GWProtectDesktop.exe            |
| Destination URL  | \<KeyVaultName>.vault.azure.net |
| Port             | 443 (HTTPS)                     |

{% hint style="info" %}
`<KeyVaultName>` refers to the name of the Azure Key Vault created during the GuardWare PROTECT Server setup process.
{% endhint %}

**Example**: If the Key Vault is named `guardware-protect`, the URL will be:

`guardware-protect.vault.azure.net`.


# Download PROTECT Agent

The GuardWare PROTECT Agent is installed on endpoint devices, such as desktops, laptops, and servers, within your organisation. It protects sensitive files by applying encryption and access controls, ensuring that only authorised users can access protected data even when files are shared, copied, or moved outside the organisation.

You can download the PROTECT Agent directly from the Management Console. The downloaded agent includes the MSI configuration defined for your organisation, so no additional setup is required during installation.

## Prerequisite

To download the agent, you must first set up the Agent Installation Settings. These settings allow administrators to configure installation parameters for the GuardWare PROTECT Agent MSI installer.&#x20;

The download link only appears after the configuration is complete.&#x20;

### Set up Agent Installation

1. Log in to the Management Console.
2. Navigate to **RESOURCES** > **Agent Download**, click **PROTECT Agent**, and enter the following details.
3. **Organisation ID:** Enter the organisation identifier under which agents are registered.
4. **Server Name:** Enter the hostname or domain of the server that agents connect to.
5. **Server Port**: Enter the port used for communication between the agent and the server. Ensure the port is allowed in the firewall when required. The standard HTTPS port is 443.
6. **AZ Domain External:** Enter the organisation's Azure external domain used by PROTECT agents to connect to Azure services when devices are outside the corporate network. This domain enables secure communication and authentication over the Internet.&#x20;
7. **AZ Domain Internal:** Enter the organisation's Azure internal domain used by PROTECT agents to connect to Azure services when devices are within the corporate network. This domain enables secure communication and authentication through internal network routes.
8. **Location:** Specify the location or site of the endpoint.
9. Click **Submit**.

## Download the Agent

Once the installation settings are complete, the **Download Installer** link becomes available. Click it to download the agent with the configured settings.

<figure><img src="https://1357541741-files.gitbook.io/~/files/v0/b/gitbook-x-prod.appspot.com/o/spaces%2FJOGWHv3yxVOZRUKbJJWY%2Fuploads%2FeJQNXskfuBF2z9AhJYB5%2FINSIGHT%20MSI%20Ready.png?alt=media&amp;token=350594a7-0893-40bd-a0ff-132c1a594923" alt=""><figcaption></figcaption></figure>

{% hint style="info" %}
Update the settings whenever required and download a new agent to apply the changes.
{% endhint %}

For deployment instructions, see [Install PROTECT Agent](/getting-started/install-protect-agent/install-protect-agent).


# System Requirements for PROTECT

## **System Requirements**

Before proceeding, make sure the following requirements are met to avoid installation errors and ensure GuardWare PROTECT functions properly on your device.

<table><thead><tr><th width="200">Specifications</th><th>Minimum Requirements</th></tr></thead><tbody><tr><td>Operating System</td><td>Windows 10 or later with all the latest updates installed</td></tr><tr><td>Processor</td><td>Intel i5, 4 cores</td></tr><tr><td>RAM</td><td>8 GB</td></tr><tr><td>Free Disk Space</td><td>5 GB</td></tr><tr><td>Firewall</td><td>Open port: 443 (HTTPS)</td></tr><tr><td>Tools</td><td><ol><li><a href="#install-microsoft-azure-cli">Microsoft Azure CLI 2.88.0 or later</a> - <mark style="color:$warning;">Required to authenticate with Microsoft Azure</mark></li><li><a href="#id-2.1.-install-microsoft-visual-c-redistributable">Microsoft Visual C++ Redistributable (x64) 2019 or later</a> - <mark style="color:$warning;">Provides the runtime components required for the PROTECT Agent to run.</mark></li><li><a href="#check-tls-settings-via-internet-properties-in-windows">TLS 1.2 or later enabled</a> - <mark style="color:$warning;">Ensures secure communication between the PROTECT Agent and cloud services.</mark></li><li><a href="https://developer.microsoft.com/en-us/microsoft-edge/webview2?form=MA13LH">WebView2 latest version</a> (Only for Windows 10) (Install EverGreen Standalone Installer) - <mark style="color:$warning;">Required to display the sign-in window during authentication.</mark></li></ol></td></tr></tbody></table>

{% hint style="warning" %}
Before deploying the agent manually or through Intune, install the **Microsoft Azure CLI** and **Microsoft Visual C++ Redistributable** on each target device either manually or via Intune.&#x20;
{% endhint %}

### Install Microsoft Azure CLI

1. [Download](https://learn.microsoft.com/en-us/cli/azure/install-azure-cli-windows?view=azure-cli-latest\&pivots=msi#install-or-update) the **Windows installer (MSI)** for Azure CLI.
2. Double-click the downloaded `.msi` installer to begin the installation.
3. Read and agree to the license terms and conditions, and click **Install**.\
   \
   ![](https://1357541741-files.gitbook.io/~/files/v0/b/gitbook-x-prod.appspot.com/o/spaces%2FJOGWHv3yxVOZRUKbJJWY%2Fuploads%2F4KLHmqkEvxCHaG00ivjy%2Fimage.png?alt=media\&token=658f4421-ffee-49a8-b1e5-951171ad4dc5)
4. Once the installation is complete, open **Command Prompt**, **PowerShell**, or **Windows Terminal**.
5. Run the following command to verify the installation:

```
az --version
```

7. If Azure CLI is installed successfully, the command displays the installed Azure CLI version and related component information.

### Install Microsoft Visual C++ Redistributable <a href="#id-2.1.-install-microsoft-visual-c-redistributable" id="id-2.1.-install-microsoft-visual-c-redistributable"></a>

1. [Download](https://learn.microsoft.com/en-us/cpp/windows/latest-supported-vc-redist?view=msvc-170#latest-supported-redistributable-version) the installer file for Microsoft Visual C++ Redistributable 2019 or later.
2. Double-click the Microsoft Visual C++ Redistributable installer file to begin the installation.
3. Read and agree to the license terms and conditions, and click **Install**.\
   ![](https://1357541741-files.gitbook.io/~/files/v0/b/gitbook-x-prod.appspot.com/o/spaces%2FJOGWHv3yxVOZRUKbJJWY%2Fuploads%2FheCugLpYtfmQ3MzfIclu%2Fimage.png?alt=media\&token=b8a5c4c6-0bc5-4573-847d-c4f1312882f7)

### Check TLS Settings via Internet Properties in Windows

Follow these steps to verify that **TLS 1.2 or later** is enabled on your system:

1. Press **Windows + R** to open the Run dialog box.
2. Type `inetcpl.cpl` and press **Enter**.\
   The **Internet Properties** window opens.
3. Go to the **Advanced** tab and scroll down to the **Security** section.\
   ![](https://1357541741-files.gitbook.io/~/files/v0/b/gitbook-x-prod.appspot.com/o/spaces%2FJOGWHv3yxVOZRUKbJJWY%2Fuploads%2FkyJQZCekgK42H9ivtTsA%2FTLS%20enabled.png?alt=media\&token=70daec28-ccee-44fd-a54c-e21c0a681bee)
4. Locate the following options and select them if they are not already enabled.
   1. **Use TLS 1.2**
   2. **Use TLS 1.3** (if available)
5. Click **Apply**, then click **OK**.


# Install PROTECT Agent

The GuardWare PROTECT Agent is installed on endpoint devices and applies file protection policies directly on the device. It enables users to protect sensitive files, apply classifications, and enforce access restrictions while working in their normal applications.

With the Agent deployed, organisations can protect data at the endpoint, control how files are shared, and enforce policy-based access to sensitive content.

{% hint style="warning" %}
Before installing the Agent, [**whitelist PROTECT**](/getting-started/install-protect-agent/whitelist-protect) and confirm the device meets the [**system requirements**](/getting-started/install-protect-agent/system-requirements-for-protect).
{% endhint %}

## Azure AD Users

For users registered with Azure AD, proceed directly to the [Install GuardWare PROTECT Agent](#install-guardware-protect-agent) section.

## Local AD and External Users (On-Premises and Outside the Organisation)

If your users are registered with on-premises Active Directory (local AD), complete the [Pre-installation steps](#pre-installation-setup) below and then proceed to [install the PROTECT Agent](#install-guardware-protect-agent).

This also applies to users who are outside your organisation, such as partners, contractors, or clients, who are not part of your organisation’s Azure AD or Local AD.

### Pre-Installation Setup

Local AD users and external users need an invitation from GuardWare Australia to use GuardWare PROTECT. Once you receive an invitation, follow these steps:

1. Accept the invitation sent to your email.
2. After accepting, you’ll be prompted to **send a code to your email**. Click **Send code**.

<div align="left"><img src="https://1357541741-files.gitbook.io/~/files/v0/b/gitbook-x-prod.appspot.com/o/spaces%2FJOGWHv3yxVOZRUKbJJWY%2Fuploads%2FtwHhNbWmsZO6XIUfwBJR%2FUnknown%20image?alt=media&amp;token=9d689103-6d23-4b89-86b1-73270286edb0" alt="" width="375"></div>

3. Enter the code sent to your email and **sign in**.
4. GuardWare requests certain permissions. Read the requested permission and accept. You’ll then be directed to the Welcome page, where you can see details on how to get started.

<div align="left"><img src="https://1357541741-files.gitbook.io/~/files/v0/b/gitbook-x-prod.appspot.com/o/spaces%2FJOGWHv3yxVOZRUKbJJWY%2Fuploads%2FzzNeiwfAttawsCb539nb%2FUnknown%20image?alt=media&amp;token=a33b9f3b-acd2-4595-9d46-d412c61b51ac" alt="" width="375"></div>

## Install GuardWare PROTECT Agent

1. Double-click the provided **PROTECT Agent installer** file to begin the installation.
2. In the **Setup Wizard**, click **Next** to continue.

<div align="left"><figure><img src="https://1357541741-files.gitbook.io/~/files/v0/b/gitbook-x-prod.appspot.com/o/spaces%2FJOGWHv3yxVOZRUKbJJWY%2Fuploads%2FXgvLPKa5Ejf5UvWdda0V%2FUnknown%20image?alt=media&amp;token=cbd151a3-b80e-41cb-b01b-256aaa28126c" alt="" width="375"><figcaption></figcaption></figure></div>

3. Read and accept the **End User Licence Agreement (EULA)** and click **Next**.

<div align="left"><img src="https://1357541741-files.gitbook.io/~/files/v0/b/gitbook-x-prod.appspot.com/o/spaces%2FJOGWHv3yxVOZRUKbJJWY%2Fuploads%2Fdoc3qkQ5HRCIdiap5VpJ%2Fimage%20(44).png?alt=media&amp;token=be9bb7c7-4b95-4703-b0de-d33c1bb95010" alt="" width="375"></div>

4. Choose the folder where you want to install GuardWare PROTECT and click **Next**. By default, PROTECT will be installed in: `C:\Program Files\`.
5. Click **Install**. The installation may take a few minutes to complete.

<div align="left"><figure><img src="https://1357541741-files.gitbook.io/~/files/v0/b/gitbook-x-prod.appspot.com/o/spaces%2FJOGWHv3yxVOZRUKbJJWY%2Fuploads%2FKuop3Hh6TncVzueMPiVO%2FUnknown%20image?alt=media&amp;token=f32eb28f-7da1-4a31-bfb3-00c57b7a6832" alt="" width="375"><figcaption></figcaption></figure></div>

6. If you do not have Microsoft Azure CLI installed, a Setup Wizard will prompt you to install it. Read and agree to the licence agreement terms and click **Install**.

<div align="left"><figure><img src="https://1357541741-files.gitbook.io/~/files/v0/b/gitbook-x-prod.appspot.com/o/spaces%2FJOGWHv3yxVOZRUKbJJWY%2Fuploads%2FpvlJRJ4YgyuCXLnzoLHj%2Fimage%20(45).png?alt=media&amp;token=90a0c845-a28d-4dc6-a190-d8ccc6d581e1" alt="" width="375"><figcaption></figcaption></figure></div>

7. If you do not have Microsoft Visual C++ Redistributable installed, a Setup Wizard will prompt you to install it. Read and agree to the licence agreement terms and click **Install**.\
   ![](https://1357541741-files.gitbook.io/~/files/v0/b/gitbook-x-prod.appspot.com/o/spaces%2FJOGWHv3yxVOZRUKbJJWY%2Fuploads%2FMmDnPwW1CAOmCzwJ2CEp%2FMicrosoft%20redistributable%20install.jpg?alt=media\&token=b591ea16-07c1-4a11-abe6-a4786acbd88d)
8. Once the installation is complete, click **Finish** to exit the Setup Wizard and continue with the PROTECT Agent installation.
9. During the agent installation, a User Account Control (UAC) dialog box may appear. This is a standard Windows security feature that verifies whether you want to allow the installer to make changes to your computer. When this dialog appears:
   1. Verify that the publisher is GuardWare Australia Pty Ltd.
   2. Click **Yes** to allow the installation to proceed. Clicking **No** cancels the installation.
10. Once the PROTECT Agent installation is complete, click **Finish** to exit the wizard.
11. You’ll be prompted to restart your device. Click **Yes**. After restarting your device, follow the steps in [Post-Installation Setup](#post-installation-setup).<br>

    <figure><img src="https://1357541741-files.gitbook.io/~/files/v0/b/gitbook-x-prod.appspot.com/o/spaces%2FJOGWHv3yxVOZRUKbJJWY%2Fuploads%2FxBpTma0o8kW6BT0HYzyK%2FPROTECT%20-%20Install%20restart.png?alt=media&amp;token=f09dc703-1f9e-43ed-b4ad-773d5a31d18b" alt=""><figcaption></figcaption></figure>

Restarting is mandatory for GuardWare PROTECT to install successfully.

## Post-Installation Setup

After restarting your device, a **Welcome Wizard** appears automatically. If you do not see it right away, please wait a few minutes.

1. In the Welcome wizard, click **Login with Azure**.

<div align="left"><figure><img src="https://1357541741-files.gitbook.io/~/files/v0/b/gitbook-x-prod.appspot.com/o/spaces%2FJOGWHv3yxVOZRUKbJJWY%2Fuploads%2F3zEXM5iGtFSMozeHtVbg%2FUnknown%20image?alt=media&amp;token=c5fef733-e57f-45e8-9690-886721937b0a" alt="" width="375"><figcaption></figcaption></figure></div>

2. For Azure AD users:
   1. Select your work email address and click **Continue**.

      <div align="left"><figure><img src="https://1357541741-files.gitbook.io/~/files/v0/b/gitbook-x-prod.appspot.com/o/spaces%2FJOGWHv3yxVOZRUKbJJWY%2Fuploads%2FA43XGjefExfTXu0CFBR7%2FUnknown%20image?alt=media&amp;token=5577c156-7ff7-4ace-9867-9a87031da482" alt="" width="375"><figcaption></figcaption></figure></div>
   2. Select your **Tenant ID** and **Subscription** and click **Submit**.

      1. **Tenant ID:** The unique identifier of your Azure AD.
      2. **Subscription:** Defines the set of resources and the billing account.

         <div align="left"><figure><img src="https://1357541741-files.gitbook.io/~/files/v0/b/gitbook-x-prod.appspot.com/o/spaces%2FJOGWHv3yxVOZRUKbJJWY%2Fuploads%2FFA3452BkqZV7qASXlHG3%2FUnknown%20image?alt=media&amp;token=cf314ae8-5e92-41b9-8114-46a672d54d3b" alt="" width="375"><figcaption></figcaption></figure></div>

      Select the Subscription that contains your Key Vault. If multiple appear, select the one where the Key Vault and Service Principal for GuardWare PROTECT are set up. If you’re not certain which subscription applies, you can verify it in the [Azure Portal](https://portal.azure.com/) under **Subscription** or contact your administrator.

      <figure><img src="https://1357541741-files.gitbook.io/~/files/v0/b/gitbook-x-prod.appspot.com/o/spaces%2FJOGWHv3yxVOZRUKbJJWY%2Fuploads%2FfYsWEZpNihcEF7sOoymZ%2FUnknown%20image?alt=media&amp;token=e5534935-0721-4ac6-8e1d-4d113a176bc8" alt=""><figcaption></figcaption></figure>
3. Click **Exit** when the setup is complete.
4. For external users:
   1. Select **Work or school account**.
   2. Enter the email address where you received the invitation, and click **Next**.
   3. Check your email for a verification code, then enter the code and click **Sign in**.
   4. When prompted to sign in automatically across desktop apps and browsers, select\
      **No, this app only** (for better security). This ensures your Azure login is used only within GuardWare PROTECT, preventing other apps or browsers on the same device from automatically accessing your credentials. You can always sign in separately to other apps when needed.
   5. Click **Exit** when the setup is complete.
5. During the process, if a Windows Security prompt appears stating that **Windows Firewall has blocked some features of** **GWProtectDesktop**, click **Allow**.\
   \
   If the **prompt does not appear** or **you did not allow** it in the above step, follow the steps below to allow **GWProtectDesktop** to communicate through Windows Defender Firewall. Allowing **GWProtectDesktop** through the firewall ensures the PROTECT Agent can communicate with required services and enforce file protection policies correctly.
   1. Open **Control Panel** > **System and Security** > **Windows Defender Firewall**.
   2. Click **Allow an app or feature through Windows Defender Firewall**.
   3. Select **Change settings**.
   4. Locate **GWProtectDesktop** in the list and enable the **Private** and **Public** networks.
   5. Click **OK** to save the changes.

      <div align="left"><figure><img src="https://1357541741-files.gitbook.io/~/files/v0/b/gitbook-x-prod.appspot.com/o/spaces%2FJOGWHv3yxVOZRUKbJJWY%2Fuploads%2FTBCydfK9aRukkrJXR4qk%2FUnknown%20image?alt=media&amp;token=146e8a9e-0d51-484b-aa79-3b6554cda56d" alt="" width="563"><figcaption></figcaption></figure></div>

You can now use GuardWare PROTECT to add protection to sensitive files, set classifications, restrict access to Security Groups, add expiry dates, restrict circulation, and so on.

## Uninstall GuardWare PROTECT Agent

{% hint style="danger" %} <mark style="color:$danger;">**Make sure to remove protection from your protected files before uninstalling PROTECT; otherwise, you won't be able to access them afterwards.**</mark>
{% endhint %}

To remove GuardWare PROTECT from your device:

1. Double-click the **PROTECT Agent installer**.
2. In the **Setup Wizard,** click **Next** to continue.

<div align="left"><img src="https://1357541741-files.gitbook.io/~/files/v0/b/gitbook-x-prod.appspot.com/o/spaces%2FJOGWHv3yxVOZRUKbJJWY%2Fuploads%2F0Dm1joQozTDWskgjMMhb%2FUnknown%20image?alt=media&amp;token=887f2e0a-7495-4f35-bbba-49632d02a10e" alt="" width="375"></div>

3. You’ll get options to modify, repair, or remove PROTECT. Choose **Remove**, then click **Remove** to uninstall GuardWare PROTECT.

<div align="left"><img src="https://1357541741-files.gitbook.io/~/files/v0/b/gitbook-x-prod.appspot.com/o/spaces%2FJOGWHv3yxVOZRUKbJJWY%2Fuploads%2F6onB5bXKv42dVI6r7Wzd%2FUnknown%20image?alt=media&amp;token=e9a7097b-7aef-48ea-a0a1-8f149061035d" alt="" width="375"></div>

<div align="left"><img src="https://1357541741-files.gitbook.io/~/files/v0/b/gitbook-x-prod.appspot.com/o/spaces%2FJOGWHv3yxVOZRUKbJJWY%2Fuploads%2F8LqbvE9v1Al8wuauSKCo%2FUnknown%20image?alt=media&amp;token=40badb1f-fa8e-4f35-bf28-f351198eca79" alt="" width="375"></div>

4. (Optional) To review or change installation settings, click **Back**. To exit without uninstalling, click **Cancel**.
5. During the uninstallation, you may see the following dialogs:
   1. **Installer Information**

      When the Installer Information appears, click **OK** to continue with the uninstallation.\
      ![](https://1357541741-files.gitbook.io/~/files/v0/b/gitbook-x-prod.appspot.com/o/spaces%2FJOGWHv3yxVOZRUKbJJWY%2Fuploads%2FQ4iJpW0Q7HkXF5g9l4ru%2Ftiff.png?alt=media\&token=41f0f37e-f962-4f05-a3bb-13b7bbd7f618)
   2. **User Account Control (UAC)**\
      This is a standard Windows security feature that verifies whether you want to allow the installer to make changes to your computer. When this dialog appears:
      1. Verify that the publisher is displayed as GuardWare Australia Pty Ltd.
      2. Click **Yes** to allow the uninstallation to proceed. If you select **No**, the uninstallation will be cancelled.
6. After uninstallation is complete, you will be prompted to restart your device. Click **Yes**.

{% hint style="info" %}
Restarting is mandatory for GuardWare PROTECT to uninstall fully.
{% endhint %}


# Getting Started with DISCOVER

## Overview

GuardWare DISCOVER is a cross-platform data discovery, investigation, and remediation system that locates, analyses, and manages sensitive data across endpoint devices, file servers, email systems, and cloud storage.

DISCOVER follows a simple operating flow:

* **Scan** finds sensitive data across selected targets.
* **Investigation** lets you flag files of interest and securely download and review them.
* **Remediation** lets you move, delete, copy, and classify the sensitive data detected across scanned systems and send emails regarding the results to end users or data owners.

See [Introduction to DISCOVER](/documentation/discover) for the platform overview.

DISCOVER has three core components:

* **Management Console:** The central web application. Stores configuration and results. Schedules scan jobs. Displays scan status, reports, investigations, and remediation options.
* **Scanning Server:** A Windows service where the scanning agent is installed. It performs scans on target devices and shows the scan results in the Management Console.
* **Targets:** The systems being scanned. Can include endpoints, SMB file shares, Exchange Online, and SharePoint Online.

#### Architecture: Local vs Remote scanning

1. **Local scan**: A local scan is performed when the agent is installed on a target device, and the device scans itself for sensitive data.
2. **Remote scan**: A remote scan is performed using a scanning server where the agent is installed. The scanning server connects to target devices that do not have the agent installed using protocols such as WinRM, SSH, or SMB (for file servers) and performs the scan on those devices remotely.

#### Classifications, data types, and data owners

DISCOVER uses a simple governance model:

* **Classifications** define sensitivity levels.
* **Data Types** define what DISCOVER detects.
* **Data Owners** define who is notified.

The relationship is direct:

* A data type belongs to a classification.
* One or more data owners can be assigned to a data type.
* A file inherits the highest sensitivity classification from matched data types.

See [DATA GOVERNANCE](/documentation/management-console/data-governance/data-classification) for the full governance model.

#### What this guide covers

* Console access
* Scanning Server configuration
* Connecting Microsoft 365
* Target discovery, scanning, and review
* Investigation and remediation

This guide introduces the essential steps for quickly initiating scan jobs and getting visibility into your sensitive data landscape.

{% hint style="warning" %}
Before getting started, make sure you have installed the GuardWare Server and can access the GuardWare Management Console.
{% endhint %}

{% stepper %}
{% step %}

### Log in to the Console

1. Open the GuardWare Management Console URL.
2. Sign in with your admin or organisation account.
3. Complete 2FA, EULA acceptance, and password setup if prompted.

If Microsoft sign-in is enabled, you can also use your Microsoft account.
{% endstep %}

{% step %}

### Whitelist DISCOVER

Add the following directories and executables to your security solution's exclusion or trusted applications list.

1. `C:\Program Files\Guardware\GuardWare DISCOVER`.
2. `C:\Program Files\Guardware\GuardWare DISCOVER\MIPLabelHandler`.
3. `GuardWareDiscoverAgent.exe`
4. `GWActiveMon.exe`
   {% endstep %}

{% step %}

### Download the Agent <a href="#download-the-agent" id="download-the-agent"></a>

1. Navigate to **RESOURCES** > **Agent Download > DISCOVER Agent**.
2. Set the **Location** and click **Update**.
3. Click **Submit**. The Download link only appears after the configuration is complete.

Once the installation settings are complete, the **Download Installer** link becomes available. Click it to download the agent with the configured settings.
{% endstep %}

{% step %}

### Configure the Scanning Server

1. For **local scanning**, install the downloaded agent on a target device.
2. For **remote scanning**, install the downloaded agent on a Windows host. The Windows host becomes the Scanning Server and scans multiple remote systems across the network.
3. Complete the setup wizard.
4. Confirm the Scanning Server or target device appears as **Online** in the Console.

For remote scan, each target device must be configured to accept connections from the Scanning Server host using the appropriate protocol. GuardWare provides PowerShell scripts that enable the required services, set permissions, and configure firewall rules.

For Microsoft 365 targets, no script is required on target devices. The Scanning Server host needs outbound HTTPS access and valid Microsoft Entra ID credentials.

See [**Scanning Server Deployment Guide**](/getting-started/install-discover-agent/install-discover-agent) for remote access configuration.
{% endstep %}

{% step %}

### Connect Microsoft 365

Connect your Microsoft 365 environment to enable scanning of Exchange Online and SharePoint Online. Ensure you have the **Global Administrator** account's credentials ready.

1. Navigate to ***ORGANISATION > Integrations**.*
2. Click **Connect Microsoft 365**.
3. Sign in with a **Global Administrator** account.
4. Review the requested permissions.
5. Select **Consent on behalf of your organisation**.
6. Click **Accept**.
   {% endstep %}

{% step %}

### Define classifications and data types

Set up classifications and data types before you run scans. This makes results easier to review and act on.

1. Navigate to **DATA GOVERNANCE** > **Data Classification**.
2. Create classifications manually with **+Add Classification**, or click **Sync** to import published Microsoft Purview Information Protection sensitivity labels.
3. Run **Sync** again after labels are added or changed in Microsoft Purview.
4. Go to **DATA GOVERNANCE** > **Data Type**.
5. Click **+Data Type** and enter the data type name and description.
6. Choose the identifier type:
   * **Sensitive Words**
   * **Regular Expressions**
   * **Filename Expressions**
7. Assign a classification and data owner.
8. Click **Save**.

See [**DATA GOVERNANCE**](/documentation/management-console/data-governance/data-classification) for more details.
{% endstep %}

{% step %}

### Discover target devices and services

Before you can scan, DISCOVER must know what to scan. Targets are the systems and services DISCOVER scans to detect sensitive data. Properly defining targets ensures scans reach the correct data sources and provide comprehensive visibility across your environment.

Start with your highest-priority systems that are most likely to contain sensitive data and expand gradually based on your requirements.

**Devices**

Device targets include workstations, laptops, and file servers where sensitive data may reside.

1. Go to **DISCOVER** > **Target Discovery** > **Devices** and click **+New Target Discovery.**

   <div align="left"><img src="https://1357541741-files.gitbook.io/~/files/v0/b/gitbook-x-prod.appspot.com/o/spaces%2FJOGWHv3yxVOZRUKbJJWY%2Fuploads%2FFaJVO0rHKRt5AHm36AWb%2FUnknown%20image?alt=media&amp;token=e0a8b25b-e80d-45ed-9cc1-6b6f7aec354f" alt="" width="563"></div>
2. Enter a **Job Name** for the discovery job, and specify the **Target IP range** to define the network segment in which DISCOVER should search for devices.
3. Set the **Location** to filter the list of scanning servers by their assigned location.
4. Select the appropriate **Protocol** (WinRM, SSH, or FILE SERVER) to connect to the devices and provide **Authentication** credentials.
   * **SSH** for non-Windows devices.
   * **WinRM** for Windows devices.
   * **File Server (SMB)** for shared storage and file servers.
5. Set the **Connection Attempt Interval** to define how frequently DISCOVER will try to connect to a target.
6. Set **Give-up Trying After** to specify the maximum duration DISCOVER will continue attempting the connection before abandoning it.
7. Click **Save**.

**Services**

Cloud services extend DISCOVER's reach to data stored in external platforms, ensuring complete coverage of your digital assets regardless of location.

1. Go to **DISCOVER** > **Target Discovery** > **Services** and click **+New Target Discovery**.

<div align="left"><img src="https://1357541741-files.gitbook.io/~/files/v0/b/gitbook-x-prod.appspot.com/o/spaces%2FJOGWHv3yxVOZRUKbJJWY%2Fuploads%2FrNUXHWfuRAgJFk1mOtbb%2FUnknown%20image?alt=media&amp;token=b50593b2-4d9a-4019-bf36-2fffd9497115" alt="" width="563"></div>

2. Enter the **Discovery Job** name, then select the **Cloud Connector** for the service type (Microsoft Exchange or SharePoint).
3. Specify the **Organisation** (for SharePoint) and provide the **Client ID** and **Tenant ID** for authentication.
4. Set the **Location** to filter the list of scanning servers by their assigned location.
5. Select either **Client Exchange Secret** or **Certificate** as an authentication method.
6. Set the **Connection Attempt Interval** to define how frequently DISCOVER will try to connect to a target.
7. Set **Give-up Trying After** to specify the maximum duration DISCOVER will continue attempting the connection before abandoning it.
8. Click **Save**.

Discovered devices and services then appear in **Devices/Services Found** and can be selected in scans.

{% hint style="info" %}
After a target discovery job completes, you can use **Rediscover** from **DISCOVER** > **Target Discovery** to run that same job again. Rediscover uses the same settings and target discovery parameters as the original job. You cannot change them during the rerun. Use it when devices in the discovery range were temporarily unavailable or unreachable.
{% endhint %}

For more details, see [Target Discovery](/documentation/discover/scan/target-discovery).
{% endstep %}

{% step %}

### Create and run a scan

After target devices are found, create your first scan. During a scan, DISCOVER examines the selected devices and services by checking the specified directories (or all directories, if configured) and the specified file types for sensitive data.

It then searches within those files, identifying and reporting any sensitive data it detects. You can run a [**One-Time Scan**](/documentation/discover/scan/scans#one-time-scan) for testing or targeted scans, or an [**Ongoing Scan**](/documentation/discover/scan/scans#ongoing-scan) for routine monitoring.

{% tabs %}
{% tab title="Configure and Run a One-Time Scan" %}
A **One-Time Scan** checks new or changed files on the selected targets against your configured data types and classifications. Use it to validate a new rule, perform a targeted check, or test new scan configurations.

1. Navigate to **DISCOVER** > **Scans** and click **+New Scan.**

<div align="left"><img src="https://1357541741-files.gitbook.io/~/files/v0/b/gitbook-x-prod.appspot.com/o/spaces%2FJOGWHv3yxVOZRUKbJJWY%2Fuploads%2FLsXQB26mmaaY5oijfFBH%2FUnknown%20image?alt=media&amp;token=f217fbea-ec7b-4be4-984f-faac831e857e" alt="" width="563"></div>

2. Select **One-Time Scan** and click **Proceed.**

<div align="left"><img src="https://1357541741-files.gitbook.io/~/files/v0/b/gitbook-x-prod.appspot.com/o/spaces%2FJOGWHv3yxVOZRUKbJJWY%2Fuploads%2F1FrGbDqAoQyVosWQlkIc%2FUnknown%20image?alt=media&amp;token=135c504c-7b1d-4099-b960-a4f4bf00c267" alt="" width="563"></div>

3. Enter a **Scan Name** and give a **Description** (optional), then click **Next**.
4. Select the data types you want to search for and click **Next**.
5. Select the targets and services to scan, then click **Next**.
6. Configure the **File Handling Options**, specify the files and folders you want to include or exclude from the scan, and then click **Next**.
7. Review the scan configurations and click **Save Scan**. The scan will begin automatically.
   {% endtab %}

{% tab title="Configure and Run an Ongoing Scan" %}
An Ongoing Scan performs a full scan of selected targets and services on a recurring schedule. Use it for routine checks, to validate compliance with data-handling policies, and to maintain continuous visibility into sensitive information across your environment.

Each scan contributes to a historical record that DISCOVER uses to generate trends, enabling you to monitor changes over time, identify emerging risks, and track remedial actions. Ongoing Scans are resource-intensive, so schedule them during off-peak hours to minimise impact on business operations.

1. Go to **DISCOVER** > **Scans** and click **+New Scan**.
2. Select **Ongoing Scan** and click **Proceed**.

<div align="left"><img src="https://1357541741-files.gitbook.io/~/files/v0/b/gitbook-x-prod.appspot.com/o/spaces%2FJOGWHv3yxVOZRUKbJJWY%2Fuploads%2FDnDjSdF7tN3mjKp8APwv%2FUnknown%20image?alt=media&amp;token=fc1bc5a0-e29d-4e47-a722-d5c08b16ddca" alt="" width="563"></div>

3. Select data types you want to search for and click **Next**.
4. Select the Targets/Services to scan, then click **Next**.
5. Configure File Handling Options and filters, then click **Next**.
6. Schedule the scan time and click **Next**.

<div align="left"><img src="https://1357541741-files.gitbook.io/~/files/v0/b/gitbook-x-prod.appspot.com/o/spaces%2FJOGWHv3yxVOZRUKbJJWY%2Fuploads%2FtPQLOBMMnIw7T5mcAYPj%2FUnknown%20image?alt=media&amp;token=344d0049-5e60-4da2-a7ff-de3921990bf3" alt="" width="563"></div>

7. Review the scan configurations and click **Save Scan**. The scan will automatically initiate.
   {% endtab %}
   {% endtabs %}

During execution, track progress in **DISCOVER** > **Scans**.

When the scan completes, open **View Result** or go to **DISCOVER** > **Results**.
{% endstep %}

{% step %}

### Check results

From **DISCOVER > Results**, you can filter findings and move selected items into an investigation. After a scan completes, you can view details such as what sensitive data was found, which device or service it was found on, how many instances were detected, and any remediation actions that have been applied.

By default, you'll see results from all completed scans. Use the filter options at the top of the page to narrow results by scan job, date range, data type, classification, or target name.
{% endstep %}

{% step %}

### Analyse discovered data

Use the dashboard for trends and the results view for details.

1. Go to **DISCOVER** > **Dashboard** > **Dashboard** for high-level metrics.
2. Review widgets such as **Potential Sensitive Data**, **Potential Data by Target**, and remediation status.
3. Go to **DISCOVER** > **Dashboard** > **Summary Report** to review files and targets by data type for a specific scan.
4. Go to **DISCOVER** > **Results** to inspect individual findings and refine filters by scan, target, data type, and classification.

Use this review to confirm risk, prioritise targets, and decide what needs investigation or remediation first.

See [DISCOVER Dashboard](/documentation/discover/dashboard/discover-dashboard) for more details.
{% endstep %}

{% step %}

### Classify discovered information

DISCOVER classifies files based on the matched data types. The highest matched classification is applied to the result.

1. Confirm that the relevant data types already have classifications assigned.
2. Review findings in **DISCOVER** > **Results**.
3. If a file needs a different label, use **Remediate** > **Classify**.
4. If you need to update the default mapping, go to **DATA GOVERNANCE** > **Data Type** and assign the correct classification to the data type.

This keeps discovered information aligned with your handling policy.
{% endstep %}

{% step %}

### Create an investigation

Use the Investigation feature when you need to review discovered files more closely.

Before you investigate files, configure the secure location and investigation password first.

#### Set up a secure location and an investigation password

When DISCOVER identifies sensitive files during a scan, you may need to investigate or remediate them. A **secure location** is a designated storage area where these files are copied or moved, keeping them in a controlled environment separate from their original location.

An **Investigation password** is the password required to access the files downloaded using DISCOVER's Investigate function. Set an investigation password before conducting any investigations, and store it securely. If you lose it, you cannot open previously downloaded files.

Set them in **ORGANISATION** > **Set Up Secure Location**.

<figure><img src="https://1357541741-files.gitbook.io/~/files/v0/b/gitbook-x-prod.appspot.com/o/spaces%2FJOGWHv3yxVOZRUKbJJWY%2Fuploads%2FU51YfPLTF1bvLn7WYuRl%2FSet%20up%20secure%20location.png?alt=media&amp;token=ce6bf568-7ad2-4d6e-843a-f0bf8c183e3b" alt=""><figcaption></figcaption></figure>

See [**Secure Location**](/documentation/discover/investigate-and-remediate/set-up-secure-location) and [**Investigation Password**](/documentation/discover/investigate-and-remediate/set-investigation-password) for more details.

#### Create a new investigation

1. Navigate to **DISCOVER** > **Investigation**.
2. Click **+ New Investigation**.
3. Enter a name and a short purpose.
4. Click **Create**.

#### Move items into the investigation

1. Navigate to **DISCOVER** > **Results**.
2. Select one or more findings.
3. Click **Investigate**.
4. Select an existing investigation from the drop-down or create a new one by entering a new name.
5. Add an optional comment, and click **Investigate**. Investigation results are made available as password-protected ZIP downloads.
6. Click the download icon to download the file. The files inside the ZIP are password-protected. Use the password you set up while setting up the secure location.

See [**Investigation** ](/documentation/discover/investigate-and-remediate/investigation)for more details.
{% endstep %}

{% step %}

### Remediate sensitive information

Use **Remediate** to reduce risk after you confirm a finding. You can move, copy, delete, classify, or notify the right owner.

1. Go to **DISCOVER** > **Results** > **Remediate** or **DISCOVER** > **Investigation** > **Remediate**.
2. Select one or more files and click **Remediate**.
3. Choose a remediation action from the drop-down.

<table><thead><tr><th width="221.4444580078125">Action</th><th>Function</th></tr></thead><tbody><tr><td>Move</td><td>Relocates the file to a secure location.</td></tr><tr><td>Copy</td><td>Creates a copy of the file to a secure or alternate location.</td></tr><tr><td>Delete</td><td>Permanently removes the file.</td></tr><tr><td>Classify</td><td>Classify file according to selected classification.</td></tr><tr><td>Send Email to Data Owner</td><td>Notifies the assigned data owner with an email.</td></tr><tr><td>Send Email to Device Owner</td><td>Notifies the file owner or user who has the device in their possession.</td></tr></tbody></table>

4. Add a comment (optional) to provide context or notes for the task.
5. Click **Remediate** to execute the selected action.

Use **DISCOVER** > **Remediation** to track what action was taken, by whom, and when.

See [**Remediation** ](/documentation/discover/investigate-and-remediate/remediation)for more details.
{% endstep %}
{% endstepper %}

With these steps complete, DISCOVER is ready to scan your selected targets and help you identify, investigate, and remediate sensitive data across your organisation.


# Getting Started with INSIGHT

GuardWare INSIGHT is a data visibility and monitoring solution that helps your organisation understand how data is being accessed, shared, and used across both internal and external environments. It provides a unified view of user activity and file movement, allowing you to detect unusual behaviour, potential data leaks, and policy violations in real time.

**Before you begin, make sure you have:**

* Access to the GuardWare Management Console.
* Endpoints ready for INSIGHT agent deployment.
* A Microsoft 365 Global Administrator account if you plan to monitor Exchange Online or SharePoint Online.

{% stepper %}
{% step %}

### Log in to the Console

1. Open the GuardWare Management Console.
2. Sign in with your admin account.
3. Complete 2FA, accept the EULA, and change the password if prompted.
   {% endstep %}

{% step %}

### Set up Cloud Monitor

Cloud Monitor audits user activities within your organisation’s Microsoft 365 environment, including Exchange Online and SharePoint Online.

To set up Cloud Monitor:

1. Navigate to **ORGANISATION** > **Integrations**.
2. Click **Connect Microsoft 365**.
3. Sign in with a Global Administrator account.
4. Approve MFA if prompted.
5. Select **Consent on behalf of your organisation**.
6. Click **Accept**.

Then go to **INSIGHT** > **Cloud Monitoring** and:

* Enable **Exchange Monitoring** if needed.
* Assign users to the monitoring group.
* Enable **SharePoint Monitoring** if needed.
* Run **Sync** to pull the latest Microsoft 365 data.<br>

  <figure><img src="https://1357541741-files.gitbook.io/~/files/v0/b/gitbook-x-prod.appspot.com/o/spaces%2FJOGWHv3yxVOZRUKbJJWY%2Fuploads%2FGatqLMsubzXkjd2oshwv%2FCloud%20Monitoring%20Settings.png?alt=media&amp;token=baf64ce8-6652-4c3c-b900-898bebde37f8" alt=""><figcaption></figcaption></figure>

{% endstep %}

{% step %}

### Download the INSIGHT Agent

The GuardWare INSIGHT Agent is installed on endpoint devices to continuously monitor user activities and file interactions, including file transfers, email attachments, printing, access to non-corporate websites and applications, etc.

1. Navigate to **Resources** > **Agent Download**.
2. Go to **INSIGHT Agent**.
3. Configure the required fields and click **Submit**.<br>

   <figure><img src="https://1357541741-files.gitbook.io/~/files/v0/b/gitbook-x-prod.appspot.com/o/spaces%2FJOGWHv3yxVOZRUKbJJWY%2Fuploads%2FTBxi53pOktNi7YMl3XWp%2FDownload%20INSIGHT%20Agent.png?alt=media&amp;token=df1c98f0-aca8-4f3b-9b37-9972238f2075" alt=""><figcaption></figcaption></figure>

Once the installation settings are complete, the **Download Installer** link becomes available. Click it to download the agent with the configured settings.
{% endstep %}

{% step %}

### Whitelist INSIGHT

Whitelist INSIGHT in the endpoints' AV, EDR, or XDR platforms.

1. Add `C:\Program Files (x86)\GuardWare\` to the allowlist.
2. Add `C:\ProgramData\Guardware` to the allowlist.

See [Whitelist GuardWare INSIGHT](/getting-started/install-insight-agent/whitelist-insight) for the full list of files, services, and network exceptions.
{% endstep %}

{% step %}

### Install INSIGHT Agent on endpoints

Deploy the INSIGHT agent on your endpoints.

To install INSIGHT Agent:

1. Run the INSIGHT Agent installer on the endpoint.
2. Complete the setup wizard.

{% hint style="info" %}
INSIGHT Agent can also be deployed via Active Directory, Microsoft Intune, and third-party solutions. See [Installation Methods](/getting-started/install-insight-agent/install-insight-agent#installation-methods) for details.
{% endhint %}

After deployment, open **INSIGHT** > **Devices** and confirm each device shows the expected:

* **Device Name** and **User Name**.
* **Setting Assigned** and **Last Online Time**.
* **Agent Version**.

If a device does not look right, use [INSIGHT Status Monitor](/documentation/insight/dashboard/insight-status-monitor) to review endpoint status.
{% endstep %}

{% step %}

### Configure Organisation Settings

Set the organisation-wide settings that INSIGHT uses for monitoring and reporting.

Navigate to **INSIGHT** > **Organisation Settings** and configure:

* **Working Days** for accurate activity timing.
* **Websites**, **Applications**, **Printers**, and **USBs** as organisational or non-organisational.
* **Email Domains** as organisational, insecure, or undefined.
* **Trusted Emails** to reduce false positives.
* **OneDrive Folder**, **AI Usages**, and **SharePoint** settings where needed.

<figure><img src="https://1357541741-files.gitbook.io/~/files/v0/b/gitbook-x-prod.appspot.com/o/spaces%2FJOGWHv3yxVOZRUKbJJWY%2Fuploads%2F5VWVtsqMtGN05FwBIpjQ%2FWorking%20Days.png?alt=media&amp;token=6ecd3243-9c9f-438a-8dbe-5637bb1e8064" alt=""><figcaption></figcaption></figure>

For the detailed configuration steps, see [Organisation Settings](/documentation/insight/settings/organisation-settings).
{% endstep %}

{% step %}

### Create a User Policy and assign users

User Policies define how user activities are monitored, governed, and controlled within the organisation.

By default, new users are assigned to INSIGHT's base policy. If a different policy is configured as the default policy, all new users are automatically assigned to that policy.

To create a user policy:

1. Navigate to **INSIGHT** > **User Policies** and click **New User Policy**.
2. Add the policy name and description.
3. Configure the environment settings.
4. Add and configure the data types you want to monitor.
5. Save the policy.

<figure><img src="https://1357541741-files.gitbook.io/~/files/v0/b/gitbook-x-prod.appspot.com/o/spaces%2FJOGWHv3yxVOZRUKbJJWY%2Fuploads%2FKd1E6hkmbvB3BYzAXnhh%2FUsers%20policies.png?alt=media&amp;token=8eb5ebce-210c-43b3-beea-961628021789" alt=""><figcaption></figcaption></figure>

Then assign users from either:

* **INSIGHT** > **User Policies** > **Assign Users**.
* **End Users > INSIGHT > Assign Policies**.

See [User Policies](/documentation/insight/policies/user-policies) for more details.
{% endstep %}

{% step %}

### Define risk levels

Go to **INSIGHT** > **Risk Definition** and assign the risk levels for different user activities across applications, email, file sharing, and data transfers.

Start with the categories that matter most:

* SharePoint external and internal activity.
* Email, website uploads, and file-sharing applications.
* USB transfers, printing, keystrokes, copy/paste, and AI usage.

These risk levels drive dashboard visibility and help teams prioritise incidents.

<figure><img src="https://1357541741-files.gitbook.io/~/files/v0/b/gitbook-x-prod.appspot.com/o/spaces%2FJOGWHv3yxVOZRUKbJJWY%2Fuploads%2F32filBcNSLxbMbLwbzHF%2FRisk%20Definitions.png?alt=media&amp;token=a506d317-0616-45ff-ae52-100911e55583" alt=""><figcaption></figcaption></figure>

See [Risk Definitions](/documentation/insight/settings/risk-definitions) for more details.
{% endstep %}

{% step %}

### Configure Advanced Settings and assign to devices

Advanced Settings define the global monitoring parameters applied across audit reports and device policies in GuardWare INSIGHT.

The table below provides an overview of every Advanced Setting and what it does.

<table><thead><tr><th width="188.199951171875">Section</th><th>What It Does</th></tr></thead><tbody><tr><td><a href="#report-upload-and-communication-settings">Report Upload &#x26; Communication Settings</a></td><td>Controls the intervals, durations, timeouts, and bandwidth settings for uploading reports and downloading policies and commands.</td></tr><tr><td><a href="#applications-monitored-at-network-level">Applications Monitored at Network Level</a></td><td>Lists applications monitored for sensitive data uploads at the network level.</td></tr><tr><td><a href="#ip-addresses-not-monitored-at-network-level">IP Addresses Not Monitored at Network Level</a></td><td>Lists IP addresses included or excluded from network-level monitoring.</td></tr><tr><td><a href="#applications-with-monitored-ssl-traffic">Applications with Monitored SSL Traffic</a></td><td>Defines which applications have their SSL traffic monitored when network monitoring is used.</td></tr><tr><td><a href="#websites-with-monitored-ssl-traffic">Websites with Monitored SSL Traffic</a></td><td>Defines which websites have their SSL traffic monitored using certificate common names.</td></tr><tr><td><a href="#applications-with-monitored-keystrokes-and-copy-paste">Applications with Monitored Keystrokes and Copy/Paste</a></td><td>Specifies applications where keystroke and copy/paste activity is monitored or excluded.</td></tr><tr><td><a href="#websites-with-monitored-keystrokes-and-copy-paste">Websites with Monitored Keystrokes and Copy/Paste</a></td><td>Specifies websites where keystroke and copy/paste activity is monitored or excluded.</td></tr><tr><td><a href="#applications-monitored-at-network-level-lsp">Applications Monitored at Network Level (LSP)</a></td><td>Lists applications monitored at the network level using the LSP approach.</td></tr><tr><td><a href="#status-of-client-components">Status of Client Components</a></td><td>Lists client components and controls whether each is enabled or disabled.</td></tr><tr><td><a href="#file-extensions-monitored-at-file-system-level">File Extensions Monitored at File System Level</a></td><td>Filters file upload monitoring by file extension type.</td></tr><tr><td><a href="#applications-monitored-at-file-system-level">Applications Monitored at File System Level</a></td><td>Lists applications monitored for sensitive data uploads at the file system level.</td></tr><tr><td><a href="#applications-monitored-at-file-system-level-to-provide-file-path-information">Applications Monitored at File System Level to Provide File Path Information</a></td><td>Lists applications monitored to provide full file path data for network monitoring.</td></tr><tr><td><a href="#applications-monitored-at-file-system-level-where-repeated-incidents-are-ignored">Applications Monitored at File System Level where Repeated Incidents are Ignored</a></td><td>Suppresses repeated incident alerts from specified applications at the file system level.</td></tr><tr><td><a href="#applications-hosting-websites-with-end-to-end-encryption">Applications Hosting Websites with End-to-End Encryption</a></td><td>Lists browser applications monitored at the file system level to intercept file uploads on end-to-end encrypted websites.</td></tr><tr><td><a href="#websites-with-end-to-end-encryption">Websites with End-to-End Encryption</a></td><td>Lists websites with end-to-end encryption where file system monitoring is required alongside network monitoring.</td></tr></tbody></table>

To configure Advanced Settings:

1. Navigate to **INSIGHT** > **Advanced Settings,** and click **+ New Advanced Setting**.
2. Add a clear name and description.
3. Configure the settings you need.
4. Review and save the configuration.

<figure><img src="https://1357541741-files.gitbook.io/~/files/v0/b/gitbook-x-prod.appspot.com/o/spaces%2FJOGWHv3yxVOZRUKbJJWY%2Fuploads%2F02WraoidTJFLA9aoWF2M%2FAdvanced%20settings.png?alt=media&amp;token=f5a2de0d-2ef1-48aa-ae85-e9c68fbe08bc" alt=""><figcaption></figcaption></figure>

Then assign the settings to devices from **INSIGHT** > **Advanced Settings > Assign Devices.**

See [Advanced Settings](/documentation/insight/policies/advanced-settings) for details.
{% endstep %}

{% step %}

### Configure Reports

Set up scheduled reporting once devices and users are active.

Configure:

* [Risk Summary](/documentation/insight/reporting/risk-summary-report) for a consolidated, high-level overview of risky activities and user behaviour of your organisation in a single email.
* [Cyber Awareness Report](/documentation/insight/reporting/cyber-awareness-report) for contextual reports via email sent directly to end users when a risk associated with their activity is triggered.
* [User-based Risk Report](/documentation/insight/reporting/user-based-risk-report) for a detailed view of each user's risk activity.

Use test emails before broad distribution. Then enable the schedules you want.

To configure **Risk Summary**:

1. Navigate to **INSIGHT** > **Risk Summary**.
2. Click **+ New Risk Summary**.
3. Set the schedule, filters, recipients, and widgets.
4. Send a test email, then save the report.

To configure **Cyber Awareness**:

1. Navigate to **INSIGHT** > **Cyber Awareness**.
2. Click **Configure Cyber Awareness Report**.
3. Choose the schedule, users, recipients, and risks.
4. Send a test email, then create the report.

To configure the **User-based Risk Report**:

1. Navigate to **INSIGHT** > ***User-Based Risk***.
2. Click **Configure User-Based Risk Report**.
3. Configure general details, choose the users and risks.
4. Send a test email, then create the report.

See [Risk Summary](/documentation/insight/reporting/risk-summary-report), [Cyber Awareness](/documentation/insight/reporting/cyber-awareness-report), and [User-based Risk Report](/documentation/insight/reporting/user-based-risk-report) for the full configuration steps.
{% endstep %}

{% step %}

### Monitor user activities in the Dashboard

Once data starts flowing, monitor activities from the dashboard in **INSIGHT** > **Dashboard**. INSIGHT Dashboard provides a centralised view of your organisation’s data activity, user behaviour, and potential security risks.

The dashboard includes the following Risk Category tabs, allowing you to switch between different risk areas. Each tab contains widgets that provide insights into data usage patterns, trends, and potential threats.

1. **Risk Summary** provides an overview of key security and data protection indicators across your organisation.
2. **Data Type Risks** help you review policy hits by content type.
3. **SharePoint Risks** help you review file access, downloads, anonymous links, and external sharing activity.
4. **AI Usage Risks** help you monitor AI websites, AI applications, file uploads, and sensitive prompts.
5. **Behaviour Risks** help you spot productivity trends and unusual activity patterns across users.
6. **Label Events** help you track activity involving labelled Office documents and emails.
7. **Location Risks** help you identify where risky activity is happening across countries and regions.
8. **Protected Files** help you monitor how protected files move through applications, email, websites, and storage devices.
9. **System Risks** help you monitor device status, active users, audit activity, and cloud sync health.

<figure><img src="https://1357541741-files.gitbook.io/~/files/v0/b/gitbook-x-prod.appspot.com/o/spaces%2FJOGWHv3yxVOZRUKbJJWY%2Fuploads%2F46n47YjmY4km9p3w37Jg%2Fdefault%20dashboard.png?alt=media&amp;token=7e4682f7-bcbc-43b9-a43e-62db8e7d48de" alt=""><figcaption></figcaption></figure>

You can also create a custom dashboard for your team and choose the users, devices, data types, risks, and widgets that matter most for that view.

For details, see the [INSIGHT Dashboard](/documentation/insight/dashboard/insight-dashboard).
{% endstep %}
{% endstepper %}

With these steps complete, INSIGHT is ready to monitor activities and detect risks across your organisation.


# Getting Started with PROTECT

## Overview

GuardWare PROTECT encrypts and secures all file types, including MS Office documents, PDFs, images, videos, and AutoCAD files. It ensures files remain protected from unauthorised use and theft, whether stored locally or shared externally via USB, cloud drives, email, or other methods. Only authorised users and applications can open protected files. These users and applications are configured in the **GuardWare Management Console** by **administrators**.

End users interact with GuardWare PROTECT Client through the Windows Explorer right-click menu. From there, users can protect sensitive files by applying classifications, restricting access to specific Security Groups, limiting file circulation, adding an expiry date, and so on.

For Microsoft Office files, PROTECT works with Microsoft Purview Information Protection (MIP) to apply protection based on the file's classification. See [PROTECT and MIP](/documentation/protect/encryption-and-policies/classification-protection-settings) for more details.

### What this guide covers

* Console sign-in and admin access
* Microsoft 365 integration and key setup
* Agent download and endpoint rollout
* Security Groups and User Policies
* Applications and Office protection

{% hint style="warning" %}
Before getting started, make sure you have installed the GuardWare Server and can access the GuardWare Management Console URL.
{% endhint %}

{% stepper %}
{% step %}

### Log in to the Console

1. Open the GuardWare Management Console.
2. Sign in with your Super Admin or organisation admin account.
3. Complete 2FA, accept the EULA, and change the password if prompted.
   {% endstep %}

{% step %}

### Microsoft 365 integration

Before integrating, ensure you have:

* An active Microsoft Azure subscription. We recommend using a *Pay-As-You-Go* subscription.
* Access to the Microsoft Azure Portal with the required administrative permissions.

Without an active Azure subscription, GuardWare PROTECT cannot be implemented.

1. Navigate to ***ORGANISATION > Integrations.***
2. Click **Connect Microsoft 365**.
3. Sign in with a **Global Administrator** account.
4. Review the requested permissions.
5. Select **Consent on behalf of your organisation**.
6. Click **Accept**.

This creates the Azure application that PROTECT uses for Azure Key Vault setup.
{% endstep %}

{% step %}

### Set up Azure Key Vault and Key Server

We recommend creating the key vault from the Management Console.

1. Navigate to ***PROTECT > Key Vault***.
2. Click **Log in with Azure**.
3. Sign in with an account that has Azure admin permissions.
4. Select the **Subscription**.
5. Choose or create the **Resource group**.
6. Enter a unique **Key Vault name**.
7. Select the **Region** and **Pricing tier**.
8. Click **Create**.

See [Key Vault](/documentation/protect/azure-configurations/set-up-azure-key-vault) for more details.
{% endstep %}

{% step %}

### Download the PROTECT Agent

1. Navigate to **Resources** > **Agent Download**.
2. Go to **PROTECT Agent**.
3. Enter your Azure external and internal domains and location.
4. Click **Submit**. The Download link only appears after the configuration is complete.

Once the installation settings are complete, the **Download Installer** link becomes available. Click it to download the agent with the configured settings.
{% endstep %}

{% step %}

### Whitelist PROTECT on endpoints

Whitelist PROTECT in the endpoints' AV, EDR, or XDR platforms.

1. Add `C:\Program Files\GuardWare\PROTECT` to the allowlist.
2. Add `C:\ProgramData\Guardware` to the allowlist.
3. Allow `GWProtectDesktop.exe` to reach `<KeyVaultName>.vault.azure.net` over the port `443`.

See [Whitelist GuardWare PROTECT](/getting-started/install-protect-agent/whitelist-protect) for the full list of files, services, and network exceptions.
{% endstep %}

{% step %}

### Install PROTECT Agent on endpoints

1. Run the PROTECT Agent installer on the endpoint.
2. Complete the setup wizard.
3. Install Azure CLI or Visual C++ if prompted.
4. Restart the device when installation finishes.
5. In the Welcome wizard, click **Login with Azure**.
6. Select the correct **Tenant ID** and **Subscription**.
7. Allow **GWProtectDesktop** through the Windows firewall if prompted.

After the agent is installed and the user signs in, the device appears in [PROTECT Devices](/documentation/protect/users-and-devices/protect-devices). From there, admins can enable or disable the agent, uninstall the agent, and open user details to enable or disable a user, enable or disable Force Encrypt, and decrypt files for that user.

See [Install PROTECT Agent](/getting-started/install-protect-agent/install-protect-agent) for full device setup.
{% endstep %}

{% step %}

### Create Security Groups and assign users

Security Groups define who can open protected files.

1. Navigate to ***PROTECT > Security Groups.***
2. Click **+New Security Group**.
3. Create the group manually or import it from AD.
4. Choose the encryption mode.
5. Save the group.
6. Click **+Assign Users** to add members.

Any new user who signs in successfully is added to **All Users** by default.

See [Security Groups](/documentation/management-console/security-group/security-group) for more details.
{% endstep %}

{% step %}

### Create a User policy and assign users

User Policies control which client actions users can access.

1. Navigate to ***PROTECT > User Policies***.
2. Click **+New User Policy**.
3. Enter the policy title and description.
4. Enable the features your users need.
5. Save the policy.
6. Assign the policy to users.

See [User Policies](/documentation/protect/encryption-and-policies/user-policies) for more details.
{% endstep %}

{% step %}

### Add applications

Applications define which programs can open, edit, and save protected files.

1. Navigate to ***PROTECT > Applications***.
2. Click **+New Application**.
3. Enter the **Executable Name** and **Application Suite**.
4. Add the **Folder Path** if needed.
5. Define which extensions the application can encrypt and decrypt.
6. Enable **Network Drive Support** if required.
7. Click **Save**.

See [Applications](/documentation/protect/protection-scope/trusted-applications) for more details.
{% endstep %}

{% step %}

### PROTECT Office

Choose how Office files are protected.

You can use:

* **MIP only**
* **MIP and PROTECT**
* **PROTECT only**

To configure this:

1. Navigate to ***ORGANISATION > Integrations***.
2. Enable **Protect Office files using MIP** if required.
3. Enable **Protect Office files using both MIP and PROTECT** if you want layered protection.
4. Click **Submit**.

See [PROTECT and MIP](/documentation/protect/encryption-and-policies/classification-protection-settings) for more details.
{% endstep %}

{% step %}

### Optional next steps

After the baseline setup, you can expand the rollout.

* Configure [Data Types and classifications](/documentation/management-console/data-governance/data-type)
* Configure [Websites ](/documentation/protect/protection-scope/trusted-websites)and [Office Add-in](/documentation/protect/reports-and-configs/office-add-in)
* Set up [SCAN & ENCRYPT](/documentation/protect/scan-and-encrypt/scan-and-encrypt) if you need to locate and encrypt files with sensitive data located in file servers and SharePoint.
  {% endstep %}
  {% endstepper %}

With these steps complete, PROTECT is ready to protect files across your organisation using the policies, groups, and applications you configured.


# Getting Started with Partner Portal

The GuardWare Partner Portal is the central management layer for deploying and managing GuardWare on behalf of your customers. From a single interface, you can provision new customer organisations, assign product licences, configure shared settings, and access any customer's management console when needed.

Each organisation you create gets its own completely isolated environment: a dedicated management console, separate database, and independent users. You control what each organisation has access to and can expand or adjust that at any time.

As a portal user, you are assigned one of two roles:

* A **Partner Admin** can perform all portal functions, including managing other portal users.
* A **Partner User** has the same access to customer management but cannot add or modify other users.

### Before Getting Started

Before you can access the Partner Portal, GuardWare needs to set up your account. Once that is done, your login credentials will be sent to your registered email address. If you have not received them, wait a few minutes and check your spam folder. If they still have not arrived, contact your GuardWare account manager to have them resent.

{% stepper %}
{% step %}

## Sign In

GuardWare creates your first Partner Admin account. Your login credentials are sent to your registered email address.

<figure><img src="https://1357541741-files.gitbook.io/~/files/v0/b/gitbook-x-prod.appspot.com/o/spaces%2FJOGWHv3yxVOZRUKbJJWY%2Fuploads%2FsbDRzjbJiM43fwYERgsL%2Fimage.png?alt=media&amp;token=af328eb6-172c-4c4b-ac63-6dcf754d475a" alt="" width="563"><figcaption></figcaption></figure>

1. Open a browser and navigate to your portal URL provided by GuardWare.
2. If you are accessing the portal directly on the server, use:\
   `http://localhost/gw/login` or,  \
   `http://<IP Address>/gw/login`.

#### Signing in with email and password

1. Enter your email and the one-time password from your welcome email.
2. Set up 2FA using any Authenticator app such as Microsoft Authenticator or Google Authenticator.
3. Enter the authentication code from your Authenticator app.
4. Reset your password when prompted.
5. Log in again with your new password.
6. Enter your 2FA code.
7. Accept the End User Licence Agreement. This only appears once.&#x20;

#### Signing in with a Microsoft account

Before signing in with a Microsoft account, ensure your account is connected to Azure AD (Entra ID).

1. Click **Sign in with Microsoft** and authenticate through your Microsoft account.
2. Accept the End User Licence Agreement. This only appears once.
   {% endstep %}

{% step %}

### Add Your Team

Managing customers across multiple organisations is rarely a one-person job. Adding your team to the portal means everyone has their own account and can start working across customer organisations without sharing credentials.&#x20;

Only Partner Admins can add new users, so this needs to be done before your team can access anything.

<figure><img src="https://1357541741-files.gitbook.io/~/files/v0/b/gitbook-x-prod.appspot.com/o/spaces%2FJOGWHv3yxVOZRUKbJJWY%2Fuploads%2FeDPJGdWqi88Fy0MiXCSS%2Fimage.png?alt=media&amp;token=d9962acc-eaa7-47ef-883a-d0661e44f144" alt="" width="563"><figcaption></figcaption></figure>

1. Log in as a Partner Admin and go to **PARTNER USERS**.
2. Click **+Add Partner User**.
3. Enter the user's name, email address, phone number, and designation.
4. Click **Create**. The user receives their login credentials by email and can sign in straight away.

After creating a user, you can update their details or reset their password from the same screen.
{% endstep %}

{% step %}

## Create a Customer Organisation

An organisation is an isolated environment you create for each of your customers. It has its own users, products, licences, and data, completely separate from any other organisation on your portal.&#x20;

What makes this powerful is that you can step directly into any organisation's environment from the portal. This makes it easy to set things up on the customer's behalf, troubleshoot issues, or verify that everything is running correctly on the customer's end.

<figure><img src="https://1357541741-files.gitbook.io/~/files/v0/b/gitbook-x-prod.appspot.com/o/spaces%2FJOGWHv3yxVOZRUKbJJWY%2Fuploads%2FU0Z41CIObGD3XqTljZXH%2Fimage.png?alt=media&amp;token=c5ed5e91-0ae5-4183-b132-0fb53ab54872" alt="" width="563"><figcaption></figcaption></figure>

1. Go to **ORGANISATION** and click **+Add Organisation**.
2. Enter the organisation name, timezone, country, city, address, website, and industry sector. Upload a logo if available. Click **Next**.
3. Enter the primary contact's name, email, phone number, job title, and department.&#x20;
4. Enable **Is Primary Contact Person** to mark them as the main contact. At least one contact must be set as the primary contact, and only one can hold this role at a time.
5. Enable **Is System Account** if you want to send login credentials to this contact automatically so they can access their management console.
6. Click **+Add Contact**, then **Next**.
7. Select the products the customer has purchased. For each, choose the licence type (Trial, Per User, Per GB, Campus, or NFR), set the duration, and enter the user count. Click **Next**.
8. Review everything and click **Submit**. The environment is provisioned immediately. If the contact was marked as a **System Account**, their credentials are sent automatically via email.

{% hint style="info" %}
To start using any GuardWare product, the customer will need to download and install the appropriate agent from their management console. Click the links below to download and configure agents:&#x20;

* **DISCOVER**
* **INSIGHT**
* **PROTECT**
  {% endhint %}

### Adding Organisation Users

Once the organisation is set up, you can give the customer's own staff independent access. Organisation users have full control over all functions within their own environment and do not need to go through the Partner Portal to access it. You can add organisation users in two ways:

#### From the Partner Portal

<figure><img src="https://1357541741-files.gitbook.io/~/files/v0/b/gitbook-x-prod.appspot.com/o/spaces%2FJOGWHv3yxVOZRUKbJJWY%2Fuploads%2Fz8BidS0giWSH8RvZauP5%2Fimage.png?alt=media&amp;token=e358a2e9-6c50-4195-afc0-7ebd1ab02a73" alt=""><figcaption></figcaption></figure>

1. Go to **ORGANISATION**, click **Actions** on the target organisation, and select **Manage Users**.
2. Click **+Add User**.
3. Enter the user's name, email address, and contact number.
4. Click **Create**. The user receives their login credentials by email and can sign in straight away.

#### From within the Organisation's Console

<figure><img src="https://1357541741-files.gitbook.io/~/files/v0/b/gitbook-x-prod.appspot.com/o/spaces%2FJOGWHv3yxVOZRUKbJJWY%2Fuploads%2Fxdbo1i3BVpMjfSdTEMCJ%2Fimage.png?alt=media&amp;token=5e4d3be7-3d48-4467-9e87-536be2a9985f" alt="" width="563"><figcaption></figcaption></figure>

1. Enter the organisation's management console via the **Partner** button or by clicking the **Connect** button under the **Organisation Name** column.
2. Go to **ORGANISATION** > **Users.**
3. Click **+ Enroll New User**.
4. Enter the user's name, email address, contact number, and select a password delivery method.
5. Click **Save**. The user receives their login credentials by email, or you may need to deliver the password via a secure channel (depends on password delivery method) and can sign in straight away.
   {% endstep %}

{% step %}

## Manage Product Licences

Once your organisation is set up and products have been assigned, you may need to come back to manage those licences over time. This could mean adding a new product that the customer has purchased, renewing a licence that is due for expiry, or deactivating something that is no longer needed.

A licence shows as **Not Activated** until the customer installs the relevant agent and it connects to the management console for the first time, after which it switches to **Active**.

<figure><img src="https://1357541741-files.gitbook.io/~/files/v0/b/gitbook-x-prod.appspot.com/o/spaces%2FJOGWHv3yxVOZRUKbJJWY%2Fuploads%2F7TrTbou5uzKKNRfcpYy9%2Fimage.png?alt=media&amp;token=e98c0584-d6dc-448a-b4df-176e0ae3569a" alt=""><figcaption></figcaption></figure>

1. Go to **ORGANISATION**, click **Actions** on the target organisation, and select **Manage Products**.
2. To add a new product, click **+Assign New Product**, select the product and licence type, set the duration and user count, then click **Save**.
3. To manage an existing product, click **Actions** on the product entry and select the appropriate action based on the table below:

<table><thead><tr><th width="106">Action</th><th width="127">Status</th><th>What it does</th></tr></thead><tbody><tr><td>Update</td><td>Not Activated</td><td>Allows you to modify the licence type and duration. Available options are dependent on what the Partner Portal Super Admin has enabled for your account.</td></tr><tr><td>Delete</td><td>Not Activated</td><td>Removes the product from the customer organisation entirely.</td></tr><tr><td>Renew</td><td>Active</td><td>Renews the licence for a further period.</td></tr><tr><td>Deactivate</td><td>Active</td><td>Deactivates the product. It will no longer be accessible from the customer's console.</td></tr></tbody></table>
{% endstep %}

{% step %}

## Connect Microsoft 365

Connecting a customer's Microsoft 365 environment is required before GuardWare can scan Exchange Online or SharePoint Online, or sync sensitivity labels from Microsoft Purview. It is a one-time setup per organisation and requires the customer's Global Administrator credentials.&#x20;

In most cases, this step is performed by someone at the customer's end. However, if you manage the customer's IT environment and hold their Global Administrator credentials, you can complete this on their behalf.

Once connected, it runs in the background without any ongoing maintenance. If Microsoft requests revalidation of permissions, you can re-authorise by entering the organisation's console and re-granting access with a single button click.

<figure><img src="https://1357541741-files.gitbook.io/~/files/v0/b/gitbook-x-prod.appspot.com/o/spaces%2FJOGWHv3yxVOZRUKbJJWY%2Fuploads%2FWG3g3xNwWQMPZcyZFfMF%2Fimage.png?alt=media&amp;token=03d74e44-9b51-489f-a223-3f1486328c06" alt="" width="487"><figcaption></figcaption></figure>

1. Go to **ORGANISATION**, click **Actions** on the target organisation, and select **M365 Integration**.
2. Click **Connect M365** and select or enter the Global Administrator account for that organisation.
3. On the Microsoft consent screen, select the **Consent on behalf of your organisation** checkbox and click **Accept**.
   {% endstep %}

{% step %}

## Configure SMTP

By default, automated emails (invitations, alerts, notifications) are sent through  GuardWare's mail servers. If a customer wants those emails sent from their own servers, you can configure a custom SMTP setting for that organisation.

1. Go to **ORGANISATION**, click **Actions** on the target organisation, and select **SMTP Settings**.
2. Enter the SMTP server address, port, and authentication credentials provided by the customer.
3. Send a test email to verify it is working, then click **Save**.
   {% endstep %}

{% step %}

## Set Up Data Type Templates (Optional)

A Data Type defines a specific piece of sensitive information that GuardWare looks for during a scan, such as a passport number or a bank account detail. A Data Type Template is a grouping of Data Types that you can build once and assign across multiple organisations, saving you from having to configure the same set individually each time.&#x20;

This is optional, as customers already have access to a library of pre-defined data types in their management console and can run scans without a template assigned from the partner portal.

### Create Custom Data Types

<figure><img src="https://1357541741-files.gitbook.io/~/files/v0/b/gitbook-x-prod.appspot.com/o/spaces%2FJOGWHv3yxVOZRUKbJJWY%2Fuploads%2FqSmRhJPe2Y0HFOw3VFIk%2Fimage.png?alt=media&amp;token=a1e158bd-c546-4c98-9747-799bb1311c09" alt="" width="563"><figcaption></figcaption></figure>

1. Go to **Data Types > Data Type** and click **+New Data Type**.
2. Configure the data type settings and click **Save**.

{% hint style="info" %}
Data types created inside an organisation's environment are only available within that organisation. You cannot add them to a partner-level template.
{% endhint %}

### Create and Assign Data Type Templates

<figure><img src="https://1357541741-files.gitbook.io/~/files/v0/b/gitbook-x-prod.appspot.com/o/spaces%2FJOGWHv3yxVOZRUKbJJWY%2Fuploads%2F3AjemiXkLlzPpv1hdNTQ%2Fimage.png?alt=media&amp;token=4f247958-e446-4199-bcde-76cb519c33fb" alt="" width="563"><figcaption></figcaption></figure>

1. Go to **Data Types > Data Type Template** and click **+New Data Type Template**.
2. Enter a name and short description, then click **Continue**. Select **Import Settings** first if you want to copy from an existing template.
3. Click **Save Template**.
4. On the template list, find your new template and click **Add Data Type** under the Actions column. Select the data types to include and confirm.
5. Go to **ORGANISATION**, click **Manage Template** under the Integrations column of the target organisation.
6. Under Data Types, select the template from the dropdown and save.
   {% endstep %}

{% step %}

## Set Up PROTECT Templates (Optional)

{% hint style="info" %}
This section is only applicable if the customer has a PROTECT licence and PROTECT has been enabled for your account by GuardWare.
{% endhint %}

PROTECT encrypts your customer's files and ensures they can only be opened by authorised users in approved applications. The protection travels with the file regardless of where it ends up, on a device, in email, on a USB drive, or in cloud storage. If someone outside the authorised group tries to open it, they cannot.

A PROTECT template is built from three components:

* [**User Policy**](#user-policy) controls which PROTECT actions are available to end users on their devices, such as protecting a file, sharing it, or setting an expiry.
* [**Application Template**](#application-template) defines which applications are permitted to open, edit, and save protected files. Any app not on the list is blocked from accessing them.
* [**Avoid Folder Template**](#avoid-folder-template) specifies directories that should be excluded from encryption, typically system folders or application directories that should not be touched.

Default configurations are already in place, so you only need to configure what needs to be customised beyond those defaults.

You assign each component to an organisation separately via **ORGANISATION** > **Manage Template.**

### User Policy

<figure><img src="https://1357541741-files.gitbook.io/~/files/v0/b/gitbook-x-prod.appspot.com/o/spaces%2FJOGWHv3yxVOZRUKbJJWY%2Fuploads%2FqUxQn0jBY7A97EOpm54f%2Fimage.png?alt=media&amp;token=86ce719f-6fdb-4ec2-bb8b-9af283492732" alt="" width="563"><figcaption></figcaption></figure>

1. Go to **PROTECT > User Policies** and click **+New User Policy**.
2. Enter a title and description. Enable **Detours** to prevent protected files from being auto-synced to OneDrive or SharePoint.
3. Click **Save**.
4. Go to **ORGANISATION**, click **Manage Template** under the Integrations column of the target organisation, and select the policy from the User Policies dropdown.

### Application Template

<figure><img src="https://1357541741-files.gitbook.io/~/files/v0/b/gitbook-x-prod.appspot.com/o/spaces%2FJOGWHv3yxVOZRUKbJJWY%2Fuploads%2FVSlxNOyudwP7v0WTCvYU%2Fimage.png?alt=media&amp;token=34b65e0e-59a2-47a5-aee2-3ff364498232" alt="" width="563"><figcaption></figcaption></figure>

1. Go to **PROTECT > Application > Application List** and click **+New Application**. Configure the application settings and click **Save**.
2. Go to **PROTECT > Application > Application Template** and click **+New Application Template**.
3. Enter a name and description, then click **Save Template**.
4. On the template list, find your new template and click **Add Application** under the **Actions** column. Select the applications to include and confirm.
5. Go to **ORGANISATION**, click **Manage Template** under the Integrations column of the target organisation, and select the template from the Application Settings dropdown.

### Avoid Folder Template

<figure><img src="https://1357541741-files.gitbook.io/~/files/v0/b/gitbook-x-prod.appspot.com/o/spaces%2FJOGWHv3yxVOZRUKbJJWY%2Fuploads%2FBt3OyImPbYai9bDcQ9Zm%2Fimage.png?alt=media&amp;token=ab7f3722-a21c-4d71-9a3d-a32372a9bd1b" alt="" width="563"><figcaption></figcaption></figure>

1. Go to **PROTECT > Avoid Folders > Avoid Folder List** and click **+New Avoid Folder**.
2. Enter a title, the directory path, and any subfolders to include. Click **Save**.
3. Go to **PROTECT > Avoid Folders > Avoid Folder Template** and click **+New Avoid Folder Template**.
4. Enter a name and description, then click **Save Template**.
5. On the template list, find your new template and click **Add Avoid Folder** under the **Actions** column. Select the folders to avoid and confirm.
6. Go to **ORGANISATION**, click **Manage Template** under the Integrations column of the target organisation, and select the template from the Avoid Folders dropdown.

{% hint style="danger" %}
Do not modify the following system-defined entries: AppData, Program Files, Program Files (x86), and Windows. These must remain excluded.
{% endhint %}
{% endstep %}

{% step %}

## Monitor via the Dashboard

As your customer base grows, it becomes increasingly difficult to keep track of every organisation's licence status, agent health, and product usage individually. The Dashboard gives you a real-time, read-only overview of your entire portfolio in one place, so you can spot issues, track activation progress, and monitor how actively each organisation is using the platform without having to enter each one separately.

For the latest data, click **Sync** on the relevant column. The Last Synced column shows the date and time of the last sync for each organisation.

1. Go to **DASHBOARD**.
2. Review the tables below for a breakdown of what each section shows.
3. Click **Sync** on Number of Licences, Agent Status, or DISCOVER Usage to pull the latest data.

#### Number of Licences

Licences allocated to each organisation per product.

<table><thead><tr><th width="139">Column</th><th>What it shows</th></tr></thead><tbody><tr><td>Organisation</td><td>Name of the customer organisation</td></tr><tr><td>Date Enrolled</td><td>Date the organisation was added to the portal</td></tr><tr><td>DISCOVER</td><td>Active agents out of total licences issued, or Not Activated if the product has not been set up</td></tr><tr><td>INSIGHT</td><td>Active agents out of total licences issued, or Not Activated if the product has not been set up</td></tr><tr><td>PROTECT</td><td>Active agents out of total licences issued, or Not Activated if the product has not been set up</td></tr><tr><td>Last Synced</td><td>Date and time of the last sync</td></tr></tbody></table>

#### Agent Status

Total and active agents deployed per product across each organisation.

<table><thead><tr><th width="209">Column</th><th>What it shows</th></tr></thead><tbody><tr><td>Organisation</td><td>Name of the customer organisation</td></tr><tr><td>PROTECT Total Agent</td><td>Total PROTECT agents deployed</td></tr><tr><td>PROTECT Active Agent</td><td>Number of active PROTECT agents</td></tr><tr><td>DISCOVER Total Agent</td><td>Total DISCOVER agents deployed</td></tr><tr><td>DISCOVER Active Agent</td><td>Number of active DISCOVER agents</td></tr><tr><td>INSIGHT Total Agent</td><td>Total INSIGHT agents deployed</td></tr><tr><td>INSIGHT Active Agent</td><td>Number of active INSIGHT agents</td></tr><tr><td>Last Synced</td><td>Date and time of the last sync</td></tr></tbody></table>

#### Management Console Usage

Tracks login activity across organisation consoles.

<table><thead><tr><th width="225">Column</th><th>What it shows</th></tr></thead><tbody><tr><td>Organisation</td><td>Name of the customer organisation</td></tr><tr><td>Users Registered</td><td>Total number of users registered in the organisation</td></tr><tr><td>Last Login</td><td>Date and time of the most recent login</td></tr><tr><td>Last Logged In User</td><td>Email address of the user who last logged in</td></tr></tbody></table>

#### DISCOVER Usage

DISCOVER product usage across managed organisations.

<table><thead><tr><th width="244">Column</th><th>What it shows</th></tr></thead><tbody><tr><td>Organisation</td><td>Name of the customer organisation</td></tr><tr><td>Total Scan Jobs</td><td>Total number of scan jobs run</td></tr><tr><td>Files Investigated</td><td>Total files moved into investigation</td></tr><tr><td>Files Remediated</td><td>Total files remediated</td></tr><tr><td>Total Email Scans</td><td>Total email scan jobs run</td></tr><tr><td>Total Device Scans</td><td>Total device scan jobs run</td></tr><tr><td>Total SharePoint Scans</td><td>Total SharePoint scan jobs run</td></tr><tr><td>Last Synced</td><td>Date and time of the last sync</td></tr></tbody></table>
{% endstep %}
{% endstepper %}


# Uninstall the Management Console

{% hint style="danger" %} <mark style="color:$danger;">**Before uninstalling:**</mark> <mark style="color:$danger;"></mark><mark style="color:$danger;">Ensure you have administrator rights and have backed up any necessary configurations or data. Failing to follow the uninstall steps correctly can leave behind residual files, registry entries, and service stubs that can cause conflicts when you reinstall the Management Console later.</mark>
{% endhint %}

1. Double-click the installer to launch the **GuardWare Server Setup Wizard.**<br>

   <div align="left"><figure><img src="https://1357541741-files.gitbook.io/~/files/v0/b/gitbook-x-prod.appspot.com/o/spaces%2FJOGWHv3yxVOZRUKbJJWY%2Fuploads%2FjLHf4wfBGT3xss3bTfWk%2Fimage.png?alt=media&amp;token=fa0a3abe-bde3-4e88-b487-327f61e2096c" alt="" width="369"><figcaption></figcaption></figure></div>
2. Click **Next**.
3. Select **Remove** and on the next page, click **Remove**.<br>

   <div align="left"><img src="https://1357541741-files.gitbook.io/~/files/v0/b/gitbook-x-prod.appspot.com/o/spaces%2FJOGWHv3yxVOZRUKbJJWY%2Fuploads%2FohMNA9dCBQtb4QRjwKbw%2FUnknown%20image?alt=media&amp;token=bf5ba1b7-0eb0-42e3-b9eb-dbfb13ecd2dc" alt="" width="375"></div>
4. Wait for the process to complete. You may be prompted to restart your device to complete the uninstallation.


# Uninstall DISCOVER Agent

{% hint style="danger" %} <mark style="color:$danger;">**Before Uninstalling:**</mark> <mark style="color:$danger;"></mark><mark style="color:$danger;">Ensure you have administrator rights and have backed up any necessary configurations or data. Failing to follow the uninstall steps correctly can leave residual files, registry entries, and service stubs that cause conflicts if you reinstall later.</mark>
{% endhint %}

1. Double-click the DISCOVER Agent installe&#x72;**.**
2. Click **Next**.<br>

   <div align="left"><img src="https://1357541741-files.gitbook.io/~/files/v0/b/gitbook-x-prod.appspot.com/o/spaces%2FJOGWHv3yxVOZRUKbJJWY%2Fuploads%2FmV6ovGThTzhmj79uxpXM%2FUnknown%20image?alt=media&amp;token=a36a736d-b6e7-4e79-8db6-0e9677ba0450" alt="" width="375"></div>
3. Select **Remove** and on the next page, click **Next**.<br>

   <div align="left"><figure><img src="https://1357541741-files.gitbook.io/~/files/v0/b/gitbook-x-prod.appspot.com/o/spaces%2FJOGWHv3yxVOZRUKbJJWY%2Fuploads%2FNZQKM1L6nlvliToWhZAZ%2Fimage.png?alt=media&amp;token=38558336-b70d-42aa-8b13-428af5f357f4" alt="" width="375"><figcaption></figcaption></figure></div>
4. Wait for the process to complete. You may be prompted to restart your device to complete the uninstallation.


# Uninstall INSIGHT Agent

You can uninstall the INSIGHT Agent using either the Management Console or the uninstaller file.

## Uninstall via Management Console

The **Uninstall Client** command under **Devices > INSIGHT** removes the INSIGHT agent from the selected devices.

Use this method to remotely uninstall the INSIGHT agent from a device.

1. Navigate to **Devices > INSIGHT**.
2. Select one or more devices from the list and click **Assign Command**.<br>

   <figure><img src="https://1357541741-files.gitbook.io/~/files/v0/b/gitbook-x-prod.appspot.com/o/spaces%2FJOGWHv3yxVOZRUKbJJWY%2Fuploads%2F3f5J44y2iZwpqKadeV5E%2FAssign%20Command%20-%20Uninstall.png?alt=media&amp;token=9951b6b8-6106-4ff9-b2c3-68aaec93e714" alt=""><figcaption></figcaption></figure>
3. Select **Uninstall Client**.<br>

   <figure><img src="https://1357541741-files.gitbook.io/~/files/v0/b/gitbook-x-prod.appspot.com/o/spaces%2FJOGWHv3yxVOZRUKbJJWY%2Fuploads%2FOxtIxdyhfolX1DalqzFW%2FUninstall%20INSIGHT%20Agent.png?alt=media&amp;token=d9e04fb7-4ae3-47e3-843e-adf2b813a87b" alt=""><figcaption></figcaption></figure>
4. Select either **Immediate** or **Silent**.
   1. **Immediate:** Uninstalls the agent straight away. The user's session is interrupted and `explorer.exe` is restarted.
   2. **Silent:** Uninstalls the agent in the background. Cleanup completes on the next device restart with no user interruption.
5. Click **Confirm** to assign the command.

## Uninstall via Uninstaller File

Use this method to uninstall the agent directly from a PC.

1. Right-click the uninstaller file and select **Run as administrator**.
2. Click **Yes** in the confirmation pop-up.\
   ![](https://1357541741-files.gitbook.io/~/files/v0/b/gitbook-x-prod.appspot.com/o/spaces%2FJOGWHv3yxVOZRUKbJJWY%2Fuploads%2F5SNmINb9QzhwebnIB5v1%2FUninstall%20Agent%201.png?alt=media\&token=ae8ee343-3b95-4c57-8dda-f6bc4037473a)
3. If there are any open applications that should be closed before continuing to uninstall, a pop-up appears, select **Automatically close applications and attempt to restart them after setup is complete** and click **Ok**.\
   ![](https://1357541741-files.gitbook.io/~/files/v0/b/gitbook-x-prod.appspot.com/o/spaces%2FJOGWHv3yxVOZRUKbJJWY%2Fuploads%2FVcH7dY3zA3gq3dm8ieHe%2FUninstall%20Agent%202.png?alt=media\&token=d481aa7b-85f9-4622-bbd1-55aed60e1741)
4. &#x20;The uninstallation process will complete.


# Uninstall PROTECT Agent

{% hint style="danger" %} <mark style="color:$danger;">**Make sure to remove protection from your protected files before uninstalling PROTECT; otherwise, you won't be able to access them afterwards.**</mark>
{% endhint %}

To remove GuardWare PROTECT from your device:

1. Double-click the **PROTECT installer file**.
2. In the **Setup Wizard,** click **Next** to continue.

<div align="left"><img src="https://1357541741-files.gitbook.io/~/files/v0/b/gitbook-x-prod.appspot.com/o/spaces%2FJOGWHv3yxVOZRUKbJJWY%2Fuploads%2F0Dm1joQozTDWskgjMMhb%2FUnknown%20image?alt=media&amp;token=887f2e0a-7495-4f35-bbba-49632d02a10e" alt="" width="375"></div>

3. You’ll get options to modify, repair, or remove PROTECT. Choose **Remove**, then click **Remove** to uninstall GuardWare PROTECT.

<div align="left"><img src="https://1357541741-files.gitbook.io/~/files/v0/b/gitbook-x-prod.appspot.com/o/spaces%2FJOGWHv3yxVOZRUKbJJWY%2Fuploads%2F6onB5bXKv42dVI6r7Wzd%2FUnknown%20image?alt=media&amp;token=e9a7097b-7aef-48ea-a0a1-8f149061035d" alt="" width="375"></div>

<div align="left"><img src="https://1357541741-files.gitbook.io/~/files/v0/b/gitbook-x-prod.appspot.com/o/spaces%2FJOGWHv3yxVOZRUKbJJWY%2Fuploads%2F8LqbvE9v1Al8wuauSKCo%2FUnknown%20image?alt=media&amp;token=40badb1f-fa8e-4f35-bf28-f351198eca79" alt="" width="375"></div>

4. (Optional) To review or change installation settings, click **Back**. To exit without uninstalling, click **Cancel**.
5. During the uninstallation, you may see the following dialogs:
   1. **Installer Information**

      When the Installer Information appears, click **OK** to continue with the uninstallation.\
      ![](https://1357541741-files.gitbook.io/~/files/v0/b/gitbook-x-prod.appspot.com/o/spaces%2FJOGWHv3yxVOZRUKbJJWY%2Fuploads%2FQ4iJpW0Q7HkXF5g9l4ru%2Ftiff.png?alt=media\&token=41f0f37e-f962-4f05-a3bb-13b7bbd7f618)
   2. **User Account Control (UAC)**\
      This is a standard Windows security feature that verifies whether you want to allow the installer to make changes to your computer. When this dialog appears:&#x20;
      1. Verify that the publisher is displayed as GuardWare Australia Pty Ltd.
      2. Click **Yes** to allow the uninstallation to proceed. If you select **No**, the uninstallation will be cancelled.
6. After uninstallation is complete, you will be prompted to restart your device. Click **Yes**.

{% hint style="info" %}
Restarting is mandatory for GuardWare PROTECT to fully uninstall.
{% endhint %}


# Training Centre

{% hint style="success" %}

### Welcome to GuardWare Training Centre!

Whether you're getting started or expanding your expertise, our training courses help you confidently deploy, configure, and manage GuardWare products.&#x20;

Choose between self-paced video tutorials or join a live instructor-led session.
{% endhint %}

## Choose Your Learning Path

<table data-card-size="large" data-view="cards"><thead><tr><th></th><th data-hidden data-card-cover data-type="image">Cover image</th><th data-hidden data-card-target data-type="content-ref"></th></tr></thead><tbody><tr><td>Learn at your own pace with structured video tutorials covering installation, configuration, administration, and best practices.</td><td><a href="https://2177129992-files.gitbook.io/~/files/v0/b/gitbook-x-prod.appspot.com/o/spaces%2FLj7fMs4oYefCLpN07V3S%2Fuploads%2FO27WMd5jDmeFZsZruopN%2Fself-paced.png?alt=media&amp;token=a853f012-6b74-49b2-8c66-099e93064b62">self-paced.png</a></td><td><a href="/training-centre/self-paced-video-training/server-and-agent-installation-video-guides">SELF-PACED VIDEO TRAINING</a></td></tr><tr><td>Join live online training sessions led by GuardWare instructors with demonstrations and interactive Q&#x26;A.</td><td><a href="https://2177129992-files.gitbook.io/~/files/v0/b/gitbook-x-prod.appspot.com/o/spaces%2FLj7fMs4oYefCLpN07V3S%2Fuploads%2FOjLQg9UpQKjUV4sWU2uH%2Finstructor-led.png?alt=media&amp;token=b109716f-e71b-4066-b882-347e42e60953">instructor-led.png</a></td><td><a href="/training-centre/instructor-led-training/guardware-insight-training">GuardWare INSIGHT Training</a></td></tr></tbody></table>

## Training Announcements

{% hint style="warning" icon="bullhorn" %}
**New self-paced video releases:** [Server Installation video guide](/training-centre/self-paced-video-training/server-and-agent-installation-video-guides)
{% endhint %}


# Server and Agent Installation Video Guides

Learn how to install the Management Console and Agents for each product through structured video tutorials.

## Server Installation

The GuardWare Management Console is the central platform that coordinates DISCOVER, INSIGHT, and PROTECT across your organisation.

### Course Information

<table data-header-hidden><thead><tr><th width="163.20001220703125">Field</th><th>Value</th></tr></thead><tbody><tr><td>Duration</td><td>5 min video · installation time varies by environment</td></tr><tr><td>Format</td><td>Self-paced video tutorial</td></tr><tr><td>Skill level</td><td>Intermediate</td></tr><tr><td>Prerequisites</td><td>Basic Windows Server administration, familiarity with IIS, MySQL, and networking concepts</td></tr></tbody></table>

For organisations that require everything to run inside their own network, for security or compliance reasons, the Management Console can be installed entirely on-premises.

**This video guide explains:**

* Reviewing system requirements based on organisation size, covering CPU, memory, disk space, and required network ports.
* An overview of the required software dependencies: Microsoft Visual C++ Redistributable, MySQL, Redis, OpenSSL, IIS with URL Rewrite and Application Request Routing, and 7-Zip.
* Installing the Management Console, including configuring the database connection, Redis, and creating a Super Admin account.
* Configuring HTTPS access.
* Updating an existing Management Console installation.
* Logging in for the first time.

{% embed url="<https://www.youtube.com/watch?v=aYpEUusHQUw>" %}

## Agent Installation

An agent is software installed on a managed endpoint or server that connects the system to the GuardWare Management Console and carries out tasks assigned from the Management Console.&#x20;

### Course Information

<table data-header-hidden><thead><tr><th width="163.20001220703125">Field</th><th>Value</th></tr></thead><tbody><tr><td>Duration</td><td>5 min 37 sec video · installation time varies by environment</td></tr><tr><td>Format</td><td>Self-paced video tutorial</td></tr><tr><td>Skill level</td><td>Intermediate</td></tr><tr><td>Prerequisites</td><td>Management Console installed and accessible</td></tr></tbody></table>

**This video guide explains:**

* Configuring Agent settings for DISCOVER, INSIGHT, and PROTECT.
* Downloading the agent installer for each product.
* Installing the agents.

{% embed url="<https://youtu.be/p_XZxOZ72u0?si=0Ekpv65s0ZHrvO92>" %}


# GuardWare DISCOVER Video Guide

Learn GuardWare DISCOVER through structured video tutorials.

GuardWare DISCOVER enables organisations to locate, classify, investigate, and remediate sensitive information across on-premises and cloud environments.

The purpose of this training is to teach participants:

* Understand how GuardWare identifies sensitive information using Data Types.
* Configure discovery targets across on-premises and cloud environments.
* Perform data discovery scans.
* Review scan results and dashboards.
* Investigate sensitive findings.
* Perform remediation actions to reduce data exposure.
* Monitor discovery activities through reports and dashboards.

DISCOVER forms the first stage of GuardWare's data-centric security platform by identifying where sensitive information resides before monitoring its movement with INSIGHT or protecting it with PROTECT.

### Course Information

<table data-header-hidden><thead><tr><th width="163.20001220703125">Field</th><th>Value</th></tr></thead><tbody><tr><td>Duration</td><td>1 hour</td></tr><tr><td>Format</td><td>Self-paced video tutorials</td></tr><tr><td>Skill level</td><td>Beginner to Intermediate</td></tr><tr><td>Prerequisites</td><td>Basic system administration knowledge</td></tr></tbody></table>

### Course Outline

<table><thead><tr><th width="116.800048828125">Session</th><th>Topic</th></tr></thead><tbody><tr><td>1</td><td><a href="#session-1-understanding-data-types">Understanding Data Types</a></td></tr><tr><td>2</td><td><a href="#session-2-using-target-discovery">Using Target Discovery</a></td></tr><tr><td>3</td><td><a href="#session-3-how-scans-work">How Scans Work</a></td></tr><tr><td>4</td><td><a href="#session-4-results-and-dashboard">Results &#x26; Dashboard</a></td></tr><tr><td>5</td><td><a href="#session-5-investigation-and-remediation">Investigation &#x26; Remediation</a></td></tr></tbody></table>

### Session 1: Understanding Data Types

Data Types define how GuardWare identifies and classifies sensitive information throughout the platform.

They provide the classification engine used by:

* GuardWare DISCOVER
* GuardWare INSIGHT
* GuardWare PROTECT

Rather than identifying files based only on names or locations, GuardWare analyses file contents to determine whether information matches defined Data Types.

**This session explains:**

* What Data Types are
* How classification works
* Built-in and custom Data Types
* How Data Types are used throughout the GuardWare platform
* Managing Data Types from the Management Console

{% embed url="<https://youtu.be/E1U7Qky-ykA?si=tGD2hM8Es2e6IvdD>" %}

### Session 2: Using Target Discovery

Before files can be scanned, GuardWare DISCOVER must know where sensitive information is stored.

Target Discovery allows administrators to define the locations that should be scanned instead of scanning the entire environment.

**This session covers:**

* Adding devices as scan targets
* Selecting agents
* Configuring connection protocols
* Adding cloud services
* Authentication options for Microsoft 365
* Authentication options for Google Workspace
* Managing discovery jobs
* Rediscovering targets

{% embed url="<https://youtu.be/5qdIyLEKa4A?si=dMZW1Xv9A9ZklJEl>" %}

### Session 3: How Scans Work

Once discovery targets have been configured, GuardWare DISCOVER scans those locations to locate sensitive information.

Scans identify files matching configured Data Types and generate findings for review.

**This session covers:**

* Purpose of scans
* Scan configuration
* Running scans
* Scan types
* Reviewing scan progress
* Understanding scan outputs

{% embed url="<https://youtu.be/Bc_AQw5nzc0?si=NKI6Fw1CXhSzhxv2>" %}

### Session 4: Results & Dashboard

After a scan completes, GuardWare DISCOVER provides detailed information about detected sensitive data.

Participants learn how to review findings and monitor trends across the environment.

**This session covers:**

* Navigating the Results page
* Reviewing findings
* Marking findings as Important
* Marking findings as Not Important
* Sending files for investigation
* Monitoring scan activity
* Reviewing Summary Reports

{% embed url="<https://youtu.be/T_hVc20zOKU?si=UrEcQSA3DjtPl3fr>" %}

### Session 5: Investigation and Remediation

After reviewing scan results, administrators may need to investigate findings before taking remediation actions.

DISCOVER provides investigation workflows together with remediation capabilities to reduce data exposure.

**This session covers:**

* Investigation Password
* Secure Location
* Creating investigations
* Reviewing findings
* Adding comments
* Remediation actions
* Remediation history

{% embed url="<https://youtu.be/RglZZHeibrA?si=UOaQBc6GcsdXCr6h>" %}

### Closing remarks

You can now configure and use GuardWare DISCOVER across its core workflows.

Apply these skills by defining Data Types, configuring targets, and reviewing scan findings. Investigate and remediate sensitive data to reduce exposure.

Continue with GuardWare INSIGHT to monitor sensitive data movement. Use GuardWare PROTECT to enforce controls around that data.


# GuardWare INSIGHT Video Guide

Learn GuardWare INSIGHT through structured video tutorials.

GuardWare INSIGHT provides visibility into how sensitive information is accessed, used and moved across Microsoft 365, endpoints, email, web applications, removable media, printing and AI tools.

The purpose of this training is to teach participants how to:

* Understand the role of INSIGHT within GuardWare’s data-centric security platform.
* Recognise the data movement activities monitored by INSIGHT.
* Navigate the INSIGHT management environment.
* Deploy and validate endpoint and Microsoft 365 monitoring.
* Review and investigate data-handling events.
* Configure monitoring rules, alerts and appropriate responses.
* Identify shadow AI and sensitive information entered into AI tools.
* Use contextual user education to improve employee behaviour.
* Establish an ongoing operational monitoring and reporting process.

INSIGHT is designed to work alongside existing security and DLP investments by addressing visibility gaps across channels including endpoints, AI tools, personal cloud services, remote-working environments and shadow IT.

### Course Information

<table data-header-hidden><thead><tr><th width="163.20001220703125">Field</th><th>Value</th></tr></thead><tbody><tr><td>Duration</td><td>1 hour</td></tr><tr><td>Format</td><td>Self-paced video tutorials</td></tr><tr><td>Skill level</td><td>Beginner to Intermediate</td></tr><tr><td>Prerequisites</td><td>Basic system administration knowledge</td></tr></tbody></table>

### Course Outline

<table><thead><tr><th width="116.800048828125">Session</th><th>Topic</th></tr></thead><tbody><tr><td>1</td><td><a href="#session-1-creating-user-policies">Creating User Policies</a></td></tr><tr><td>2</td><td><a href="#session-2-configuring-advanced-settings">Configuring Advanced Settings</a></td></tr><tr><td>3</td><td><a href="#session-3-understanding-risk-definitions">Understanding Risk Definitions</a></td></tr><tr><td>4</td><td><a href="#session-4-organisation-settings">Organisation Settings</a></td></tr><tr><td>5</td><td><a href="#session-5-setting-up-cloud-monitor">Setting up Cloud Monitor</a></td></tr><tr><td>6</td><td><a href="#session-6-insight-devices">INSIGHT Devices</a></td></tr><tr><td>7</td><td><a href="#session-7-insight-dashboard">INSIGHT Dashboard</a></td></tr><tr><td>8</td><td><a href="#session-8-configuring-insight-reports">Configuring INSIGHT Reports</a></td></tr></tbody></table>

### Session 1: Creating User Policies

User Policies define how GuardWare INSIGHT monitors, alerts on, and controls user activity involving sensitive information. They allow organisations to apply different monitoring and protection settings to different users or groups based on their roles, risk levels, and business requirements.

**This session explains:**

* What User Policies are
* Creating a User Policy and importing settings from an existing policy
* Configuring application, website, USB, and network monitoring
* Enabling archive file scanning, OCR detection, and document and email classification
* Adding Data Types with **Block**, **Monitor**, and **Warn** actions
* Assigning policies to users and Security Groups
* Viewing, editing, and deleting User Policies

{% embed url="<https://youtu.be/dB8_RXfGDXU?si=t6UxLnSRl13VZ2ni>" %}

### Session 2: Configuring Advanced Settings

Advanced Settings define the global monitoring configuration that controls how GuardWare INSIGHT captures user activity and monitors the movement of sensitive information across endpoints. They provide organisation-wide settings that complement User Policies and ensure consistent monitoring behaviour across managed devices.

**This session explains:**

* What Advanced Settings are
* Creating an Advanced Setting, including copying an existing configuration and setting a default policy
* Configuring environment, browser, USB, file system, and client responsiveness settings
* Managing monitored and excluded applications, websites, IP addresses, and file extensions
* Configuring Chromium extension monitoring, keystroke monitoring, copy and paste monitoring, and encrypted website monitoring
* Assigning Advanced Settings to devices
* Viewing, editing, and deleting Advanced Settings

{% embed url="<https://youtu.be/jBxExdxOQSM?si=txNDVuFIBAoIboB9>" %}

### Session 3: Understanding Risk Definitions

Risk Definitions determine how GuardWare INSIGHT assesses and categorises the severity of user activity across the organisation. They help organisations prioritise potentially risky activities across areas such as SharePoint, email, storage devices, printing, and AI tool usage.

GuardWare INSIGHT uses these risk levels to automatically score activities, helping organisations prioritise incidents that require attention without having to manually review every event.

**This session explains:**

* Understanding the six risk levels, from **No Risk** through **Highest**
* Reviewing the thirteen activity categories, including SharePoint External, SharePoint Internal, Email, Storage Device Risk, Printing Incidents, Keystroke Capture, Copy Paste, and Usage of AI Tools
* Navigating each category's submenu to review the specific activities and their assigned risk levels
* Changing default risk levels to match your organisation's requirements
* Saving updated Risk Definitions and understanding how the changes are reflected in the **Incident Risks** dashboard

{% embed url="<https://youtu.be/jF3PeOiZMpw?si=wmhDaDXsgxptDZ63>" %}

### Session 4: Organisation Settings

Organisation Settings define how GuardWare INSIGHT classifies and manages resources across the organisation, including websites, applications, printers, USB devices, email domains, AI tools, and SharePoint resources. These classifications help INSIGHT accurately interpret user activity and apply the appropriate monitoring and risk evaluation.

**This session explains:**

* Configuring **Working Days**, the setting that is configured directly rather than populated through user activity
* Understanding how **Printers, Websites, Applications, USBs, AI Usages, and SharePoint** are populated automatically as users interact with them, and how to classify these resources
* Classifying **Email Domains** as Organisational, Insecure, or Undefined
* Manually classifying **AI Websites and AI Applications**, as AI tools are not detected automatically
* Marking **SharePoint libraries** as Sensitive or Undefined
* Adding and removing **Trusted Emails and OneDrive Folders**, which are configured directly rather than populated through user activity

GuardWare INSIGHT uses these classifications to improve monitoring accuracy, reporting, and risk evaluation across the organisation.

{% embed url="<https://youtu.be/0KMlG5VPuiw?si=m6cVPKaBSx0GZjvx>" %}

#### Session 5: Setting up Cloud Monitor

Cloud Monitor enables GuardWare INSIGHT to monitor user activity and data movement across Microsoft 365 and Google Workspace environments. It provides visibility into cloud-based services such as email, file storage, and collaboration platforms, helping organisations extend monitoring beyond endpoint devices.

**This session explains:**

* Connecting **Microsoft 365** using a **Global Administrator** account, which is required for Cloud Monitor functionality
* Connecting **Google Workspace**, including the prerequisite configuration of a Google Service Account
* Enabling monitoring for **Exchange**, **SharePoint**, **Gmail**, and **Google Drive**
* Assigning users for **Exchange** and **Gmail** monitoring
* Performing manual synchronisation of Microsoft 365 data
* Assigning **Data Types** to define what Cloud Monitor monitors within SharePoint
* Understanding where Exchange, Gmail, SharePoint, and Google Drive activities are displayed within the INSIGHT dashboard

Cloud Monitor provides centralised visibility into cloud activity, helping organisations monitor sensitive information, identify risky behaviour, and investigate incidents across their Microsoft 365 and Google Workspace environments.

{% embed url="<https://youtu.be/YmFjlqtOHEk?si=VonEb-_Yqy1iwxhC>" %}

#### Session 6: INSIGHT Devices

INSIGHT Devices provides a centralised view of all endpoints running the GuardWare INSIGHT Agent. It enables administrators to monitor device status, manage endpoint configurations, and perform administrative actions directly from the Management Console.

**This session explains:**

* Viewing device status and inventory information, including hardware details, installed software, and agent versions
* Assigning **Advanced Settings** to control device monitoring behaviour and policies
* Sending endpoint commands, including **Update Client** and **Uninstall Client**
* Managing device logs through **Maintenance Mode**, including enabling logging, disabling logging, and retrieving log files
* Viewing detailed device and agent information from the Management Console
* Updating or uninstalling the INSIGHT Agent directly from the device management interface

INSIGHT Devices gives administrators complete visibility and control over monitored endpoints, helping ensure consistent policy enforcement, efficient troubleshooting, and effective device management across the organisation.

{% embed url="<https://youtu.be/0huzgLlQ7XY?si=0PK9zSg-n8yaGbAL>" %}

#### Session 7: INSIGHT Dashboard

The INSIGHT Dashboard provides a centralised view of user activity, data movement, and risk across the organisation. By bringing together endpoint, cloud, and behavioural monitoring data, it helps administrators and security teams identify unusual activity, investigate incidents, and gain actionable insights from a single interface.

**This session explains:**

* Navigating the risk category tabs: **Risk Summary**, **Data Type Risks**, **SharePoint Risks**, **AI Usage Risks**, **Behaviour Risks**, **Label Events**, **Location Risks**, **Protected Files**, and **System Risks**
* Understanding dashboard widgets, from high-level summary views to detailed incident records
* Interpreting colour-coded risk levels and their relationship to configured **Risk Definitions**
* Exporting dashboard data to **Excel** or **PDF** for reporting and analysis
* Creating **Custom Dashboards** focused on specific devices, users, data types, or risk categories
* Viewing, editing, deleting, and switching between dashboards

The INSIGHT Dashboard transforms monitoring data into meaningful insights, enabling organisations to quickly identify risks, investigate incidents, and make informed security decisions.

{% embed url="<https://youtu.be/5smUdy_ckuU?si=x4nDblwk8RuNj4Y9>" %}

#### Session 8: Configuring INSIGHT Reports

Reports in GuardWare INSIGHT deliver risk and activity information to the right stakeholders automatically, reducing the need for manual dashboard reviews. They help security teams, managers, and end users stay informed about risky behaviour through scheduled and customised reporting.

**This session explains:**

* Configuring the **Risk Summary Report**, which provides an organisation-wide overview of risky activities for security teams
* Configuring the **User-Based Risk Report**, designed to track risk trends and incident activity for specific users
* Configuring the **Cyber Awareness Report**, which is sent directly to end users with information and guidance related to their own activities
* Setting **Incident Thresholds**, **Data Type Occurrence Thresholds**, and **Duration Thresholds** to determine when reports are generated
* Customising report branding and content, including cover images, introductory messages, footers, and privacy statements
* Sending test emails to preview report content before deployment
* Enabling, editing, and deleting report configurations

INSIGHT Reports ensure that critical risk information is delivered automatically and consistently, helping organisations improve visibility, strengthen security awareness, and support proactive risk management.

{% embed url="<https://youtu.be/IZZkqrAmNYs?si=qQjlPaugGCCAVr2K>" %}


# GuardWare PROTECT Video Guide

Learn GuardWare PROTECT through structured video tutorials.

{% hint style="warning" icon="bullhorn" %}

### Coming soon

Self-paced training for PROTECT is in development. Course details and videos will be available here soon.
{% endhint %}


# GuardWare Partner Portal Video Guide

Learn Partner Portal through structured video tutorials.

{% hint style="warning" icon="bullhorn" %}

### Coming soon

Self-paced training for the partner portal is in development. Course details and videos will be available here soon.
{% endhint %}


# GuardWare DISCOVER Training

Live DISCOVER instructor-led training.

Join a live DISCOVER session with a GuardWare instructor. The course includes demonstrations and interactive Q\&A.

<a class="button primary" data-icon="calendar-check">Register for Training</a>

### Upcoming Sessions

<table><thead><tr><th width="107.2000732421875">Session no.</th><th width="213.5999755859375">Session Title</th><th>Duration</th><th width="127.20001220703125">Date</th><th width="135.99993896484375">Time and Timezone</th><th>Status</th></tr></thead><tbody><tr><td>Session 1</td><td>Product Overview and Configure the Scanning Server and M365</td><td>30 minutes</td><td>Coming Soon</td><td>Coming Soon</td><td>Coming Soon</td></tr><tr><td>Session 2</td><td>Data Governance</td><td>30 minutes</td><td>Coming Soon</td><td>Coming Soon</td><td>Coming Soon</td></tr><tr><td>Session 3</td><td>Target Discovery &#x26; Scanning</td><td>1 hour</td><td>Coming Soon</td><td>Coming Soon</td><td>Coming Soon</td></tr><tr><td>Session 4</td><td>Results, Dashboard, Investigation &#x26; Remediation</td><td>1 hour</td><td>Coming Soon</td><td>Coming Soon</td><td>Coming Soon</td></tr></tbody></table>

### Meet your trainers

{% columns %}
{% column width="50%" %}

<div align="left" data-with-frame="true"><figure><img src="https://2177129992-files.gitbook.io/~/files/v0/b/gitbook-x-prod.appspot.com/o/spaces%2FLj7fMs4oYefCLpN07V3S%2Fuploads%2FbO6k0XijM4DeHWinf5J2%2FRushmi%20Profile%20photo%20square.png?alt=media&amp;token=07aee581-e6f4-452f-899f-fd40caa4e4b8" alt="" width="200"><figcaption></figcaption></figure></div>

**Rushmi Bhuju**

**Senior Technical Writer /**&#x20;

**Knowledge Engineer**
{% endcolumn %}

{% column width="50%" %}

<div align="left" data-with-frame="true"><figure><img src="https://2177129992-files.gitbook.io/~/files/v0/b/gitbook-x-prod.appspot.com/o/spaces%2FLj7fMs4oYefCLpN07V3S%2Fuploads%2FHCxntdZ4lMY8Qz5FPM1g%2FGrishm%20pp%20new.jpg?alt=media&amp;token=1089a7e9-2096-4f1d-b91b-c0226d5e1475" alt="" width="213"><figcaption></figcaption></figure></div>

**Grishm Devkota**

**Technical Writer /**&#x20;

**Knowledge Engineer**
{% endcolumn %}
{% endcolumns %}

### Training Overview

GuardWare DISCOVER enables organisations to locate, classify, investigate, and remediate sensitive information across on-premises and cloud environments.

DISCOVER forms the first stage of GuardWare's data-centric security platform by identifying where sensitive information resides before monitoring its movement with INSIGHT or protecting it with PROTECT.

### Learning outcomes

After completing this training, participants can:

* Identify sensitive information using Data Types.
* Configure discovery targets across on-premises and cloud environments.
* Run data discovery scans and review their results.
* Investigate sensitive findings and apply remediation actions.
* Monitor discovery activity through reports and dashboards.

### Course Information

<table><thead><tr><th width="156">Field</th><th>Value</th></tr></thead><tbody><tr><td>Duration</td><td>3 hours</td></tr><tr><td>Format</td><td>Instructor-led live training</td></tr><tr><td>Audience</td><td>Customers, Partners, Administrators</td></tr><tr><td>Prerequisites</td><td>Basic system administration knowledge</td></tr></tbody></table>

### Session 1: Product Overview and Understanding Data Governance

**Duration: 30 Minutes**

This session introduces GuardWare DISCOVER and its role in identifying sensitive information across on-premises and cloud environments. Participants will learn how GuardWare integrates with Microsoft 365, deploy the Scanning Server, and prepare the environment for data discovery.

**Topics covered:**

* DISCOVER overview
* How to integrate with Microsoft 365
* How to download the agent
* How to configure the Scanning Server

### Session 2: Data Governance

**Duration: 30 Minutes**

This session focuses on classifying sensitive information using Data Types. Participants will learn how to create and manage custom Data Types, synchronise Microsoft Purview classifications, define data owners, and apply ownership to improve data governance.

**Topics covered:**

* What are built-in data types
* How to create a custom data type with **Sensitive Words**
* How to create a custom data type with **Regular Expressions**
* How to create a custom data type with **Filename Expressions**
* How to sync Purview classifications
* How to create a data owner
* How to assign a data owner to a data type

### Session 3: Target Discovery and Scanning

**Duration: 1 Hour**

This session covers discovering data sources and scanning them for sensitive information. Participants will learn how to configure discovery targets, run and monitor scans, and review scan progress to ensure successful identification of sensitive data.

**Topics covered:**

* Configuring discovery targets
* Running and monitoring scans
* Reviewing scan outputs

### Session 4: Results, Dashboard, Investigation and Remediation

**Duration: 1 Hour**

This session demonstrates how to analyse scan results and take action to reduce data risk. Participants will learn how to review dashboards, investigate sensitive findings, apply remediation actions, and track remediation progress to strengthen their organisation's data security posture.

**Topics covered:**

* Reviewing results and dashboards
* Investigating sensitive findings
* Applying and tracking remediation actions


# GuardWare INSIGHT Training

Instructor-led INSIGHT training

Join a live INSIGHT session with a GuardWare instructor. The course includes demonstrations and interactive Q\&A.

### Training Sessions

<table><thead><tr><th width="107.2000732421875">Session no.</th><th width="213.5999755859375">Session Title</th><th>Duration</th><th width="127.20001220703125">Date</th><th width="132.79998779296875">Time and Timezone</th><th>Trainer</th><th width="144">Status</th></tr></thead><tbody><tr><td>Session 1</td><td><a href="#session-1-product-overview-data-governance-configuring-agents-cloud-monitor-and-organisation-setting">Product Overview and Data Governance, Configure Agents, Cloud Monitor, and Organisation Settings</a></td><td>1 hour 15 minutes</td><td>8 Sept 2026</td><td><p>2:00 PM – 3:15 PM (AEST) /</p><p>9:45 AM – 11:00 AM (NPT) /</p><p>9:30 AM – 10:45 AM (IST)</p></td><td>Rushmi Bhuju</td><td><mark style="color:$success;"><strong><code>Completed</code></strong></mark></td></tr><tr><td>Session 2</td><td><a href="#session-2-configure-user-policy">Configure Risk Levels and User Policy</a></td><td>1 hour 15 minutes</td><td>9 Sept 2026</td><td><p>2:00 PM – 3:15 PM (AEST) /</p><p>9:45 AM – 11:00 AM (NPT) /</p><p>9:30 AM – 10:45 AM (IST)</p></td><td>Rushmi Bhuju</td><td><mark style="color:$success;"><strong><code>Completed</code></strong></mark></td></tr><tr><td>Session 3</td><td><a href="#session-3-configure-advanced-policy-and-devices">Configure Advanced Policy and Devices</a></td><td>1 hour 15 minutes</td><td>10 Sept 2026</td><td><p>2:00 PM – 3:15 PM (AEST) /</p><p>9:45 AM – 11:00 AM (NPT) /</p><p>9:30 AM – 10:45 AM (IST)</p></td><td>Rushmi Bhuju</td><td><mark style="color:$success;"><strong><code>Completed</code></strong></mark></td></tr><tr><td>Session 4</td><td><a href="#session-4-configure-reports-and-review-dashboard">Configure Reports and Dashboard</a></td><td>1 hour 15 minutes</td><td>11 Sept 2026</td><td><p>2:00 PM – 3:15 PM (AEST) /</p><p>9:45 AM – 11:00 AM (NPT) /</p><p>9:30 AM – 10:45 AM (IST)</p></td><td>Rushmi Bhuju</td><td><mark style="color:$success;"><strong><code>Completed</code></strong></mark></td></tr></tbody></table>

<details>

<summary>Past sessions</summary>

| Session no. | Session Title                                                                                      | Duration          | Date        | Time and Timezone                                    | Trainer      | Status                           |
| ----------- | -------------------------------------------------------------------------------------------------- | ----------------- | ----------- | ---------------------------------------------------- | ------------ | -------------------------------- |
| Session 1   | Product Overview and Data Governance, , Configure Agents, Cloud Monitor, and Organisation Settings | 1 hour 15 minutes | 18 Aug 2026 | 3:15 PM – 4:30 PM (AEST) / 11:00 AM – 12:15 PM (NPT) | Rushmi Bhuju | Completed for internal employees |
| Session 2   | Configure Risk Definition and User Policy                                                          | 1 hour            | 19 Aug 2026 | 6:15 PM – 7:15 PM (AEST) / 2:00 PM – 3:00 PM (NPT)   | Rushmi Bhuju | Completed for internal employees |
| Session 3   | Configure Advanced Policy and Devices                                                              | 1 hour            | 20 Aug 2026 | 3:15 PM – 4:15 PM (AEST) / 11:00 AM – 12:00 PM (NPT) | Rushmi Bhuju | Completed for internal employees |
| Session 4   | Configure Reports and Dashboard                                                                    | 1 hour 15 minutes | 21 Aug 2026 | 3:15 PM – 4:30 PM (AEST) / 11:00 AM – 12:15 PM (NPT) | Rushmi Bhuju | Completed for internal employees |

</details>

### Meet your trainers

{% columns %}
{% column width="50%" %}

<div align="left" data-with-frame="true"><figure><img src="https://2177129992-files.gitbook.io/~/files/v0/b/gitbook-x-prod.appspot.com/o/spaces%2FLj7fMs4oYefCLpN07V3S%2Fuploads%2FbO6k0XijM4DeHWinf5J2%2FRushmi%20Profile%20photo%20square.png?alt=media&amp;token=07aee581-e6f4-452f-899f-fd40caa4e4b8" alt="" width="200"><figcaption></figcaption></figure></div>

**Rushmi Bhuju**

**Senior Technical Writer /**

**Knowledge Engineer**
{% endcolumn %}

{% column width="50%" %}

<div align="left" data-with-frame="true"><figure><img src="https://2177129992-files.gitbook.io/~/files/v0/b/gitbook-x-prod.appspot.com/o/spaces%2FLj7fMs4oYefCLpN07V3S%2Fuploads%2FHCxntdZ4lMY8Qz5FPM1g%2FGrishm%20pp%20new.jpg?alt=media&amp;token=1089a7e9-2096-4f1d-b91b-c0226d5e1475" alt="" width="213"><figcaption></figcaption></figure></div>

**Grishm Devkota**

**Technical Writer /**

**Knowledge Engineer**
{% endcolumn %}
{% endcolumns %}

### Training Overview

GuardWare INSIGHT provides visibility into how sensitive information is accessed, used and moved across Microsoft 365, endpoints, email, web applications, removable media, printing and AI tools.

INSIGHT is designed to work alongside existing security and DLP investments by addressing visibility gaps across channels including endpoints, AI tools, personal cloud services, remote-working environments and shadow IT.

### Learning outcomes

After completing this training, participants can:

* Understand INSIGHT’s role within GuardWare’s data-centric security platform.
* Recognise data movement activities monitored by INSIGHT.
* Deploy and validate endpoint and Microsoft 365 monitoring.
* Investigate data-handling events using the management environment.
* Configure monitoring rules, alerts, and user policies.
* Identify shadow AI and sensitive information entered into AI tools.
* Use contextual user education to improve employee behaviour.
* Establish an operational monitoring and reporting process.

### Course Information

<table><thead><tr><th width="156">Field</th><th>Value</th></tr></thead><tbody><tr><td>Duration</td><td>5 hours</td></tr><tr><td>Format</td><td>Instructor-led live training</td></tr><tr><td>Audience</td><td>Customers, Partners</td></tr><tr><td>Prerequisites</td><td>Basic system administration knowledge</td></tr></tbody></table>

### Course Structure

### Session 1: Product Overview, Data Governance, Configure Agents, Cloud Monitor, and Organisation Settings

**Duration: 1 Hour 15 Minutes**

This session introduces GuardWare INSIGHT and explains how it helps organisations gain visibility into sensitive data activity across endpoints, Microsoft 365, email, web applications, removable media, and AI tools. This session also focuses on deploying and configuring INSIGHT for monitoring. Participants will learn how data types and classifications work, how they are used throughout the GuardWare platform, how to deploy the INSIGHT Agent, connect Microsoft 365, configure Cloud Monitor for Exchange and SharePoint, configure organisation settings, and verify that monitored devices are reporting correctly.

**Topics covered:**

* INSIGHT Overview
* What Data Types are
* How classification works
* Built-in and custom Data Types
* How to configure and deploy the INSIGHT Agent
* How to connect Microsoft 365
* How to configure Cloud Monitor
  * Exchange monitoring
  * SharePoint monitoring
* How devices appear in INSIGHT
* How to configure Organisation Settings

### Session 2: Configure Risk Levels and User Policy

**Duration: 1 Hour 15 Minutes**

This session covers security groups, defining risk levels, and creating and managing user policies to monitor and control data-handling activities. Participants will learn how to define risk levels, configure user policies, assign them to users, and apply monitoring based on organisational security requirements.

**Topics covered:**

* What are Security Groups
* How to define risk levels
* How to create a user policy
* How to assign a user policy to users

### Session 3: Configure Advanced Policy and Devices

**Duration: 1 Hour 15 Minutes**

This session explores advanced policy configuration and endpoint management. Participants will learn how to configure advanced monitoring settings, assign policies to devices, send management commands, and perform agent maintenance tasks such as updates and uninstallation.

**Topics covered:**

* How to configure Advanced Settings
* How to assign advanced settings to devices
* How to assign commands to devices
* How to update or uninstall the agent from devices

### Session 4: Configure Reports and Review Dashboard

**Duration: 1 Hour 15 Minutes**

This session demonstrates how to monitor user activity and analyse security events using INSIGHT's reporting and dashboard features. Participants will learn how to configure reports, review dashboard metrics, investigate incidents, and use reporting to support ongoing security monitoring and user awareness initiatives.

**Topics covered:**

* How to configure Cyber Awareness Report
* How to configure User-based Report
* How to configure Risk Summary Report
* How to review dashboard data and drill into incidents
* How to create a custom dashboard


# GuardWare PROTECT Training

Live PROTECT instructor-led training.

{% hint style="warning" icon="bullhorn" %}

### Coming soon

Instructor-led PROTECT training is in development. Session dates and registration will be available here soon.
{% endhint %}


# Documentation

The Documentation section contains the user guides for the GuardWare products. It provides detailed information about the features, configuration options, and day-to-day tasks available to administrators and users.

The documentation is organised around the different areas of the GuardWare platform, including the **Management Console, Partner Portal, DISCOVER, INSIGHT, and PROTECT**.

Choose a product guide below to get started.

## How the Documentation is organised

### GuardWare Product Documentation

The product guides provide detailed information about using the individual GuardWare products. Start with the product that matches your immediate data-security goal.

**DISCOVER** identifies sensitive data and where it resides. **INSIGHT** reveals how that data is used and where risk exists. **PROTECT** applies controls to safeguard sensitive data. Together, these products support a continuous data-security lifecycle.

<table data-view="cards"><thead><tr><th align="center"></th><th></th><th data-hidden data-card-cover data-type="image">Cover image</th><th data-hidden data-card-target data-type="content-ref"></th></tr></thead><tbody><tr><td align="center"><h3><strong>DISCOVER</strong></h3></td><td>Identify and manage sensitive data across your environment with full visibility into where it lives.</td><td data-object-fit="contain"><a href="https://1214861324-files.gitbook.io/~/files/v0/b/gitbook-x-prod.appspot.com/o/spaces%2FWHg7kTBweFh3f0onuEMT%2Fuploads%2FnJSDafz03nZXJPSzx1hq%2FDiscover-shield.png?alt=media&amp;token=8dd9c553-5a41-4c06-9938-c16df281c061">Discover-shield.png</a></td><td><a href="https://docs.guardware.com/documentation/discover/">DISCOVER</a></td></tr><tr><td align="center"><h3><strong>INSIGHT</strong></h3></td><td>Gain clear, actionable visibility into data usage, risk, and user behaviour.</td><td data-object-fit="contain"><a href="https://1214861324-files.gitbook.io/~/files/v0/b/gitbook-x-prod.appspot.com/o/spaces%2FWHg7kTBweFh3f0onuEMT%2Fuploads%2FEaFxUplsKlVzaDEvS1ET%2Finsight-shield.png?alt=media&amp;token=ae127f44-9847-4aef-aa42-7f1c251299b6">insight-shield.png</a></td><td><a href="https://docs.guardware.com/documentation/insight/">INSIGHT v5</a></td></tr><tr><td align="center"><h3><strong>PROTECT</strong></h3></td><td>Protect sensitive data with policy-driven encryption and access controls.</td><td data-object-fit="contain"><a href="https://1214861324-files.gitbook.io/~/files/v0/b/gitbook-x-prod.appspot.com/o/spaces%2FWHg7kTBweFh3f0onuEMT%2Fuploads%2FIypp5HiQ579HsKDd5C80%2Fprotect-shield.png?alt=media&amp;token=1126892b-19a8-4e47-b204-53b5d18e76e1">protect-shield.png</a></td><td><a href="https://docs.guardware.com/documentation/protect/">PROTECT</a></td></tr></tbody></table>

### Partner Portal

If you are a partner, use the **Partner Portal** to manage customer organisations and deployments.

The **Partner Portal** is intended for GuardWare partners who manage multiple customer organisations. It provides partner-level functionality for managing customer environments and related administrative tasks.

The Partner Portal documentation explains how partners can manage their customer organisations and perform tasks available at the partner level.

<table data-view="cards"><thead><tr><th></th><th></th><th data-hidden data-card-cover data-type="image">Cover image</th><th data-hidden data-card-target data-type="content-ref"></th></tr></thead><tbody><tr><td><h3><strong>PARTNER PORTAL</strong></h3></td><td>Manage customer organisations, deployments, and administration from a single place.</td><td data-object-fit="contain"><a href="https://1214861324-files.gitbook.io/~/files/v0/b/gitbook-x-prod.appspot.com/o/spaces%2FWHg7kTBweFh3f0onuEMT%2Fuploads%2FSUNjoRKqcpMStysUOs6S%2FGuardware-ShieldOnly-4096x.png?alt=media&amp;token=ed50df34-fe37-44ed-9ace-1d656479440b">Guardware-ShieldOnly-4096x.png</a></td><td><a href="https://docs.guardware.com/documentation/partner-portal/">Partner Portal</a></td></tr></tbody></table>

## Management Console

The **Management Console** is GuardWare’s central administration layer. It provides access to organisation-level settings and administration features for configuring and managing the GuardWare environment.

The Management Console documentation covers tasks such as configuring organisation settings, managing users and access, configuring integrations and system settings, and managing the components used by GuardWare products.

If you are administering a specific GuardWare organisation, the **Management Console** guides provide the information you need to configure and manage that environment. Use them to configure your organisation, data-governance model, security groups, and integrations.

<table data-view="cards"><thead><tr><th></th><th></th><th data-hidden data-card-target data-type="content-ref"></th></tr></thead><tbody><tr><td><h4><i class="fa-sitemap">:sitemap:</i></h4></td><td><strong>Organisation</strong><br>Manage organisation settings, administrators, and user access.<br>Configure the foundation for your GuardWare environment.</td><td><a href="/documentation/management-console/organisation-setup/management-console-users">Organisation setup</a></td></tr><tr><td><h4><i class="fa-database">:database:</i></h4></td><td><strong>Data Governance</strong><br>Define data types, classifications, and ownership.<br>Apply a consistent model for identifying and managing sensitive data.</td><td><a href="/documentation/management-console/data-governance/data-classification">DATA GOVERNANCE</a></td></tr><tr><td><h4><i class="fa-users">:users:</i></h4></td><td><strong>Security Groups</strong><br>Create security groups and manage their members.<br>Use groups to apply consistent access controls across your organisation.</td><td><a href="/documentation/management-console/security-group/security-group">SECURITY GROUP</a></td></tr><tr><td><h4><i class="fa-plug">:plug:</i></h4></td><td><strong>Integration</strong><br>Connect GuardWare with your identity, security, and business tools.<br>Configure integrations that extend workflows and share relevant data.</td><td><a href="/documentation/management-console/integrations/microsoft-365">integrations</a></td></tr></tbody></table>


# Introduction to DISCOVER

GuardWare DISCOVER is a cross-platform system designed to identify, classify, and manage sensitive data across enterprise environments. It operates across endpoints, file servers, email systems, and cloud services, helping organisations detect and reduce exposure of regulated and sensitive information like PCI, PII, PHI, as well as custom data types.

At its core, DISCOVER is built around a centralised model of control and distributed execution. This allows it to scale across diverse infrastructures, from closed-off, high-security networks to fully cloud-native environments, while maintaining a single point of visibility and administration.

## System Architecture

GuardWare DISCOVER uses a centralised management architecture with distributed scanning components. The Management Console coordinates scan activity, while Scanning Agents execute scan and remediation tasks on assigned systems and services assigned to them.

{% columns fullWidth="false" %}
{% column width="33.33333333333333%" %}
{% hint style="info" icon="1" %}
**Management Console**\
\
The central web application where scan jobs are scheduled, configurations are stored, and results are reviewed. It can be hosted on-premises or in the cloud.
{% endhint %}
{% endcolumn %}

{% column width="33.33333333333333%" %}
{% hint style="info" icon="2" %}
**Scanning Server**\
\
A Windows system running the Scanning Agent that has been assigned to perform remote scanning on behalf of other systems.
{% endhint %}
{% endcolumn %}

{% column %}
{% hint style="info" icon="3" %}
**Targets**\
\
The systems and services scanned by GuardWare DISCOVER. Targets can include endpoints, file servers, and cloud-based services such as Exchange Online, SharePoint Online, Gmail, and Google Drive.
{% endhint %}
{% endcolumn %}
{% endcolumns %}

## Deployment Models

GuardWare DISCOVER supports both on-premises and cloud deployments. Each deployment model supports Local Scanning, Remote Scanning, or a combination of both.

{% hint style="info" %}
[**On-Premises Deployment**](#on-premises-deployment)

[**Cloud Deployment**](#cloud-deployment)
{% endhint %}

### On-Premises Deployment

The Management Console is hosted on a Windows Server within the organisation's network. This deployment model is typically used when outbound communication is restricted or prohibited, or when organisational policies require management infrastructure to remain on-site.

Depending on the organisation's requirements, scanning can be performed using one of the following architectures.

#### Local Scanning

In a Local Scanning architecture, the Scanning Agent is installed directly on each device to be scanned. Each system scans its own local storage and securely communicates scan results to the on-premises Management Console over HTTPS.

<figure><img src="https://4044942488-files.gitbook.io/~/files/v0/b/gitbook-x-prod.appspot.com/o/spaces%2FPtAo3ilfcIjmOhwnXZVf%2Fuploads%2Fm2sMbrIcLBqoUrw9OwgO%2Fimage.png?alt=media&amp;token=3b27c9bb-aae7-4bd4-b668-84217778492b" alt=""><figcaption></figcaption></figure>

This architecture is suitable when the Scanning Agent can be installed on all target systems and no remote device scanning is required.

#### Remote Scanning

In a Remote Scanning architecture, one or more Windows systems are designated as Scanning Servers. Each Scanning Server runs the Scanning Agent and performs scans on behalf of target systems that do not have the Scanning Agent installed.

<figure><img src="https://4044942488-files.gitbook.io/~/files/v0/b/gitbook-x-prod.appspot.com/o/spaces%2FPtAo3ilfcIjmOhwnXZVf%2Fuploads%2FBBbKzgIRjKkJrpYLiPza%2Fimage.png?alt=media&amp;token=5055e8a6-958e-40d0-adfe-4a71bc5ac3b0" alt=""><figcaption></figcaption></figure>

Scanning Servers may be deployed on physical servers, virtual machines, or other Windows systems with network connectivity to the target environment. Scanning Servers connect to supported targets using the appropriate protocol or service interface:

* Windows devices and SMB file servers are scanned remotely using SMB or WinRM.
* Linux and macOS systems are scanned remotely using SSH.
* Microsoft 365 services, including Exchange Online and SharePoint Online, are accessed through the Microsoft Graph API.
* Google Workspace services, including Gmail and Google Drive, are accessed through the appropriate Google Workspace REST APIs.

Communication between the Management Console and Scanning Servers occurs over HTTPS. Scan assignments, credentials, and configuration settings are managed centrally through the Management Console.

Supported cloud services are scanned remotely through a Scanning Server. It connects through Microsoft Graph or the Google Workspace REST APIs. Remotely scanned targets can be reassigned to another Scanning Server at any time.

### Cloud Deployment

The Management Console is hosted on a Windows Server running in a cloud environment. This deployment model provides centralised management without requiring the Management Console to reside within the organisation's internal network.

Depending on the organisation's requirements, scanning can be performed using Local Scanning, Remote Scanning, or a combination of both.

#### Local Scanning

In a Local Scanning architecture, the Scanning Agent is installed directly on each endpoint or file server to be scanned. Each system scans its own local storage and securely communicates scan results to the cloud-hosted Management Console over HTTPS.

<figure><img src="https://4044942488-files.gitbook.io/~/files/v0/b/gitbook-x-prod.appspot.com/o/spaces%2FPtAo3ilfcIjmOhwnXZVf%2Fuploads%2FXBrMv6og4VXQR4Ajg8O8%2Fimage.png?alt=media&amp;token=2bd88488-24d1-4432-bbcd-74dcf4e6c97b" alt=""><figcaption></figcaption></figure>

This architecture is suitable when the Scanning Agent can be installed on all target systems.

#### Remote Scanning

In a Remote Scanning architecture, one or more Windows systems are designated as Scanning Servers. Each Scanning Server runs the Scanning Agent and performs scans on behalf of target systems that do not have the Scanning Agent installed.

<figure><img src="https://4044942488-files.gitbook.io/~/files/v0/b/gitbook-x-prod.appspot.com/o/spaces%2FPtAo3ilfcIjmOhwnXZVf%2Fuploads%2FPW9xDJ9F83F66DNg8zcs%2Fimage.png?alt=media&amp;token=50110bed-5385-4ff9-92d0-4ee843c6013d" alt=""><figcaption></figcaption></figure>

Scanning Servers may be deployed on-premises, in the cloud, or in another suitable location with network connectivity to the target systems and services. They connect to supported targets using the appropriate protocol or service interface:

* Windows devices and SMB file servers are scanned remotely using SMB or WinRM.
* Linux and macOS systems are scanned remotely using SSH.
* Microsoft 365 services, including Exchange Online and SharePoint Online, are accessed through the Microsoft Graph API.
* Google Workspace services, including Gmail and Google Drive, are accessed through the appropriate Google Workspace REST APIs.

Communication between the Management Console and Scanning Servers occurs over HTTPS. Scan assignments, credentials, and configuration settings are managed centrally through the Management Console.

Supported cloud services are scanned remotely through a Scanning Server. It connects through Microsoft Graph or the Google Workspace REST APIs. Remotely scanned targets can be reassigned to another Scanning Server at any time.

## Deployment and Setup Flow

Deploying GuardWare DISCOVER involves installing the Management Console and then deploying one or more Scanning Agents to perform scan operations.

{% stepper %}
{% step %}

### Install the Management Console

The first step is installing the **Management Console** on a dedicated Windows server. This system becomes the central control point for all scanning activity, including configuration, scheduling, and reporting.
{% endstep %}

{% step %}

### Deploy the Scanning Agent

After the Management Console is operational, the next step is deploying the **Scanning Agent**. Depending on the chosen architecture, this may involve installing the Scanning Agent directly on endpoints for local scanning or installing the Scanning Agent on one or more Windows systems designated as Scanning Servers for Remote Scanning.

In both cases, the Scanning Agent acts as the execution layer that carries out scan tasks assigned by the Management Console.\
[**Scanning Agent Deployment Guide→**](/getting-started/install-discover-agent/install-discover-agent)
{% endstep %}

{% step %}

### Configure and Run Scans

This includes adding scan targets, configuring cloud service credentials where necessary, and assigning data owners where applicable. These configurations define what will be scanned and how they should be scanned.

Scan jobs can then be created and executed from the Management Console. Results are returned and displayed within the interface, allowing you to review findings, investigate files for sensitive data, and initiate remediation actions.\
[**DISCOVER Quick Start Guide →**](/documentation/discover/getting-started/discover-quick-start-guide)
{% endstep %}
{% endstepper %}

## Console Access and Operation

Familiarising administrators with the Management Console is essential, as all administrative and operational tasks are performed there. Access to the console requires valid administrator credentials. After authentication, users must complete a second layer of verification using a time-based authenticator application. This ensures that access to sensitive scan data and system controls is properly secured.

![](https://4044942488-files.gitbook.io/~/files/v0/b/gitbook-x-prod.appspot.com/o/spaces%2FPtAo3ilfcIjmOhwnXZVf%2Fuploads%2Fu87eUP3ufWB3Zpng2dd5%2FUnknown%20image?alt=media\&token=b2e5b965-ae9b-4d19-a236-c34443f08800)

Once logged in, the console provides a centralised view of all scan activity, including status, results, and historical reporting. From here, administrators can manage the full lifecycle of data discovery operations.


# DISCOVER Glossary

A quick reference for DISCOVER-specific terms.

<table><thead><tr><th width="204">Term</th><th>Definition</th></tr></thead><tbody><tr><td>Agent/Scanning Agent</td><td>The GuardWare DISCOVER software installed on an endpoint that scans and identifies sensitive data according to configured rules.</td></tr><tr><td>Agentless scan</td><td>A scan executed by the Scanning Server against a remote target over WinRM, SSH, or SMB. The scan target does not run any DISCOVER component.</td></tr><tr><td>Data classification</td><td>The process by which DISCOVER groups identified files or content into sensitive data categories.</td></tr><tr><td>Data owner</td><td>The individual accountable for a data type who receives notifications when DISCOVER detects that type of sensitive data.</td></tr><tr><td>Data types</td><td>Categories of sensitive information, predefined (e.g., PCI-DSS, PII, PHI) or user-defined, that DISCOVER scans for.</td></tr><tr><td>Device owner</td><td>The user or administrator responsible for a device that is being scanned or where sensitive data resides.</td></tr><tr><td>Management console</td><td>The central web platform for DISCOVER. Manages scan scheduling, configuration, reporting, and remediation. Runs on the Management Console host.</td></tr><tr><td>DISCOVER Scanning Agent</td><td>The Windows service that executes scan jobs assigned by the Management Console. Can be installed on each device for local scanning, or on a dedicated host or VM for agentless scanning.</td></tr><tr><td>File servers</td><td>File shares accessible over SMB, scanned by DISCOVER to detect sensitive data.</td></tr><tr><td>Internet Information Services (IIS)</td><td>Microsoft's web server platform, used to host the Management Console and its associated services.</td></tr><tr><td>Investigation</td><td>The process of reviewing files flagged during a scan to determine their sensitivity and decide on appropriate action.</td></tr><tr><td>Local scan</td><td>A scan executed by the Scanning Server on the same device it is installed on.</td></tr><tr><td>Management Console host</td><td>The Windows machine on which the DISCOVER Management Console is installed and runs. Can be distinct from the Scanning Server host.</td></tr><tr><td>Microsoft Azure</td><td>Microsoft's cloud platform. DISCOVER uses it to scan Azure-based services such as Exchange Online and SharePoint Online.</td></tr><tr><td>Microsoft Entra ID</td><td>Microsoft's cloud-based identity and access management service (previously Azure AD). Used to authenticate DISCOVER's access to Microsoft 365 services.</td></tr><tr><td>Microsoft Exchange</td><td>Microsoft's email and calendaring platform, available on-premises or as Exchange Online.</td></tr><tr><td>Microsoft Graph API</td><td>A unified RESTful API used by DISCOVER to access and scan Microsoft 365 data sources, including Exchange Online and SharePoint Online, using OAuth 2.0.</td></tr><tr><td>Microsoft Intune</td><td>Microsoft's endpoint and mobile device management service. Can be used to deploy the remote access configuration scripts to target devices.</td></tr><tr><td>Microsoft SharePoint</td><td>Microsoft's collaboration and content management platform. SharePoint Online can be scanned by DISCOVER via the Microsoft Graph API.</td></tr><tr><td>OAuth 2.0 authentication</td><td>The authorisation framework used by DISCOVER to securely access Microsoft 365 cloud services via the Microsoft Graph API.</td></tr><tr><td>Organisation</td><td>An entity within the DISCOVER Management Console representing a company or customer environment.</td></tr><tr><td>PCI-DSS data</td><td>Payment Card Industry-regulated data, such as credit card numbers. A predefined sensitive data type in DISCOVER.</td></tr><tr><td>Remediation</td><td>An action taken after sensitive data is discovered, such as encryption, deletion, relocation, or review.</td></tr><tr><td>Scan</td><td>The process by which DISCOVER inspects files, emails, or services against defined policies to identify and classify sensitive data.</td></tr><tr><td>Scanning Server</td><td>A Windows service where the agent is installed. It performs scans on target devices and shows the scan results in the Management Console.</td></tr><tr><td>Scanning Server Deployment</td><td>A Scanning Server deployment where a dedicated Windows host or VM scans other devices and services remotely. The primary deployment model for agentless scanning.</td></tr><tr><td>Scanning Agent host</td><td>The Windows machine on which the Scanning Agent is installed. In local scanning, this is the endpoint itself. In agentless scanning, this is the dedicated host or VM.</td></tr><tr><td>Sensitive data</td><td>Confidential or regulated information, such as PCI, PII, or intellectual property, that DISCOVER scans for and helps protect.</td></tr><tr><td>SSH</td><td>Secure Shell protocol used by DISCOVER to connect to non-Windows target devices during agentless scanning.</td></tr><tr><td>Target</td><td>Any endpoint, server, or service designated in DISCOVER as a location to be scanned. In agentless scanning, targets do not run any DISCOVER component.</td></tr><tr><td>Virtual machine (VM)</td><td>A virtualised Windows environment that can host the Scanning Server for agentless scanning.</td></tr><tr><td>WinRM</td><td>Windows Remote Management protocol, used by DISCOVER to connect to Windows target devices during agentless scanning.</td></tr></tbody></table>


# DISCOVER Quick Start Guide

## Overview

GuardWare DISCOVER is a cross-platform data discovery, investigation, and remediation system that locates, analyses, and manages sensitive data across endpoint devices, file servers, email systems, and cloud storage.

DISCOVER follows a simple operating flow:

* **Scan** finds sensitive data across selected targets.
* **Investigation** lets you flag files of interest and securely download and review them.
* **Remediation** lets you move, delete, copy, and classify the sensitive data detected across scanned systems and send emails regarding the results to end users or data owners.

See [Introduction to DISCOVER](/documentation/discover) for the platform overview.

DISCOVER has three core components:

* **Management Console:** The central web application. Stores configuration and results. Schedules scan jobs. Displays scan status, reports, investigations, and remediation options.
* **Scanning Server:** A Windows service where the scanning agent is installed. It performs scans on target devices and shows the scan results in the Management Console.
* **Targets:** The systems being scanned. Can include endpoints, SMB file shares, Exchange Online, and SharePoint Online.

#### Architecture: Local vs Remote scanning

1. **Local scan**: A local scan is performed when the agent is installed on a target device, and the device scans itself for sensitive data.
2. **Remote scan**: A remote scan is performed using a scanning server where the agent is installed. The scanning server connects to target devices that do not have the agent installed using protocols such as WinRM, SSH, or SMB (for file servers) and performs the scan on those devices remotely.

#### Classifications, data types, and data owners

DISCOVER uses a simple governance model:

* **Classifications** define sensitivity levels.
* **Data Types** define what DISCOVER detects.
* **Data Owners** define who is notified.

The relationship is direct:

* A data type belongs to a classification.
* One or more data owners can be assigned to a data type.
* A file inherits the highest sensitivity classification from matched data types.

See [DATA GOVERNANCE](broken://spaces/Ed9fCLlVaJapax3PDIac) for the full governance model.

#### What this guide covers

* Console access
* Scanning Server configuration
* Connecting Microsoft 365
* Target discovery, scanning, and review
* Investigation and remediation

This guide introduces the essential steps for quickly initiating scan jobs and getting visibility into your sensitive data landscape.

{% hint style="warning" %}
Before getting started, make sure you have installed the GuardWare Server and can access the GuardWare Management Console.
{% endhint %}

{% stepper %}
{% step %}

### Log in to the Console

1. Open the GuardWare Management Console URL.
2. Sign in with your admin or organisation account.
3. Complete 2FA, EULA acceptance, and password setup if prompted.

If Microsoft sign-in is enabled, you can also use your Microsoft account.
{% endstep %}

{% step %}

### Whitelist DISCOVER

Add the following directories and executables to your security solution's exclusion or trusted applications list.

1. `C:\Program Files\Guardware\GuardWare DISCOVER`.
2. `C:\Program Files\Guardware\GuardWare DISCOVER\MIPLabelHandler`.
3. `GuardWareDiscoverAgent.exe`
4. `GWActiveMon.exe`
   {% endstep %}

{% step %}

### Download the Agent <a href="#download-the-agent" id="download-the-agent"></a>

1. Navigate to **RESOURCES** > **Agent Download > DISCOVER Agent**.
2. Set the **Location** and click **Update**.
3. Click **Submit**. The Download link only appears after the configuration is complete.

Once the installation settings are complete, the **Download Installer** link becomes available. Click it to download the agent with the configured settings.
{% endstep %}

{% step %}

### Configure the Scanning Server

1. For **local scanning**, install the downloaded agent on a target device.
2. For **remote scanning**, install the downloaded agent on a Windows host. The Windows host becomes the Scanning Server and scans multiple remote systems across the network.
3. Complete the setup wizard.
4. Confirm the Scanning Server or target device appears as **Online** in the Console.

For remote scan, each target device must be configured to accept connections from the Scanning Server host using the appropriate protocol. GuardWare provides PowerShell scripts that enable the required services, set permissions, and configure firewall rules.

For Microsoft 365 targets, no script is required on target devices. The Scanning Server host needs outbound HTTPS access and valid Microsoft Entra ID credentials.

See [**Scanning Server Deployment Guide**](/getting-started/install-discover-agent/install-discover-agent) for remote access configuration.
{% endstep %}

{% step %}

### Connect Microsoft 365

Connect your Microsoft 365 environment to enable scanning of Exchange Online and SharePoint Online. Ensure you have the **Global Administrator** account's credentials ready.

1. Navigate to ***ORGANISATION > Integrations**.*
2. Click **Connect Microsoft 365**.
3. Sign in with a **Global Administrator** account.
4. Review the requested permissions.
5. Select **Consent on behalf of your organisation**.
6. Click **Accept**.
   {% endstep %}

{% step %}

### Define classifications and data types

Set up classifications and data types before you run scans. This makes results easier to review and act on.

1. Navigate to **DATA GOVERNANCE** > **Data Classification**.
2. Create classifications manually with **+Add Classification**, or click **Sync** to import published Microsoft Purview Information Protection sensitivity labels.
3. Run **Sync** again after labels are added or changed in Microsoft Purview.
4. Go to **DATA GOVERNANCE** > **Data Type**.
5. Click **+Data Type** and enter the data type name and description.
6. Choose the identifier type:
   * **Sensitive Words**
   * **Regular Expressions**
   * **Filename Expressions**
7. Assign a classification and data owner.
8. Click **Save**.

See [**DATA GOVERNANCE**](broken://spaces/Ed9fCLlVaJapax3PDIac/pages/YysiXMcinfT8l8z8C7q8) for more details.
{% endstep %}

{% step %}

### Discover target devices and services

Before you can scan, DISCOVER must know what to scan. Targets are the systems and services DISCOVER scans to detect sensitive data. Properly defining targets ensures scans reach the correct data sources and provide comprehensive visibility across your environment.

Start with your highest-priority systems that are most likely to contain sensitive data and expand gradually based on your requirements.

**Devices**

Device targets include workstations, laptops, and file servers where sensitive data may reside.

1. Go to **DISCOVER** > **Target Discovery** > **Devices** and click **+New Target Discovery.**

   <div align="left"><img src="https://4044942488-files.gitbook.io/~/files/v0/b/gitbook-x-prod.appspot.com/o/spaces%2FPtAo3ilfcIjmOhwnXZVf%2Fuploads%2Fg1BwTOAIl31oW9HIGPMk%2FUnknown%20image?alt=media&amp;token=2b5eb147-d51c-4081-ac98-78730b4d95e3" alt="" width="563"></div>
2. Enter a **Job Name** for the discovery job, and specify the **Target IP range** to define the network segment in which DISCOVER should search for devices.
3. Set the **Location** to filter the list of scanning servers by their assigned location.
4. Select the appropriate **Protocol** (WinRM, SSH, or FILE SERVER) to connect to the devices and provide **Authentication** credentials.
   * **SSH** for non-Windows devices.
   * **WinRM** for Windows devices.
   * **File Server (SMB)** for shared storage and file servers.
5. Set the **Connection Attempt Interval** to define how frequently DISCOVER will try to connect to a target.
6. Set **Give-up Trying After** to specify the maximum duration DISCOVER will continue attempting the connection before abandoning it.
7. Click **Save**.

**Services**

Cloud services extend DISCOVER's reach to data stored in external platforms, ensuring complete coverage of your digital assets regardless of location.

1. Go to **DISCOVER** > **Target Discovery** > **Services** and click **+New Target Discovery**.

<div align="left"><img src="https://4044942488-files.gitbook.io/~/files/v0/b/gitbook-x-prod.appspot.com/o/spaces%2FPtAo3ilfcIjmOhwnXZVf%2Fuploads%2FDsPUK6Q1uU8KvjqsKCfg%2FUnknown%20image?alt=media&amp;token=942a648c-169e-42f3-8ffd-4610a4fb9837" alt="" width="563"></div>

2. Enter the **Discovery Job** name, then select the **Cloud Connector** for the service type (Microsoft Exchange or SharePoint).
3. Specify the **Organisation** (for SharePoint) and provide the **Client ID** and **Tenant ID** for authentication.
4. Set the **Location** to filter the list of scanning servers by their assigned location.
5. Select either **Client Exchange Secret** or **Certificate** as an authentication method.
6. Set the **Connection Attempt Interval** to define how frequently DISCOVER will try to connect to a target.
7. Set **Give-up Trying After** to specify the maximum duration DISCOVER will continue attempting the connection before abandoning it.
8. Click **Save**.

Discovered devices and services then appear in **Devices/Services Found** and can be selected in scans.

{% hint style="info" %}
After a target discovery job completes, you can use **Rediscover** from **DISCOVER** > **Target Discovery** to run that same job again. Rediscover uses the same settings and target discovery parameters as the original job. You cannot change them during the rerun. Use it when devices in the discovery range were temporarily unavailable or unreachable.
{% endhint %}

For more details, see [**Target** Discovery](/documentation/discover/scan/target-discovery).
{% endstep %}

{% step %}

### Create and run a scan

After target devices are found, create your first scan. During a scan, DISCOVER examines the selected devices and services by checking the specified directories (or all directories, if configured) and the specified file types for sensitive data.

It then searches within those files, identifying and reporting any sensitive data it detects. You can run a [**One-Time Scan**](/documentation/discover/scan/scans#one-time-scan) for testing or targeted scans, or an [**Ongoing Scan**](/documentation/discover/scan/scans#ongoing-scan) for routine monitoring.

{% tabs %}
{% tab title="Configure and Run a One-Time Scan" %}
A **One-Time Scan** checks new or changed files on the selected targets against your configured data types and classifications. Use it to validate a new rule, perform a targeted check, or test new scan configurations.

1. Navigate to **DISCOVER** > **Scans** and click **+New Scan.**

<div align="left"><img src="https://4044942488-files.gitbook.io/~/files/v0/b/gitbook-x-prod.appspot.com/o/spaces%2FPtAo3ilfcIjmOhwnXZVf%2Fuploads%2Fon9wWaRmF1KG6SidcMrd%2FUnknown%20image?alt=media&amp;token=250dafe7-35fa-4a22-82ed-5b21ea0a8e9b" alt="" width="563"></div>

2. Select **One-Time Scan** and click **Proceed.**

<div align="left"><img src="https://4044942488-files.gitbook.io/~/files/v0/b/gitbook-x-prod.appspot.com/o/spaces%2FPtAo3ilfcIjmOhwnXZVf%2Fuploads%2FfnyZiGkKdqMInootPwOz%2FUnknown%20image?alt=media&amp;token=8a957795-f97b-432c-8f3f-e93cd2f6d4e6" alt="" width="563"></div>

3. Enter a **Scan Name** and give a **Description** (optional), then click **Next**.
4. Select the data types you want to search for and click **Next**.
5. Select the targets and services to scan, then click **Next**.
6. Configure the **File Handling Options**, specify the files and folders you want to include or exclude from the scan, and then click **Next**.
7. Review the scan configurations and click **Save Scan**. The scan will begin automatically.
   {% endtab %}

{% tab title="Configure and Run an Ongoing Scan" %}
An Ongoing Scan performs a full scan of selected targets and services on a recurring schedule. Use it for routine checks, to validate compliance with data-handling policies, and to maintain continuous visibility into sensitive information across your environment.

Each scan contributes to a historical record that DISCOVER uses to generate trends, enabling you to monitor changes over time, identify emerging risks, and track remedial actions. Ongoing Scans are resource-intensive, so schedule them during off-peak hours to minimise impact on business operations.

1. Go to **DISCOVER** > **Scans** and click **+New Scan**.
2. Select **Ongoing Scan** and click **Proceed**.

<div align="left"><img src="https://4044942488-files.gitbook.io/~/files/v0/b/gitbook-x-prod.appspot.com/o/spaces%2FPtAo3ilfcIjmOhwnXZVf%2Fuploads%2FJYJ074BKSW7QKAiEakf7%2FUnknown%20image?alt=media&amp;token=ed1b0206-403b-4641-a2d7-a9c6a5f472d8" alt="" width="563"></div>

3. Select data types you want to search for and click **Next**.
4. Select the Targets/Services to scan, then click **Next**.
5. Configure File Handling Options and filters, then click **Next**.
6. Schedule the scan time and click **Next**.

<div align="left"><img src="https://4044942488-files.gitbook.io/~/files/v0/b/gitbook-x-prod.appspot.com/o/spaces%2FPtAo3ilfcIjmOhwnXZVf%2Fuploads%2FUn02WnrU0imlbUm0EHh7%2FUnknown%20image?alt=media&amp;token=5023080d-ac9a-4fe9-bb34-81135765e2fa" alt="" width="563"></div>

7. Review the scan configurations and click **Save Scan**. The scan will automatically initiate.
   {% endtab %}
   {% endtabs %}

During execution, track progress in **DISCOVER** > **Scans**.

When the scan completes, open **View Result** or go to **DISCOVER** > **Results**.
{% endstep %}

{% step %}

### Check results

From **DISCOVER > Results**, you can filter findings and move selected items into an investigation. After a scan completes, you can view details such as what sensitive data was found, which device or service it was found on, how many instances were detected, and any remediation actions that have been applied.

By default, you'll see results from all completed scans. Use the filter options at the top of the page to narrow results by scan job, date range, data type, classification, or target name.
{% endstep %}

{% step %}

### Analyse discovered data

Use the dashboard for trends and the results view for details.

1. Go to **DISCOVER** > **Dashboard** > **Dashboard** for high-level metrics.
2. Review widgets such as **Potential Sensitive Data**, **Potential Data by Target**, and remediation status.
3. Go to **DISCOVER** > **Dashboard** > **Summary Report** to review files and targets by data type for a specific scan.
4. Go to **DISCOVER** > **Results** to inspect individual findings and refine filters by scan, target, data type, and classification.

Use this review to confirm risk, prioritise targets, and decide what needs investigation or remediation first.

See [**DISCOVER Dashboard**](/documentation/discover/dashboard/discover-dashboard) for more details.
{% endstep %}

{% step %}

### Classify discovered information

DISCOVER classifies files based on the matched data types. The highest matched classification is applied to the result.

1. Confirm that the relevant data types already have classifications assigned.
2. Review findings in **DISCOVER** > **Results**.
3. If a file needs a different label, use **Remediate** > **Classify**.
4. If you need to update the default mapping, go to **DATA GOVERNANCE** > **Data Type** and assign the correct classification to the data type.

This keeps discovered information aligned with your handling policy.
{% endstep %}

{% step %}

### Create an investigation

Use the Investigation feature when you need to review discovered files more closely.

Before you investigate files, configure the secure location and investigation password first.

#### Set up a secure location and an investigation password

When DISCOVER identifies sensitive files during a scan, you may need to investigate or remediate them. A **secure location** is a designated storage area where these files are copied or moved, keeping them in a controlled environment separate from their original location.

An **Investigation password** is the password required to access the files downloaded using DISCOVER's Investigate function. Set an investigation password before conducting any investigations, and store it securely. If it is lost, previously downloaded files cannot be opened.

Set them in **ORGANISATION** > **Set Up Secure Location**.

<figure><img src="https://4044942488-files.gitbook.io/~/files/v0/b/gitbook-x-prod.appspot.com/o/spaces%2FPtAo3ilfcIjmOhwnXZVf%2Fuploads%2FpgJaLXcuMJMeTKcPcnOV%2FSet%20up%20secure%20location.png?alt=media&amp;token=43eab64b-089b-4bb3-bd00-371a0d5712d8" alt=""><figcaption></figcaption></figure>

See [**Secure Location**](/documentation/discover/investigate-and-remediate/set-up-secure-location) and [**Investigation Password**](/documentation/discover/investigate-and-remediate/set-investigation-password) for more details.

#### Create a new investigation

1. Navigate to **DISCOVER** > **Investigation**.
2. Click **+ New Investigation**.
3. Enter a name and a short purpose.
4. Click **Create**.

#### Move items into the investigation

1. Navigate to **DISCOVER** > **Results**.
2. Select one or more findings.
3. Click **Investigate**.
4. Select an existing investigation from the drop-down or create a new one by entering a new name.
5. Add an optional comment, and click **Investigate**. Investigation results are made available as password-protected ZIP downloads.
6. Click the download icon to download the file. The files inside the ZIP are password-protected. Use the password you set up while setting up the secure location.

See [**Investigation**](/documentation/discover/investigate-and-remediate/investigation) for more details.
{% endstep %}

{% step %}

### Remediate sensitive information

Use **Remediate** to reduce risk after you confirm a finding. You can move, copy, delete, classify, or notify the right owner.

1. Go to **DISCOVER** > **Results** > **Remediate** or **DISCOVER** > **Investigation** > **Remediate**.
2. Select one or more files and click **Remediate**.
3. Choose a remediation action from the drop-down.

<table><thead><tr><th width="221.4444580078125">Action</th><th>Function</th></tr></thead><tbody><tr><td>Move</td><td>Relocates the file to a secure location.</td></tr><tr><td>Copy</td><td>Creates a copy of the file to a secure or alternate location.</td></tr><tr><td>Delete</td><td>Permanently removes the file.</td></tr><tr><td>Classify</td><td>Classify file according to selected classification.</td></tr><tr><td>Send Email to Data Owner</td><td>Notifies the assigned data owner with an email.</td></tr><tr><td>Send Email to Device Owner</td><td>Notifies the file owner or user who has the device in their possession.</td></tr></tbody></table>

4. Add a comment (optional) to provide context or notes for the task.
5. Click **Remediate** to execute the selected action.

Use **DISCOVER** > **Remediation** to track what action was taken, by whom, and when.

See [**Remediation**](/documentation/discover/investigate-and-remediate/remediation) for more details.
{% endstep %}
{% endstepper %}

With these steps complete, DISCOVER is ready to scan your selected targets and help you identify, investigate, and remediate sensitive data across your organisation.


# DISCOVER Training Guide

Learn how to deploy, configure, operate, and maintain DISCOVER with confidence.

## Overview

This guide helps administrators learn how to operate DISCOVER confidently. It goes beyond first use and focuses on repeatable setup, sound scanning decisions, and safe handling of findings.

Use this guide if you need to understand:

* how DISCOVER is structured
* how to prepare targets and scanning servers
* how to configure governance and scans correctly
* how to review, investigate, and remediate findings

If you only need the fastest path to your first scan, use the [DISCOVER Quick Start Guide](/documentation/discover/getting-started/discover-quick-start-guide).

### Training outcomes

By the end of this guide, you should be able to:

* explain how DISCOVER components work together
* choose between local and agentless scanning
* configure data types, classifications, and target discovery
* run scans with the right scope and options
* investigate and remediate findings safely
* monitor scan activity and interpret results

### Recommended audience

This guide is intended for:

* security administrators
* IT operations teams
* compliance teams supporting data discovery workflows

### Before you begin

Make sure you have:

* access to the GuardWare Management Console
* a deployed Scanning Agent or Scanning Server
* administrator credentials for your target systems
* Microsoft 365 administrator access if you plan to scan Exchange Online or SharePoint Online

For product background, start with [Introduction to DISCOVER](/documentation/discover).

{% stepper %}
{% step %}

### Understand the DISCOVER operating model

DISCOVER is built around three core components:

* **Management Console** for configuration, scheduling, and review
* **Scanning Server** for task execution
* **Targets** such as endpoints, file shares, and cloud services

You can deploy scanning in two ways:

* **Local scanning** installs the agent on the target device
* **Agentless scanning** installs the agent on a separate Windows host that scans remote targets

Use local scanning when a device needs to scan its own files directly. Use agentless scanning when one host needs to scan many systems across the network.

Start here:

* [Introduction to DISCOVER](/documentation/discover)
* [DISCOVER Devices](/documentation/discover/devices/discover-devices)
  {% endstep %}

{% step %}

### Prepare the environment

A stable deployment depends on correct server setup, network access, and endpoint preparation.

Work through these tasks first:

1. Install and validate the Management Console.
2. Deploy the Scanning Agent to a target device or dedicated Scanning Server.
3. Confirm the agent appears online.
4. Allow required network access between the console, scanning host, and targets.
5. Add DISCOVER folders and processes to your security allowlist.

For full installation details, use:

* [Management Console Installation Guide](broken://spaces/PtAo3ilfcIjmOhwnXZVf/pages/zDel6WHZOsHDL6GDNDWC)
* [DISCOVER Quick Start Guide](/documentation/discover/getting-started/discover-quick-start-guide)

{% hint style="info" %}
For most environments, agentless scanning gives broader coverage with less endpoint deployment effort.
{% endhint %}
{% endstep %}

{% step %}

### Configure governance before scanning

DISCOVER becomes more useful when findings map to business meaning.

Before you scan at scale:

1. Create or sync **classifications**.
2. Create **data types** that reflect what you need to detect.
3. Assign each data type to the right classification.
4. Assign data owners where notifications are required.

This model drives how findings are labelled and who gets notified.

The key relationship is simple:

* a data type belongs to a classification
* one or more data owners can be assigned to a data type
* a file inherits the highest classification from its matches

See the configuration flow in the [DISCOVER Quick Start Guide](/documentation/discover/getting-started/discover-quick-start-guide).
{% endstep %}

{% step %}

### Discover targets correctly

Target discovery defines what DISCOVER can scan.

Use **Devices** discovery for:

* Windows endpoints over WinRM
* non-Windows devices over SSH
* file shares over SMB

Use **Services** discovery for:

* Exchange Online
* SharePoint Online

When creating discovery jobs:

1. Choose a clear job name.
2. Select the correct protocol or cloud connector.
3. Use credentials with the minimum access needed to reach the target.
4. Choose a scanning server in the right location.
5. Set retry and timeout values that fit your network.

Use [Target Discovery](/documentation/discover/scan/target-discovery) for the full process.

{% hint style="warning" %}
If a device does not appear in results, check routing, firewall rules, protocol access, and credential format before changing the scan design.
{% endhint %}
{% endstep %}

{% step %}

### Design scans with the right scope

A good scan design balances coverage, accuracy, and runtime.

DISCOVER supports two operating scan types:

* **One-Time Scan** for testing, targeted checks, and validation
* **Ongoing Scan** for scheduled monitoring and trend tracking

When building a scan, decide:

1. Which data types matter for this objective.
2. Which targets or services should be included.
3. Whether to enable archive scanning.
4. Whether OCR is necessary.
5. Whether to include all folders or narrow the scope.
6. Whether to include only new or changed files.

Use [Scans](/documentation/discover/scan/scans) to configure both scan types.

<details>

<summary>Recommended scan design approach</summary>

Start with a narrow one-time scan.

Validate:

* data types
* target access
* file handling options
* expected runtime

Then expand into ongoing scanning once the results and performance are understood.

</details>
{% endstep %}

{% step %}

### Review scan performance and operational impact

Scan performance varies by file type, file count, OCR use, and network conditions.

Watch for these common drivers:

* OCR adds significant overhead for PDFs
* large HTML and Markdown files take longer than expected
* many small files can take longer than fewer large files

Use [Scan Performance](/documentation/discover/scan/scan-performance) when planning schedules, especially for ongoing scans.

Best practices:

* schedule heavier scans outside business hours
* test OCR on representative samples first
* exclude irrelevant folders and file types where possible
  {% endstep %}

{% step %}

### Review findings and prioritise action

After a scan completes, review findings in context.

Use:

* **Results** for detailed finding review
* **Dashboard** for trends and broader visibility
* **Summary Report** for scan-specific analysis

Focus first on:

1. high-sensitivity classifications
2. high-volume targets
3. repeated findings across ongoing scans
4. data types that indicate regulated data exposure

Relevant pages:

* [DISCOVER Dashboard](/documentation/discover/dashboard/discover-dashboard)
* [DISCOVER FAQs](/documentation/discover/frequently-asked-aquestions/discover-faqs)
  {% endstep %}

{% step %}

### Set up investigation safely

Before downloading flagged files, set up the secure handling workflow.

You must configure:

* a **Secure Location** for copied or moved files
* an **Investigation Password** for protected downloads

Then you can:

1. create an investigation
2. move selected findings into it
3. download protected ZIP files for review

Use these pages:

* [Set Up Secure Location](/documentation/discover/investigate-and-remediate/set-up-secure-location)
* [Set Investigation Password](/documentation/discover/investigate-and-remediate/set-investigation-password)
* [Investigation](/documentation/discover/investigate-and-remediate/investigation)

{% hint style="warning" %}
Store the investigation password securely. Previously downloaded files cannot be opened without it.
{% endhint %}
{% endstep %}

{% step %}

### Remediate findings with intent

Remediation should follow validation, not guesswork.

DISCOVER supports these actions:

* move
* copy
* delete
* classify
* send email to data owner
* send email to device owner

Choose the action that matches the risk and your internal policy.

Examples:

* use **Classify** when the file needs the right sensitivity label
* use **Move** or **Copy** when a secure review path is needed
* use **Delete** only when policy allows permanent removal

Use [Remediation](/documentation/discover/investigate-and-remediate/remediation) for the detailed workflow.
{% endstep %}

{% step %}

### Monitor operations and improve continuously

Training is complete when the workflow becomes repeatable.

As part of normal operations:

1. review scan completion status regularly
2. monitor trends in the dashboard
3. review agent health and logs
4. refine scan scope based on performance and false positives
5. update data types and classifications as requirements change

Use these pages during steady-state operations:

* [DISCOVER Devices](/documentation/discover/devices/discover-devices)
* [Scans](/documentation/discover/scan/scans)
* [DISCOVER Dashboard](/documentation/discover/dashboard/discover-dashboard)
* [DISCOVER FAQs](/documentation/discover/frequently-asked-aquestions/discover-faqs)
  {% endstep %}
  {% endstepper %}

### Suggested training flow for new administrators

Follow this sequence for onboarding:

1. Read [Introduction to DISCOVER](/documentation/discover).
2. Complete the [DISCOVER Quick Start Guide](/documentation/discover/getting-started/discover-quick-start-guide).
3. Build one test discovery job and one test scan.
4. Review findings in the dashboard and results views.
5. Create one investigation and one controlled remediation exercise.
6. Move to scheduled scanning only after the test workflow is stable.

### What to practice during training

Use a non-production or low-risk scope first.

Recommended exercises:

* discover a small device range or one cloud service scope
* run one one-time scan with a limited set of data types
* compare results with OCR on and off for a small sample
* send selected findings into an investigation
* test one safe remediation action such as classify or copy

### Next steps

After training, keep these pages close:

* [DISCOVER Quick Start Guide](/documentation/discover/getting-started/discover-quick-start-guide)
* [Target Discovery](/documentation/discover/scan/target-discovery)
* [Scans](/documentation/discover/scan/scans)
* [DISCOVER Dashboard](/documentation/discover/dashboard/discover-dashboard)
* [DISCOVER FAQs](/documentation/discover/frequently-asked-aquestions/discover-faqs)

With this workflow in place, you can move from first use to reliable day-to-day DISCOVER operations.


# DISCOVER training module - 100 minutes

## Overview

This training module is designed to give users a practical introduction to DISCOVER.

It covers:

* Product architecture, scanning models, and key components
* Microsoft 365 integration, target discovery, and Scanning Server setup
* Data governance, data types, classifications, and scan configuration
* Results review, investigation, remediation, and positioning with PROTECT and INSIGHT

### Duration

* **Session 1** - 45 minutes
* **Break** - 10 minutes
* **Session 2** - 45 minutes

### Session 1 - 45 minutes

#### Topics covered

* DISCOVER overview
* How to integrate with Microsoft 365
* How to set up a scanning server
* How to perform local and remote scans
* What a secure move location is
* How to set up classifications
* What data types and sub data types are available in the system
* How to define new data types
* How to define complex regular expressions
* How to combine regex with other conditions
* How to discover what to scan (targets)

#### 1. Product overview and architecture - 5 minutes

Cover the product at a high level.

Explain:

* What DISCOVER is
* Where it fits in the data security workflow
* How data moves from detection to action

Use this workflow:

* **Data types** → **Scan** → **Results** → **Remediate**

Review the main components:

* **Management Console**
* **Scanning Server**
* **Target devices and services**

Then explain the two scanning models:

#### Local scan

* Agent installed on the target device
* The device scans itself

#### Agentless scan

* Agent installed on a Scanning Server
* Scans remote systems over:
  * WinRM
  * SSH
  * SMB

#### 2. Server installation - 15 minutes (Optional, if included, the session will extend by 15 minutes)

Run a live installation walkthrough.

**Cover**

* What the installation includes
* The minimum prerequisites for setup
* What trainees should expect after first sign-in

**Demonstrate**

* GuardWare Server installation
* Initial setup
* First access to the Management Console

**Trainer focus**

* Show the minimum steps required to get to a usable console
* Point out any prerequisites that commonly block setup

#### 3. Management Console introduction - 5 minutes

Show the main navigation areas.

**Cover**

* Organisation settings
  * Setting up a secure location
  * Setting an investigation password
  * Integrating with Microsoft 365
* Devices
* Data Governance
* Resources

**Demonstrate**

* Moving through the main Console areas
* Locating the settings used later in the session

#### 4. Getting started - Agent/Scanning Server configuration - 10 minutes

Walk through agent preparation for scanning.

**Cover**

* How local and agentless scanning differ

**Demonstrate**

* Agent configuration
* Agent download
* Agent installation
* For **local scan**, install the downloaded agent on a target device
* For **agentless/remote scan**, install the downloaded agent on a Windows host, which becomes the **Scanning Server**
* Complete the setup
* Confirm the Scanning Server appears as **Online** in the Console

**Key points**

* A local scan runs on the target device itself
* An agentless scan uses a Scanning Server to scan remote systems across the network

#### 5. Data governance - 15 minutes

Show how governance settings define what DISCOVER detects, classifies, and escalates.

**Cover**

* Built-in data types such as credit cards, passport numbers, PII, and financial information
* Custom data types using **Sensitive Words**, **Regular Expressions**, and **Filename Expressions**
* Example inputs such as Confidential, Salary, Acquisition, employee IDs, customer numbers, passport formats, and Payroll\_\*.xlsx.
* Subtypes and how they improve categorisation and reduce false positives
* Manual classifications such as **Public**, **Internal**, **Confidential**, and **Restricted**
* Purview synchronisation for existing Microsoft classifications
  * Needs MIP license for MIP classification.
* Data owners and how notifications are assigned
* The difference between a data owner and a device owner

**Demonstrate**

* Reviewing built-in data types
* Creating a custom data type with **Sensitive Words**
* Creating a custom data type with **Regular Expressions**
* Creating a custom data type with **Filename Expressions**
* Briefly covering how to create a manual classification
* Showing where Purview-synchronised classifications appear
* Assigning a data owner to a data type
  * Explain:&#x20;
    * Data owners are not necessarily device owners
    * Data owners receive notifications when sensitive data is discovered
    * Example: an HR manager receives an alert when employee-sensitive data is found outside approved locations

**Trainer focus**

* Emphasise how better data type design improves scan quality
* Explain how subtypes help reduce false positives
* Show how notifications reach the right business owner

#### 6. Target discovery - 15 minutes

Show both discovery paths.

**Cover**

* Device discovery for Windows, Linux, and file shares
* Service discovery for cloud platforms
* The prerequisites that make discovery succeed

**Demonstrate**

* Device discovery over WinRM
* Device discovery over SSH
* SMB file server discovery
* SharePoint Online discovery
* Exchange Online discovery
* Gmail discovery
* Google Drive discovery
* Explain steps to connect to Google Wokspace

**Key points**

* Discovery depends on network reachability, permissions, and host-side configuration

### Break - 10 minutes

### Session 2 - 45 minutes

#### Topics covered

* How to configure scans
* What is a one-time scan
* What is an ongoing scan
* Key considerations when conducting scans
* Scan and classify
* How to review results
* How to delete data
* How to classify identified data
* How to copy data to a secure location
* How to move data
* How to move SharePoint data to another SharePoint site
* How to move email to a secure email account

#### 7. Create a scan - 15 minutes

Explain the two scan types, then configure a scan live.

**Cover**

* **One-Time Scan** for quick validation and testing
* **Ongoing Scan** for continuous monitoring and scheduled execution
* When to use each scan type

**Demonstrate**

* Creating a **One-Time Scan**
* Creating an **Ongoing Scan**
* Selecting data types
* Selecting targets
* Archive scanning
* OCR Options
* Changed files only
* Scheduling
* Scan and Classify
* Running the scan
* Reviewing scan progress
* Reviewing scan status
* Showing where results appear

**Trainer focus**

* Explain when to use Scan and Classify
* Show how classification is applied as part of the scan workflow
* Explain why this is important for downstream monitoring and protection

**Key points**

* Multiple one-time scans can run
* Only one ongoing scan can run at a time

#### 8. Dashboard and Results- 5 minutes

Review discovered data at a higher level before drilling into individual findings, then move from trend views into finding-level review.

**Cover**

* Dashboard for aggregated metrics across scans
* Summary Report for findings from a specific scan job
* Common metrics such as Potential Sensitive Data, Potential Data by Target, and Discovered vs Investigated vs Remediated Data
* How results are grouped across devices, SharePoint, and email

**Demonstrate**

* Dashboard review
* Summary Report review
* Scan-level filtering
* High-level metrics and trend views
* Findings review
* Device results
* SharePoint results
* Email results

**Trainer focus**

* Show how to filter by scan, target, data type, and classification
* Show how to move from high-level trends into file-level findings
* Explain when to use Results instead of Dashboard

#### 9. Investigation - 5 minutes

Show how to inspect sensitive files in a controlled workflow.

**Cover**

* Why an investigation password is required

**Demonstrate**

* Creating an investigation password
* Creating an investigation
* Moving findings into the investigation
* Reviewing files

#### 10. Remediation - 5 minutes

Show how to take action on findings.

**Cover**

* When to use **Move**, **Copy**, **Delete**, and **Classify**
* Who should be notified after remediation

**Demonstrate**

* Setting up a secure location
* **Move** - Move files to a secure location
* **Copy** - Copy files to a controlled location
* **Delete** - Delete approved files
* **Classify** - Apply the appropriate classification action
* Email Notifications
* Notifying the data owner
* Notifying the end user

**Trainer focus**

* Make **Classify** a required demo item
* Explain when classification is the right remediation action instead of move or delete

#### 11. Positioning PROTECT and INSIGHT - 5 minutes

Position DISCOVER as the discovery layer in the wider platform workflow.

**Cover**

* DISCOVER identifies and remediates sensitive data
* INSIGHT helps monitor sensitive data
* PROTECT provides persistent encryption and protection

**Key points**

* Together, DISCOVER, INSIGHT, and PROTECT support a discovery-to-protection workflow
* **Discover** → **Monitor**→ **Protect**

#### 12. Q\&A

Leave time for open discussion.


# DISCOVER 3-hour training

## Overview

This training module is designed to give users a practical introduction to DISCOVER.

It covers:

* Product architecture, scanning models, and key components
* Microsoft 365 integration, target discovery, and Scanning Server setup
* Data governance, data types, classifications, and scan configuration
* Results review, investigation, remediation, and positioning with PROTECT and INSIGHT

### Duration

* **Session 1** - 50 minutes
* **Break** - 10 minutes
* **Session 2** - 50 minutes
* **Break** - 10 minutes
* **Session 3** - 50 minutes

### Session 1 - 50 minutes

#### Topics covered

* DISCOVER overview
* How to integrate with Microsoft 365
* How to set up a scanning server
* How to perform local and remote scans
* What a secure move location is
* How to set up classifications
* What data types and sub data types are available in the system
* How to define new data types
  * How to define complex regular expressions
  * How to combine regex with other conditions
* How to discover what to scan (targets)

#### 1. Product overview and architecture - 5 minutes

Cover the product at a high level first.

**Cover**

* What DISCOVER is
* Where it fits in the data security workflow
* How data moves from detection to action
* The workflow: **Data types** → **Scan** → **Results** → **Remediation**
* The main components:
  * **Management Console**
  * **Scanning Server**
  * **Target devices and services**
* The two scanning models:
  * **Local scan**
    * Agent installed on the target device
    * The device scans itself
  * **Agentless scan**
    * Agent installed on a Scanning Server
    * Scans remote systems over:
      * WinRM
      * SSH
      * SMB

#### 2. Server installation - 10 minutes (Optional)

Run a live installation walkthrough.

**Cover**

* What the installation includes
* The minimum prerequisites for setup
* What trainees should expect after first sign-in

**Demonstrate**

* GuardWare Server installation
* Initial setup
* First access to the Management Console

**Trainer focus**

* Show the minimum steps required to get to a usable console
* Point out any prerequisites that commonly block setup

#### 3. Management Console introduction - 5 minutes

Show the main navigation areas.

**Cover**

* Organisation settings
  * Setting up a secure location
  * Setting an investigation password
  * Integrating with Microsoft 365
* Devices
* Data Governance
* Resources

**Demonstrate**

* Moving through the main Console areas
* Locating the settings used later in the session

#### 4. Getting started - Agent/Scanning Server configuration - 10 minutes

Walk through agent preparation for scanning.

**Cover**

* How local and agentless scanning differ

**Demonstrate**

* Agent configuration
* Agent download
* Agent installation
* For **local scan**, install the downloaded agent on a target device
* For **agentless/remote scan**, install the downloaded agent on a Windows host. The Windows host becomes the **Scanning Server** and scans multiple remote systems across the network
* Complete the setup wizard
* Confirm the Scanning Server appears as **Online** in the Console

**Trainer focus**

* Call out exception list for DISCOVER folders and executables
* Show where to review agent status, assigned targets, and request logs

**Key points**

* A local scan runs on the target device itself
* An agentless scan uses a Scanning Server to scan remote systems across the network

#### 5. Data governance - 20 minutes

Show how governance settings define what DISCOVER detects, classifies, and escalates.

**Cover**

* Built-in data types first
  * Credit cards
  * Passport numbers
  * PII
  * Financial information
* Custom data types using:
  * **Sensitive Words**
  * **Regular Expressions**
  * **Filename Expressions**
* Example inputs:
  * Sensitive words: `Confidential`, `Salary`, `Acquisition`
  * Regular expressions: employee IDs, customer numbers, passport formats
  * Filename expressions: `Confidential_*.pdf`, `Payroll_*.xlsx`
* Subtypes and their value:
  * Better categorisation
  * Reduced false positives
* Manual classifications such as:
  * Public
  * Internal
  * Confidential
  * Restricted
* Purview synchronisation
* Data owners and how they are used:
  * Data owners are assigned to data types
  * They are not necessarily device owners
  * They receive notifications when sensitive data is discovered
* Example:
  * An HR manager receives an alert when employee-sensitive data is found outside approved locations

**Demonstrate**

* Reviewing built-in data types
* Creating a custom data type with **Sensitive Words**
* Creating a custom data type with **Regular Expressions**
  * Define complex regular expressions
  * Combine regex with other conditions
* Creating a custom data type with **Filename Expressions**
* Creating a manual classification
* Showing where Purview-synchronised classifications appear
* Assigning a data owner to a data type

**Trainer focus**

* Emphasise how better data type design improves scan quality
* Show how subtypes help reduce false positives
* Show how notifications reach the right business owner

**Key points**

* Existing Microsoft classifications can be synchronised into DISCOVER

#### 6. Target discovery - 10 minutes

Show both discovery paths.

**Cover**

* Device discovery for remote systems
* Service discovery for cloud platforms
* The prerequisites that make discovery succeed

**Demonstrate**

* Device discovery over WinRM
* Device discovery over SSH
* SMB file server discovery
* SharePoint Online discovery
* Exchange Online discovery
* Gmail discovery
* Google Drive discovery

**Trainer focus**

* Spend extra time on WinRM and SSH setup
* Call out the firewall, routing, and credential issues that block discovery most often
* Explain the minimum host-side setup required before discovery succeeds

### Break - 10 minutes

### Session 2 - 50 minutes

#### Topics covered

* How to configure scans
* What is a one-time scan
* What is an ongoing scan
* Key considerations when conducting scans
* How to run a classification scan
* How to use **Scan and Classify**
* Key considerations when running classification scans
* How to review results
* How to review scan progress and scan status
* Scan performance considerations

#### 7. Create a scan - 15 minutes

Explain the two scan types, then configure a scan live.

**Cover**

* **One-Time Scan** for:
  * Quick validation
  * Testing
* **Ongoing Scan** for:
  * Continuous monitoring
  * Scheduled execution
* When to use each scan type

**Demonstrate**

* Selecting data types
* Selecting targets
* Archive scanning
* OCR Options
* Changed files only
* Scheduling
* Scan and Classify
* Running the scan
* Showing scan progress
* Showing scan status
* Showing where results appear

**Trainer focus**

* Explain when to use Scan and Classify
* Show how classification is applied as part of the scan workflow
* Explain why this is important for downstream monitoring and protection

**Key points**

* Multiple one-time scans can run
* Only one ongoing scan can run at a time

#### 8. Scan scope and file handling options - 10 minutes

Show how to control scan coverage.

**Cover**

* How to control scan coverage
* When a narrow scope is better than broad coverage

**Demonstrate**

* Scanning only selected folders and file types
* Scanning all content except excluded folders and file types
* Archive file handling
* OCR for images
* OCR for documents
* Exchange date filtering
* Auto-scan newly discovered devices for ongoing scans

**Trainer focus**

* Show when a narrow validation scan is better than broad coverage
* Show how file and folder filters reduce scan time and false positives

#### 9. Scan performance and scheduling considerations - 10 minutes

Explain the operational impact of scan settings.

**Cover**

* OCR adds significant overhead for image-heavy PDFs
* HTML, HTM, and Markdown files can take much longer than expected
* Many small files can take longer than fewer large files
* Ongoing scans should run outside business hours where possible
* Avoid scan windows and termination settings affect scheduled coverage

**Trainer focus**

* Use a small OCR comparison example if possible
* Explain why representative test scans matter before wider rollout

#### 10. Dashboard - 5 minutes

Start here so trainees can review discovered data at a higher level before drilling into individual findings.

**Cover**

* **Dashboard** for aggregated metrics across scans
* **Summary Report** for findings from a specific scan job
* Potential Sensitive Data
* Potential Data by Target
* Discovered vs Investigated vs Remediated Data

**Demonstrate**

* Dashboard review
* Summary Report review
* Scan-level filtering
* High-level metrics and trend views

#### 11. Results - 10 minutes

**Cover**

* How results are grouped across devices, SharePoint, and email

**Demonstrate**

* Findings review
* Device results
* SharePoint results
* Email results

**Trainer focus**

* Show how to filter by scan, target, data type, and classification
* Show how to move from high-level trends into file-level findings
* Explain when to use Results instead of Dashboard

### Break - 10 minutes

### Session 3 — 50 minutes

#### Topics covered

* How to set up investigation prerequisites
* How to create and use investigations
* How to delete data
* How to classify identified data
* How to copy data to a secure location
* How to move data
* How to move SharePoint data to another SharePoint site
* How to move email to a secure email account
* How to review remediation history
* How to review logs and agent activity

#### 12. Investigation - 10 minutes

Show how to inspect sensitive files in a controlled workflow.

**Cover**

* Why an investigation password is required

**Demonstrate**

* Creating an investigation password
* Creating an investigation
* Moving findings into the investigation
* Reviewing files

**Trainer focus**

* Explain that previously downloaded files keep the password used at the time of download
* Show why the secure location must be ready before investigation or move actions

#### 13. Remediation - 15 minutes

Show how to take action on findings.

**Cover**

* When to use **Move**, **Copy**, **Delete**, and **Classify**
* Who should be notified after remediation

**Demonstrate**

* Setting up a secure location
* **Move** - Move files to a secure location
* **Copy** - Copy files to a controlled location
* **Delete** - Delete approved files
* **Classify** - Apply the appropriate classification action
* Email Notifications
* Notifying the data owner
* Notifying the end user

**Trainer focus**

* Make **Classify** a required demo item
* Explain when classification is the right remediation action instead of move or delete

#### 14. Remediation history and operational review - 10 minutes

**Cover**

* How to review remediation history
* How to review operational logs and agent activity
* These log types:
  * Scan Logs
  * Target Discovery Logs
  * Investigation Logs
  * Remediation Logs
  * Service Logs

**Demonstrate**

* **Remediation** history
* Status tracking
* Previous comments
* Remediated by
* Remediated at
* Request Logs from the agent

**Trainer focus**

* Show how to use logs to troubleshoot scan, connection, and remediation issues
* Show where to confirm agent health and workload

#### 15. Positioning PROTECT and INSIGHT - 10 minutes

Position DISCOVER as the discovery layer in the wider platform workflow.

**Cover**

* DISCOVER identifies and remediates sensitive data
* INSIGHT helps monitor sensitive data exposure and trends
* PROTECT provides persistent encryption and protection

**Key points**

* Together, they support a discovery-to-protection workflow

#### 16. Q\&A - 5 minutes

Leave time for open discussion.


# DISCOVER Dashboard

{% embed url="<https://www.youtube.com/watch?index=1&list=PLWi_UryZslgY&v=T_hVc20zOKU>" %}

The Dashboard provides a high-level view of scanning, investigation, and remediation activities across your environment. It has two views: the Dashboard, which shows aggregated metrics across all scans, and the Summary Report, which shows findings for all or specific scan jobs.

<figure><img src="https://4044942488-files.gitbook.io/~/files/v0/b/gitbook-x-prod.appspot.com/o/spaces%2FPtAo3ilfcIjmOhwnXZVf%2Fuploads%2FcgQIpH5mhnNNmxpXGQLQ%2Fimage.png?alt=media&amp;token=a2f1a391-fda5-4e64-8368-a67a12570bb0" alt="" width="563"><figcaption></figcaption></figure>

1. Navigate to **DISCOVER** > **Dashboard** and click **Dashboard**.
2. Use the scan job selector at the top of the page to select a specific scan and click **Filter**. <br>

   <div align="left"><figure><img src="https://4044942488-files.gitbook.io/~/files/v0/b/gitbook-x-prod.appspot.com/o/spaces%2FPtAo3ilfcIjmOhwnXZVf%2Fuploads%2F36oQ7jUlvglpgddYECR0%2Fimage.png?alt=media&amp;token=4415b072-f004-4a26-905c-75901efd4f9e" alt="" width="248"><figcaption></figcaption></figure></div>

### Dashboard

This is the default view when you navigate to the Dashboard. You can see the following performance indicators:

<table><thead><tr><th width="178">Metric</th><th width="313">Description</th><th>Operational Use</th></tr></thead><tbody><tr><td><strong>Number of Targets</strong></td><td>Total count of discovered targets available for scanning, including devices, Exchange mailboxes, and SharePoint sites.</td><td>Confirms scan coverage and scope of the environment.</td></tr><tr><td><strong>Total Files Scanned To Date</strong></td><td>Cumulative number of files examined across all scans since deployment.</td><td>Indicates overall scan activity and system throughput.</td></tr><tr><td><strong>Potential Sensitive Data</strong></td><td>Number of files containing at least one match to configured sensitive data types.</td><td>Highlights files that require review and possible action.</td></tr><tr><td><strong>Total Sent For Investigation</strong></td><td>Count of files flagged and downloaded via the Investigate function for deeper analysis.</td><td>Tracks investigation workload and analyst activity.</td></tr><tr><td><strong>Total Remediation</strong></td><td>Number of files on which remediation actions have been performed.</td><td>Measures remediation progress and response activity.</td></tr><tr><td><strong>Potential Data By Target</strong></td><td>Pie chart showing distribution of sensitive files across targets (devices, mailboxes, SharePoint sites).</td><td>Identifies high-risk targets with greater data exposure.</td></tr><tr><td><strong>Top 5 Targets With Large Number Of Data</strong></td><td>Lists the five targets with the highest number of sensitive files.</td><td>Helps prioritise remediation based on risk concentration.</td></tr><tr><td><strong>Remediation Action</strong></td><td>Breakdown of remediation actions performed (email to user, email to owner, moved, copied, deleted).</td><td>Provides visibility into action types and response patterns.</td></tr><tr><td><strong>Discovered vs Investigated vs Remediated Data</strong></td><td>Monthly graph comparing discovered, investigated, and remediated data volumes.</td><td>Highlights workflow gaps; large variances indicate backlog or delayed response.</td></tr></tbody></table>

### Summary Report

The Summary Report provides detailed findings for a specific scan job, rather than aggregated metrics across all scans. Use this when you need to understand exactly what a particular scan found, where sensitive data is located, and which targets are most affected.

![](https://4044942488-files.gitbook.io/~/files/v0/b/gitbook-x-prod.appspot.com/o/spaces%2FPtAo3ilfcIjmOhwnXZVf%2Fuploads%2FRl6iJUEC1SSXRjbtSyZp%2FUnknown%20image?alt=media\&token=7d8b44fc-c56f-4b06-a967-1b17c38a0935)

1. Navigate to **DISCOVER** > **Dashboard** and click **Summary Report**.&#x20;
2. Select a specific scan job from the drop-down and click **Filter**.&#x20;

#### Targets by Data Type

This section shows how many unique targets contain each data type, along with the total number of files affected. Click on a result to see detailed findings broken down by device, SharePoint, and email. Use this to understand how broadly a particular type of sensitive data is distributed across your environment.

<figure><img src="https://4044942488-files.gitbook.io/~/files/v0/b/gitbook-x-prod.appspot.com/o/spaces%2FPtAo3ilfcIjmOhwnXZVf%2Fuploads%2FhLwtN6er4sUwIeXBzVsG%2Fimage.png?alt=media&amp;token=389852f5-9c99-4943-b821-93bf1dce561f" alt="" width="563"><figcaption></figcaption></figure>

#### Files by Data Type&#x20;

This section shows a breakdown of files by context range, where context refers to the number of times a sensitive data pattern appears within a single file. The ranges are 0–5, 5–10, 10–20, 20–50, and 50+. A high concentration of files in the upper ranges may indicate bulk data stores such as databases or spreadsheets that require more attention.

<figure><img src="https://4044942488-files.gitbook.io/~/files/v0/b/gitbook-x-prod.appspot.com/o/spaces%2FPtAo3ilfcIjmOhwnXZVf%2Fuploads%2FdJUa2LHfFrd7YHG8xmbQ%2Fimage.png?alt=media&amp;token=137b0a27-aeec-4682-a798-6eb597ec2da8" alt="" width="563"><figcaption></figcaption></figure>


# DISCOVER Devices

DISCOVER Devices shows the list of DISCOVER scanning agents, which are the Windows service that sits between the Management Console and the target to perform scans and remediations. The Management Console sends jobs to the agent, which performs the work and returns the results to the management console.

An agent can be installed on a Windows endpoint, a Windows server, or a Windows VM. If installed on the same device being scanned, it performs a local scan. If installed on a separate host or a scanning server, it connects to target devices remotely and performs agentless scans.

Beyond scanning devices, file servers, and cloud services for sensitive data, the agents execute other core operational tasks, including discovering new targets within specified network ranges or cloud environments, downloading files for investigations, executing remediation actions, and reporting results and status back to the Management Console.

Multiple agents can be deployed across your network to distribute the workload and ensure comprehensive coverage. Each agent operates independently but is centrally managed through the Management Console.

![](https://4044942488-files.gitbook.io/~/files/v0/b/gitbook-x-prod.appspot.com/o/spaces%2FPtAo3ilfcIjmOhwnXZVf%2Fuploads%2Fv2e4hFhHY89vzr4FhBkn%2FUnknown%20image?alt=media\&token=74fae70c-901e-4ee7-8fe5-ea5b8fa6785c)

1. Navigate to **Devices** > **DISCOVER** to view all deployed DISCOVER agents in your environment, including their current operational status, CPU, memory, disk utilisation, and assigned targets.

## Request Logs

The agent logs all activities performed by the agent. Use logs to troubleshoot issues, audit system activity, provide compliance documentation, and analyse agent performance.

* **Scan Logs**: Record scanning activity, including which targets were scanned, what data types were searched, files examined, sensitive data detected, and any errors encountered.
* **Target Discovery Logs**: Record discovery operations, including IP ranges or cloud services searched, devices or services found, authentication successes and failures, and connectivity issues.
* **Investigation Logs**: Record file download activities, including which files were requested, download success or failure, duration, and permission errors.
* **Remediation Logs**: Record remediation actions, including which files were moved, copied, or deleted, action success or failure, secure location targets, and errors preventing completion.
* **Service Logs**: Record general agent operations, including service starts and stops, configuration changes, Management Console communication, resource usage, and system errors.

![](https://4044942488-files.gitbook.io/~/files/v0/b/gitbook-x-prod.appspot.com/o/spaces%2FPtAo3ilfcIjmOhwnXZVf%2Fuploads%2FUMHNJgtld1I2wDHyn6in%2FUnknown%20image?alt=media\&token=f4921f05-3c4a-42b6-9d1c-f50aabc0af11)

1. Navigate to **Devices** > **DISCOVER** and select the agent whose logs you need.
2. In the agent details page, click **Request Log** and enter the following details:
   * **Log Type**: Select one from the drop-down (Scan, Target Discovery, Investigation, Remediation, or Service).
   * **From Date**: Select the start date for the log period.
   * **To Date**: Select the end date for the log period.
3. Click **Request Logs**.&#x20;

DISCOVER generates the log file, which may take some time depending on the date range and activity volume.


# Target Discovery

{% embed url="<https://www.youtube.com/watch?index=3&list=PLWi_UryZslgY&v=5qdIyLEKa4A>" %}

Target Discovery identifies the devices and services that DISCOVER can scan. Before running scans, targets must be discovered and added to DISCOVER's inventory. Once a discovery job completes, the found targets appear in [**Devices/Services Found**](#devices-services-found).

DISCOVER finds targets through two methods:

* **Network-based discovery**, where Scanning Servers search for devices within specified IP ranges using WinRM, SSH, or SMB protocols.
* **Cloud service discovery**, where DISCOVER connects to Microsoft 365 and Google services.

<figure><img src="https://4044942488-files.gitbook.io/~/files/v0/b/gitbook-x-prod.appspot.com/o/spaces%2FPtAo3ilfcIjmOhwnXZVf%2Fuploads%2FOJ7NiqgDk0Jyis01L2ky%2Fimage.png?alt=media&amp;token=cd97ecf6-4e39-4684-9ef3-6b911b20248a" alt="" width="563"><figcaption></figcaption></figure>

## Add Devices

Devices are physical or virtual endpoints that DISCOVER scans for sensitive data. This includes workstations, laptops, and file servers. DISCOVER connects to these devices either locally (if the Scanning Server is installed on the device itself) or remotely using SSH or WinRM.

<figure><img src="https://4044942488-files.gitbook.io/~/files/v0/b/gitbook-x-prod.appspot.com/o/spaces%2FPtAo3ilfcIjmOhwnXZVf%2Fuploads%2FuSHcgdVEYnfo7QtyZroT%2Fimage.png?alt=media&amp;token=66567a81-61fd-4505-a10c-7da09b2dfda0" alt="" width="563"><figcaption></figcaption></figure>

1. Navigate to **DISCOVER** > **Target Discovery** > **Devices** and click **+New Target Discovery**.
2. In the **Discovery Job Name** field, enter a descriptive name that identifies the purpose of the job (e.g., Finance Department Workstations, Sydney Office Network Scan).
3. In the **Target IP Range** field, enter the IP address range where DISCOVER should search for devices (e.g., `192.168.1.100` ).

{% hint style="warning" %}
The Scanning Server and target devices must be within the same subnet to communicate directly. If they are on different subnets, your network must have appropriate routing, firewall rules, and port access configured to allow the Scanning Server to reach the targets.
{% endhint %}

4. Set the **Location** filter to narrow the list of available Scanning Servers by their assigned location. This is useful when you have Scanning Servers deployed across multiple sites or business units. Select the location that corresponds to where the Scanning Server you want to use is deployed (e.g., "Sydney Office", "Melbourne Data Centre").
5. From the protocol drop-down, select how DISCOVER will connect to target devices:
   * **WinRM** for Windows devices.
   * **SSH** for non-Windows devices.
   * **File Server (SMB)** for network file shares and storage devices accessible via SMB, such as Windows file shares and NAS devices.
6. Enter credentials for an account with access to the target devices. The format depends on the account type:
   1. **For WinRM and SSH Protocols:** Enter the **Username** and **Password** in the appropriate fields. The account type determines the format:
      1. **Local Accounts:** Use the local username only (e.g., `administrator`, `admin`, `localuser`). Local accounts are created directly on the target device and are not part of a domain.
      2. **Azure AD (Entra ID) Accounts:** Use the full email address (e.g., `user@yourcompany.com.au`). These are cloud-based accounts managed through Microsoft Azure Active Directory.
      3. **Domain Accounts:** Use the format `DOMAIN\username` (e.g., `YOURCOMPANY\admin`, `CONTOSO\scanuser`). These are accounts managed through an on-premises Active Directory domain.
   2. **For File Server Protocol**, enter the Username and Password of an account with access to the target share. Use the `DOMAIN\username` format for domain accounts where required.
   3. In the **SMB Location** field, enter the server name and path to the share or folder. (e.g,`\\fileserver01\share, \\fileserver01\share\folder, \\192.168.1.50\documents`)
7. Set the **Connection Retry Frequency** to define how often DISCOVER will attempt to reconnect if the initial connection fails. Shorter intervals result in faster retries but increased network traffic; longer intervals reduce network load but slow down discovery.
8. Set the **Connection Timeout After** to define how long DISCOVER will continue attempting to connect before marking the target as unreachable.
9. Click **Save**.

DISCOVER will begin attempting to connect to devices within the specified IP range. The discovery job appears in the Target Discovery list.

## Add Services

Services are cloud-based endpoints that DISCOVER can access and scan for sensitive data. Unlike devices (which are physical or virtual machines), services are cloud applications accessed through APIs. These include Microsoft 365 services (Exchange Online and SharePoint Online) and Google Workspace Services (Gmail and Google Drive).

{% hint style="info" %}
Before adding Microsoft 365 services, complete the [Microsoft 365 integration](/documentation/management-console/integrations/microsoft-365). Before adding Google Workspace services, complete the [Google Workspace integration](/documentation/management-console/integrations/google-workspace).
{% endhint %}

![](https://4044942488-files.gitbook.io/~/files/v0/b/gitbook-x-prod.appspot.com/o/spaces%2FPtAo3ilfcIjmOhwnXZVf%2Fuploads%2FE5dp2XZms82nQwsTzP0S%2FUnknown%20image?alt=media\&token=f778be9c-f8a2-4994-a501-7273402f6548)

1. Navigate to **DISCOVER** > **Target Discovery** > **Services** and click **+Discover New Target**.
2. Enter a descriptive **Discovery Job** name for the cloud service discovery task (e.g., "*Exchange Online - Finance Department*", "*SharePoint - HR Site Collection*").
3. Depending on which cloud connector you selected, you'll need to provide specific credentials and configurations:

<details>

<summary><strong>Exchange</strong></summary>

* **Exchange Tenant ID:** Your organisation's Azure AD Tenant ID, found in the Azure portal under **Microsoft Entra ID** > **Overview**.<br>

<img src="https://4044942488-files.gitbook.io/~/files/v0/b/gitbook-x-prod.appspot.com/o/spaces%2FPtAo3ilfcIjmOhwnXZVf%2Fuploads%2FGbipJYA4whWFfUNVUSHJ%2FUnknown%20image?alt=media&amp;token=3b993b37-0a7a-4e81-86b1-af3fc552af06" alt="" width="563">

* **Exchange Client ID:** The Application (Client) ID of your registered Exchange application in Azure AD, found under **Microsoft Entra ID** > **App registrations** > your application.<br>

  <img src="https://4044942488-files.gitbook.io/~/files/v0/b/gitbook-x-prod.appspot.com/o/spaces%2FPtAo3ilfcIjmOhwnXZVf%2Fuploads%2FCdtdaFwXVUBfdjp9bNdq%2FUnknown%20image?alt=media&amp;token=33de8753-57ad-45fa-b253-2b970c2e7d6b" alt="" width="563">

</details>

<details>

<summary><strong>SharePoint</strong></summary>

* **SharePoint Organisation:** The first part of your SharePoint URL (e.g., if your URL is `https://organisation.sharepoint.com`, enter `organisation`).
* **SharePoint Tenant ID:** Same as Exchange Tenant ID.
* **SharePoint Client ID:** The Application (Client) ID of your registered SharePoint application in Azure AD.

4. Set the **Location** to filter the list of Scanning Servers by their assigned location, similar to device discovery.
5. Choose how DISCOVER will authenticate to the cloud service:
   1. **Client Secret:** Enter the secret key (password) generated for the registered application in Azure AD. Client secrets expire periodically and must be renewed before expiry to avoid losing connectivity.<br>

      <figure><img src="https://4044942488-files.gitbook.io/~/files/v0/b/gitbook-x-prod.appspot.com/o/spaces%2FPtAo3ilfcIjmOhwnXZVf%2Fuploads%2F7ZTrDimxHIL9YRZmIAbU%2FUnknown%20image?alt=media&amp;token=724f6d03-dc06-45ea-b402-b2401fdece46" alt="" width="563"><figcaption></figcaption></figure>
   2. **Client Certificate (Recommended for Security):** Upload a `.pfx` or `.cer` certificate file registered with your Azure AD application. Certificates are more secure than client secrets, cannot be easily copied or intercepted, and can be revoked immediately if compromised.

</details>

<details>

<summary><strong>Gmail</strong></summary>

{% hint style="warning" %}
If updating an existing configuration, leave the **Service Account Key (JSON)** field blank to keep the existing key.
{% endhint %}

1. In the Cloud Connector dropdown, select **Gmail.** Two additional fields appear.
2. Enter the following information:

   <table><thead><tr><th width="180">Field</th><th>Description</th></tr></thead><tbody><tr><td>Admin Email</td><td>The Google Workspace super admin's email address (e.g. <code>admin@yourcompany.com</code>). DISCOVER uses this to identify the Workspace domain to scan.</td></tr><tr><td>Service Account Key (JSON)</td><td>Paste the contents of the JSON key file downloaded from Google Cloud Console.</td></tr></tbody></table>

</details>

<details>

<summary><strong>Google Drive</strong></summary>

{% hint style="warning" %}
If updating an existing configuration, leave the **Service Account Key (JSON)** field blank to keep the existing key.
{% endhint %}

1. In the Cloud Connector dropdown, select **Google Drive**. Two additional fields appear.
2. Enter the following information:

   <table><thead><tr><th width="180">Field</th><th>Description</th></tr></thead><tbody><tr><td>Admin Email</td><td>The Google Workspace super admin's email address (e.g. <code>admin@yourcompany.com</code>). DISCOVER uses this to identify the Workspace domain to scan.</td></tr><tr><td>Service Account Key (JSON)</td><td>Paste the contents of the JSON key file downloaded from Google Cloud Console.</td></tr></tbody></table>

</details>

4. Set the **Connection Retry Frequency** to define how often DISCOVER will attempt to reconnect if the initial connection fails. Shorter intervals result in faster retries but increased network traffic; longer intervals reduce network load but slow down discovery.
5. Set the **Connection Timeout After** to define how long DISCOVER will continue attempting to connect before marking the target as unreachable.
6. Click **Save**.

DISCOVER will attempt to connect to the cloud service using the provided credentials. Once connected, it retrieves a list of accessible mailboxes (for Exchange) or site collections and document libraries (for SharePoint). These appear in **DISCOVER** > **Target Discovery** > **Devices/Services Found**.

## Additional Features

After initiating discovery jobs, you have access to the following features in the Target Discovery page:

![](https://4044942488-files.gitbook.io/~/files/v0/b/gitbook-x-prod.appspot.com/o/spaces%2FPtAo3ilfcIjmOhwnXZVf%2Fuploads%2FtIbFg4hHnVy4KxWb53SJ%2FUnknown%20image?alt=media\&token=81dbe0c1-6d1d-43d9-884d-ef818c0d8c7c)

### Edit Target Discovery

1. Navigate to **DISCOVER** > **Target Discovery**.
2. Click **Edit** <i class="fa-pencil" style="color:blue;">:pencil:</i> on the discovery job you want to modify.
3. Make the necessary changes to any of the fields (IP range, credentials, cloud connector settings, etc.) following the same guidelines as when you created the discovery job.
4. Click **Save** to apply the changes.

### Delete Target Discovery

1. Navigate to **DISCOVER** > **Target Discovery**.
2. Click **Delete** <i class="fa-trash-can" style="color:$danger;">:trash-can:</i> on the discovery job you want to remove.
3. Click **Confirm** to permanently delete the discovery job.

### Rediscover Targets

Use Rediscover when devices in the original discovery range were unavailable, out of range, or temporarily unreachable during the first run. Any newly found targets are added to the **Devices/Services Found** list.

1. Navigate to **DISCOVER** > **Target Discovery**.
2. Locate the completed discovery job and click **Rediscover** <i class="fa-arrows-rotate">:arrows-rotate:</i>.
3. The job restarts with the same settings and parameters.

{% hint style="info" %}
Rediscover is available only after the original target discovery job completes. You cannot change the settings or target discovery parameters during Rediscover.
{% endhint %}


# Devices/Services Found

Devices/Services Found is the inventory of all targets that the agent has successfully identified. Each entry shows the hostname or service name, the discovery job name, the assigned agent, the category, the last activity, and the status. Use the filter options at the top of the page to narrow the list by hostname, scan name, scanning agent, or category.

![](https://4044942488-files.gitbook.io/~/files/v0/b/gitbook-x-prod.appspot.com/o/spaces%2FPtAo3ilfcIjmOhwnXZVf%2Fuploads%2FuTq3GpLSXmThiPnCUpf8%2FUnknown%20image?alt=media\&token=9a9a5431-6bc1-41a5-a451-2abcf36bf08a)

## Reassign Agent

Reassigning a scanning agent changes which agent is responsible for a target. Do this when the original scanning agent is overloaded, and you want to balance workload, a target has moved to a network segment closer to a different scanning agent, or the original agent is being decommissioned.

![](https://4044942488-files.gitbook.io/~/files/v0/b/gitbook-x-prod.appspot.com/o/spaces%2FPtAo3ilfcIjmOhwnXZVf%2Fuploads%2F7jZXfu6rOt1POpmjek5x%2FUnknown%20image?alt=media\&token=48d4abdb-0bec-479d-a21d-edce21bf9c6e)

1. Navigate to **DISCOVER** > **Devices/Services Found**.
2. Check the boxes next to the targets you want to reassign. Multiple targets can be selected at once, including targets currently assigned to different agents.
3. Click **+Re-assign Agent**.
4. Select the new scanning agent from the pop-up and click **Save**, then **Assign**.<br>

   <div align="left"><img src="https://4044942488-files.gitbook.io/~/files/v0/b/gitbook-x-prod.appspot.com/o/spaces%2FPtAo3ilfcIjmOhwnXZVf%2Fuploads%2FstWBzpsd9jIJtxpBTVJt%2FUnknown%20image?alt=media&amp;token=fa8f807b-c63c-44f6-ba1e-9e24db8daa66" alt=""></div>

{% hint style="info" %}
You can reassign multiple devices to an agent at once. Devices already assigned to the selected agent are skipped. After reassignment, all future scans for those devices are handled by the new scanning agent.
{% endhint %}


# Scans

{% embed url="<https://www.youtube.com/watch?t=32s&v=Bc_AQw5nzc0>" %}

Configure and run a scan on any discovered device or service. DISCOVER offers two scans types:

* [**One Time**](#one-time-scan), which runs a single, non-recurring scan on selected devices, services, and data types.
* [**Ongoing**](#ongoing-scan), which runs a repeating, recurring scan on selected devices, services, and data types.

The location of the Scanning Agent determines whether the scan runs using the Local Scanning or Remote Scanning architecture.

<table><thead><tr><th width="143">Specifics</th><th width="212">Local Scanning</th><th>Remote Scanning</th></tr></thead><tbody><tr><td><strong>How it works</strong></td><td>Agent is installed on the target device itself</td><td>Scanning Agent is installed on a separate host or a virtual machine (Scanning Server).</td></tr><tr><td><strong>What it scans</strong></td><td>The device's own local files</td><td>Other devices, file shares, or cloud services across the network</td></tr><tr><td><strong>Best for</strong></td><td>Single device coverage</td><td>Scanning multiple targets from one central host (Scanning Server).</td></tr></tbody></table>

## One Time Scan

Create and run a One Time Scan to investigate a specific device or service, test new data type configurations, perform an ad-hoc compliance check, or scan a newly discovered device before adding it to ongoing monitoring.

{% stepper %}
{% step %}

### Select the scan

1. Navigate to **DISCOVER** > **Scans** and click **+New Scan**.

   <div align="left"><figure><img src="https://4044942488-files.gitbook.io/~/files/v0/b/gitbook-x-prod.appspot.com/o/spaces%2FPtAo3ilfcIjmOhwnXZVf%2Fuploads%2FIE7LpAmhnP7pnaZZIOqz%2Fimage.png?alt=media&amp;token=33312c28-c94e-4556-8593-7cd4c108a2d5" alt="" width="524"><figcaption></figcaption></figure></div>
2. Select **One Time Scan** and click **Proceed**.<br>

   <div align="left"><figure><img src="https://4044942488-files.gitbook.io/~/files/v0/b/gitbook-x-prod.appspot.com/o/spaces%2FPtAo3ilfcIjmOhwnXZVf%2Fuploads%2FGwVDbOu4u05lW3W9kwqx%2Fimage.png?alt=media&amp;token=5e8b42d5-ffe7-41bc-84e0-2470e664c3da" alt="" width="563"><figcaption></figcaption></figure></div>
3. Enter a **Scan Name** that clearly identifies the purpose of the scan (e.g., *Finance SharePoint - Credit Card Check*).
4. Add an optional **Description** for context and click **Next**.<br>

   <div align="left"><figure><img src="https://4044942488-files.gitbook.io/~/files/v0/b/gitbook-x-prod.appspot.com/o/spaces%2FPtAo3ilfcIjmOhwnXZVf%2Fuploads%2F8bTfgs3pHnvnDSCTFCFK%2Fimage.png?alt=media&amp;token=6bb5f80e-7b53-4d94-b5ab-2dd8434f4d33" alt="" width="458"><figcaption></figcaption></figure></div>

{% endstep %}

{% step %}

### Select data types

After entering the scan name, select the data types to include in the scan.

1. Use **Data Type Groups** to select every data type in an existing group. Groups provide a quick template for common selections.
2. Use **Data Types** to select individual data types. Use the search box and **Filter** to locate them.

   <div align="left"><figure><img src="https://4044942488-files.gitbook.io/~/files/v0/b/gitbook-x-prod.appspot.com/o/spaces%2FPtAo3ilfcIjmOhwnXZVf%2Fuploads%2FXAYwpARMwMCopTCHRSbW%2Fimage.png?alt=media&amp;token=0c6cc7a8-816a-4936-84ef-2a4c271d91b6" alt="" width="543"><figcaption></figcaption></figure></div>
3. Both tabs work together. Selecting a group adds all its data types. Selecting individual data types adds them to the same selection.
4. Deselecting a data type included by a group breaks that group selection. The remaining selected data types stay selected.
5. Click **Next** after selecting the desired data types.
   {% endstep %}

{% step %}

### Select devices and services

1. Select the devices and services to scan. You can include multiple device or service types in the same scan job (for example, devices and Exchange mailboxes together), each spread across its own tab.

   <table><thead><tr><th width="148">Target type</th><th>Displays</th></tr></thead><tbody><tr><td><strong>Exchange</strong></td><td>Displays all discovered Exchange Online mailboxes.</td></tr><tr><td><strong>Devices</strong></td><td>Displays all discovered devices (workstations, laptops, file servers).</td></tr><tr><td><strong>SharePoint</strong></td><td>Displays all discovered SharePoint Online sites and document libraries.</td></tr><tr><td><strong>Gmail</strong></td><td>Displays all discovered Gmail mailboxes.</td></tr><tr><td><strong>Google Drive</strong></td><td>Displays all discovered Google Drive hosts and document libraries.</td></tr></tbody></table>
2. After selecting the desired targets, click **Next**.<br>

   <div align="left"><figure><img src="https://4044942488-files.gitbook.io/~/files/v0/b/gitbook-x-prod.appspot.com/o/spaces%2FPtAo3ilfcIjmOhwnXZVf%2Fuploads%2FhXVC1VwNNkv1mTKtcKMc%2Fimage.png?alt=media&amp;token=8b091cb6-02e7-4aeb-9d6d-0a6cd5cfd911" alt="" width="563"><figcaption></figcaption></figure></div>

{% endstep %}

{% step %}

### Configure file handling options

Configure how DISCOVER processes archives, images, documents, and classification labels during a scan.

* **Archive File Handling:** Enable to process compressed files (ZIP, RAR, 7z, etc.). When enabled, DISCOVER extracts and scans the contents of archive files. When disabled, archive files are skipped.

  <div align="left"><figure><img src="https://4044942488-files.gitbook.io/~/files/v0/b/gitbook-x-prod.appspot.com/o/spaces%2FPtAo3ilfcIjmOhwnXZVf%2Fuploads%2F5hC1i4PKVbusZWY11koi%2Fimage.png?alt=media&amp;token=d2e0f067-c6ed-4520-aa41-f09abb6eb812" alt="" width="317"><figcaption></figcaption></figure></div>
* **File date filter:** Limit scanning to files matching a specific date attribute and condition. For example, before decommissioning an old file server, set Attribute to **Last accessed date**, Condition to **Older than**, and the date to two years back, to catch every file nobody has touched since and confirm nothing important gets lost before deletion.

  <figure><img src="https://4044942488-files.gitbook.io/~/files/v0/b/gitbook-x-prod.appspot.com/o/spaces%2FPtAo3ilfcIjmOhwnXZVf%2Fuploads%2FtLzWFStSbGpn8uvnC9ZP%2Fimage.png?alt=media&amp;token=f653613c-0e05-4002-94c2-a86913cccc9a" alt="" width="563"><figcaption></figcaption></figure>

  \
  Selecting **Between** opens a second date field for a start and end date. All other conditions use a single date field.

  <table><thead><tr><th width="147">Field</th><th>Options</th></tr></thead><tbody><tr><td>Date Attributes</td><td>Modification date, Creation date, Last accessed date</td></tr><tr><td>Conditions</td><td>Older than, Newer than, Equal to, Between</td></tr></tbody></table>
* **Fetch MIP Sensitivity labels:** Enable to extract the MIP Sensitivity labels from files during scanning.<br>

  <div align="left"><figure><img src="https://4044942488-files.gitbook.io/~/files/v0/b/gitbook-x-prod.appspot.com/o/spaces%2FPtAo3ilfcIjmOhwnXZVf%2Fuploads%2FOK0wNTMvU7uB7mQYg23M%2Fimage.png?alt=media&amp;token=058680c9-9185-45c4-a330-b9a5a61a8c76" alt="" width="377"><figcaption></figcaption></figure></div>
* **OCR for Images:** Enable to extract and scan text from image files (JPG, PNG, GIF). Enable if sensitive data may exist in screenshots or photographed documents.

  <div align="left"><figure><img src="https://4044942488-files.gitbook.io/~/files/v0/b/gitbook-x-prod.appspot.com/o/spaces%2FPtAo3ilfcIjmOhwnXZVf%2Fuploads%2FFVbROs2bHsfenjU86FRS%2Fimage.png?alt=media&amp;token=4d0cda36-0320-4d34-8332-29f450e0cea2" alt="" width="333"><figcaption></figcaption></figure></div>
* **OCR for Documents:** Enable to extract text from PDFs, TIFF files, and other supported document formats.

  <div align="left"><figure><img src="https://4044942488-files.gitbook.io/~/files/v0/b/gitbook-x-prod.appspot.com/o/spaces%2FPtAo3ilfcIjmOhwnXZVf%2Fuploads%2FCykSgifMBUIRxoQgtGWr%2Fimage.png?alt=media&amp;token=cfab2841-a3a0-4e72-9959-a6e9d688d7ee" alt="" width="356"><figcaption></figcaption></figure></div>
* **Scan and Classify:** Enable to automatically apply a classification label to each file based on the most sensitive data detected during a scan.
  * **Overwrite Existing Classifications:**
    * Select **Overwrite** to replace the existing file classification label(s).
    * Select **Do Not Overwrite** to keep the existing label(s) unchanged.<br>

      <figure><img src="https://4044942488-files.gitbook.io/~/files/v0/b/gitbook-x-prod.appspot.com/o/spaces%2FPtAo3ilfcIjmOhwnXZVf%2Fuploads%2Fke7UUiZzpvzPqaRIhpIm%2Fimage.png?alt=media&amp;token=e8348f6c-f19e-487d-9dd6-08228ae72757" alt="" width="563"><figcaption></figcaption></figure>
  * **Classify Method:**
    * Select **Classify Using Data Type** to apply the label mapped to the matched data type.
    * Select **Classify Using** to choose whether custom labels or Microsoft Purview-synced labels are applied to all scanned files, regardless of their sensitivity.<br>

      <div align="left"><figure><img src="https://4044942488-files.gitbook.io/~/files/v0/b/gitbook-x-prod.appspot.com/o/spaces%2FPtAo3ilfcIjmOhwnXZVf%2Fuploads%2F4958RIAYvga1nX3v6jbA%2Fimage.png?alt=media&amp;token=8f493e10-f3ab-4115-aaa5-c416cc84fbd5" alt="" width="563"><figcaption></figcaption></figure></div>
* **Select Start Date:** For email scans, specify a start date to scan only messages received after that date. Set this to a reasonable timeframe (e.g., the past 90 days) unless historical email coverage is required.<br>

  <div align="left"><figure><img src="https://4044942488-files.gitbook.io/~/files/v0/b/gitbook-x-prod.appspot.com/o/spaces%2FPtAo3ilfcIjmOhwnXZVf%2Fuploads%2FV3G4wELIZFWGypYUFWHq%2Fimage.png?alt=media&amp;token=753577e2-5a72-4a06-882a-932ae01b0c5c" alt="" width="508"><figcaption></figcaption></figure></div>

{% endstep %}

{% step %}

### Filter directories and file types

{% hint style="warning" %}
If you skip this configuration, DISCOVER **will scan all folders and file types** in every selected target for sensitive data.
{% endhint %}

This setting allows you to include or exclude specific folders and file types from the scan. You have multiple options for controlling which folders and file types are scanned:

#### Scan only the selected folders and file types

Limit the scan to specific locations and file formats. Only what you explicitly select is scanned. Use this when you already know where sensitive data is likely to exist and want to focus the scan there instead of scanning everything.

<div align="left"><figure><img src="https://4044942488-files.gitbook.io/~/files/v0/b/gitbook-x-prod.appspot.com/o/spaces%2FPtAo3ilfcIjmOhwnXZVf%2Fuploads%2Fxmlt4c9MTTTTlFsFPpRG%2FUnknown%20image?alt=media&amp;token=3de189ee-cbcf-4c76-ae3f-e1512d546d5e" alt="" width="563"><figcaption></figcaption></figure></div>

* **Include System Folders (Toggle):** Enable to include Windows system folders (`C:\Windows`, `C:\Program Files`). This is generally not recommended unless you need to scan system folders.
* **Custom Folder Path:** Click **+Add** to include folders to scan. Enter the full path (e.g., `C:\Users\Public\Documents`, `\\fileserver\HR\Payroll`). Add multiple paths as needed. Only these folders are scanned.
* **Include All File Types (Toggle):** Enable to scan all supported formats (documents, spreadsheets, presentations, images, archives, emails). Disable it to limit scanning to specific extensions only.
* **Include Custom File Types:** Click **+Add** to specify extensions to scan uncommon or proprietary file extensions not in DISCOVER's file type list. Only files having these extensions will be scanned.

#### Scan all content except the selected folders and file types

Scan everything except selected folders or file types. Use this when you want broad coverage while skipping known irrelevant areas, such as system folders, logs, or temporary folders.

<div align="left"><figure><img src="https://4044942488-files.gitbook.io/~/files/v0/b/gitbook-x-prod.appspot.com/o/spaces%2FPtAo3ilfcIjmOhwnXZVf%2Fuploads%2F5REXqTnmZe8pswQqfK7V%2FUnknown%20image?alt=media&amp;token=dcddac76-c0f9-43bc-83c2-6c7c864d4e84" alt="" width="563"><figcaption></figcaption></figure></div>

* **Exclude System Folders (Toggle):** Enable to skip all Windows system folders. This is recommended for most scans, as system folders rarely contain user-generated sensitive data.
* **Exclude Custom Folder Path:** Click **+Add** to specify folders to exclude. Enter the full path (e.g., `C:\Windows\Temp`, `\\fileserver\Backups`, `D:\Logs`). These folders are skipped during the scan.
* **Exclude All File Types (Toggle):** Enable to skip file content scanning entirely and examine only file metadata, such as filenames and paths. This is rarely used and typically needed only for filename-based data types.
* **Exclude Custom File Types:** Click **+Add** to specify extensions to exclude uncommon or proprietary extensions you don't want scanned (e.g., `.backup`, `.cache`).

1. Click **Next** to proceed.
   {% endstep %}

{% step %}

### Review and execute scan

1. Review the scan configuration summary.
2. Click **Save**. The scan starts automatically and appears in the Scans list with a status indicator.
3. Once the scan is running or complete, use the additional scan controls to pause, resume, delete, or terminate the scan, or to view its results and details.
   {% endstep %}
   {% endstepper %}

## Ongoing Scan

Use **Ongoing Scan** when you need continuous, scheduled monitoring rather than a one-off check. It keeps scanning the same targets over time, helps establish a baseline for sensitive-data exposure, tracks changes, and catches newly introduced sensitive files for routine compliance.

{% stepper %}
{% step %}

### Select the scan

1. Navigate to **DISCOVER** > **Scans** and click **+New Scan**.
2. Select **Ongoing Scan** and click **Proceed**.<br>

   <div align="left"><img src="https://4044942488-files.gitbook.io/~/files/v0/b/gitbook-x-prod.appspot.com/o/spaces%2FPtAo3ilfcIjmOhwnXZVf%2Fuploads%2FeLEOyMdzRhldS0liEgJY%2FUnknown%20image?alt=media&amp;token=bf363664-652e-4c09-9240-7aa098643546" alt="" width="563"></div>
3. Select the data types to include in the scan:
   * Use **Data Type Groups** to select every data type in an existing group.
   * Use **Data Types** for granular, individual selections.
   * Both tabs work together. Selecting a group adds all its data types. Any individual selections add to that selection.
   * Deselecting a data type included by a group breaks that group selection. The remaining selected data types stay selected.
4. Click **Next**.<br>

   <div align="left"><figure><img src="https://4044942488-files.gitbook.io/~/files/v0/b/gitbook-x-prod.appspot.com/o/spaces%2FPtAo3ilfcIjmOhwnXZVf%2Fuploads%2FkVhLr8mw7JHYtXnHg4Y8%2FUnknown%20image?alt=media&amp;token=77f6f32b-f7e6-4b86-ac43-95c3a95bf357" alt="" width="563"><figcaption></figcaption></figure></div>

{% endstep %}

{% step %}

### Select devices and services

1. Select the devices and services to scan. You can include multiple device or service types in the same scan job (for example, devices and Exchange mailboxes together), each spread across its own tab.

   <table><thead><tr><th width="148">Target type</th><th>Displays</th></tr></thead><tbody><tr><td><strong>Exchange</strong></td><td>Displays all discovered Exchange Online mailboxes.</td></tr><tr><td><strong>Devices</strong></td><td>Displays all discovered devices (workstations, laptops, file servers).</td></tr><tr><td><strong>SharePoint</strong></td><td>Displays all discovered SharePoint Online sites and document libraries.</td></tr><tr><td><strong>Gmail</strong></td><td>Displays all discovered Gmail mailboxes.</td></tr><tr><td><strong>Google Drive</strong></td><td>Displays all discovered Google Drive hosts and document libraries.</td></tr></tbody></table>
2. By default, all targets are selected. Deselect any unnecessary targets and click **Next**.<br>

   <div align="left"><figure><img src="https://4044942488-files.gitbook.io/~/files/v0/b/gitbook-x-prod.appspot.com/o/spaces%2FPtAo3ilfcIjmOhwnXZVf%2Fuploads%2FdvqFuz4qsED4IuzM6J6i%2Fimage.png?alt=media&amp;token=8bf2d41e-4ac6-40b3-8065-3d59ba7cd08b" alt="" width="563"><figcaption></figcaption></figure></div>

{% endstep %}

{% step %}

### Configure file handling options

Configure how DISCOVER processes archives, images, documents, and classification labels during a scan.

* **Archive File Handling:** Enable to process compressed files (ZIP, RAR, 7z, etc.). When enabled, DISCOVER extracts and scans the contents of archive files. When disabled, archive files are skipped.

  <div align="left"><figure><img src="https://4044942488-files.gitbook.io/~/files/v0/b/gitbook-x-prod.appspot.com/o/spaces%2FPtAo3ilfcIjmOhwnXZVf%2Fuploads%2F5hC1i4PKVbusZWY11koi%2Fimage.png?alt=media&amp;token=d2e0f067-c6ed-4520-aa41-f09abb6eb812" alt="" width="317"><figcaption></figcaption></figure></div>
* **File date filter:** Limit scanning to files matching a specific date attribute and condition. For example, before decommissioning an old file server, set Attribute to **Last accessed date**, Condition to **Older than**, and the date to two years back, to catch every file nobody has touched since and confirm nothing important gets lost before deletion.

  <figure><img src="https://4044942488-files.gitbook.io/~/files/v0/b/gitbook-x-prod.appspot.com/o/spaces%2FPtAo3ilfcIjmOhwnXZVf%2Fuploads%2FtLzWFStSbGpn8uvnC9ZP%2Fimage.png?alt=media&amp;token=f653613c-0e05-4002-94c2-a86913cccc9a" alt="" width="563"><figcaption></figcaption></figure>

  \
  Selecting **Between** opens a second date field for a start and end date. All other conditions use a single date field.

  <table><thead><tr><th width="147">Field</th><th>Options</th></tr></thead><tbody><tr><td>Date Attributes</td><td>Modification date, Creation date, Last accessed date</td></tr><tr><td>Conditions</td><td>Older than, Newer than, Equal to, Between</td></tr></tbody></table>
* **Fetch MIP Sensitivity labels:** Enable to extract the MIP Sensitivity labels from files during scanning.<br>

  <div align="left"><figure><img src="https://4044942488-files.gitbook.io/~/files/v0/b/gitbook-x-prod.appspot.com/o/spaces%2FPtAo3ilfcIjmOhwnXZVf%2Fuploads%2FOK0wNTMvU7uB7mQYg23M%2Fimage.png?alt=media&amp;token=058680c9-9185-45c4-a330-b9a5a61a8c76" alt="" width="377"><figcaption></figcaption></figure></div>
* **OCR for Images:** Enable to extract and scan text from image files (JPG, PNG, GIF). Enable if sensitive data may exist in screenshots or photographed documents.

  <div align="left"><figure><img src="https://4044942488-files.gitbook.io/~/files/v0/b/gitbook-x-prod.appspot.com/o/spaces%2FPtAo3ilfcIjmOhwnXZVf%2Fuploads%2FFVbROs2bHsfenjU86FRS%2Fimage.png?alt=media&amp;token=4d0cda36-0320-4d34-8332-29f450e0cea2" alt="" width="333"><figcaption></figcaption></figure></div>
* **OCR for Documents:** Enable to extract text from PDFs, TIFF files, and other supported document formats.

  <div align="left"><figure><img src="https://4044942488-files.gitbook.io/~/files/v0/b/gitbook-x-prod.appspot.com/o/spaces%2FPtAo3ilfcIjmOhwnXZVf%2Fuploads%2FCykSgifMBUIRxoQgtGWr%2Fimage.png?alt=media&amp;token=cfab2841-a3a0-4e72-9959-a6e9d688d7ee" alt="" width="356"><figcaption></figcaption></figure></div>
* **Auto Scan Newly Discovered Device:** Enable to automatically include devices and services discovered after the scan is created. On each scheduled run, any newly discovered targets are added to the scan automatically.<br>

  <div align="left"><figure><img src="https://4044942488-files.gitbook.io/~/files/v0/b/gitbook-x-prod.appspot.com/o/spaces%2FPtAo3ilfcIjmOhwnXZVf%2Fuploads%2FZWa4RmtbqWJV9CTOD29d%2Fimage.png?alt=media&amp;token=7e4f9797-991c-4a3b-b519-4d9b450dee56" alt="" width="344"><figcaption></figcaption></figure></div>
* **Enable New Files Since Last Scan:** Enable this to scan only files that have been created or modified since the last time this target was scanned. This significantly speeds up subsequent scans by skipping unchanged files.<br>

  <div align="left"><figure><img src="https://4044942488-files.gitbook.io/~/files/v0/b/gitbook-x-prod.appspot.com/o/spaces%2FPtAo3ilfcIjmOhwnXZVf%2Fuploads%2FbitAZdusFBGlwFVX8dEh%2Fimage.png?alt=media&amp;token=cbcc2e26-9fb7-4fb8-83b6-94c5a8b26492" alt="" width="303"><figcaption></figcaption></figure></div>
* **Scan and Classify:** Enable to automatically apply a classification label to each file based on the most sensitive data detected during a scan.
  * **Overwrite Existing Classifications:**
    * Select **Overwrite** to replace the existing file classification label(s).
    * Select **Do Not Overwrite** to keep the existing label(s) unchanged.<br>

      <figure><img src="https://4044942488-files.gitbook.io/~/files/v0/b/gitbook-x-prod.appspot.com/o/spaces%2FPtAo3ilfcIjmOhwnXZVf%2Fuploads%2Fke7UUiZzpvzPqaRIhpIm%2Fimage.png?alt=media&amp;token=e8348f6c-f19e-487d-9dd6-08228ae72757" alt="" width="563"><figcaption></figcaption></figure>
  * **Classify Method:**
    * Select **Classify Using Data Type** to apply the label mapped to the matched data type.
    * Select **Classify Using** to choose whether custom labels or Microsoft Purview-synced labels are applied to all scanned files, regardless of their sensitivity.<br>

      <div align="left"><figure><img src="https://4044942488-files.gitbook.io/~/files/v0/b/gitbook-x-prod.appspot.com/o/spaces%2FPtAo3ilfcIjmOhwnXZVf%2Fuploads%2F4958RIAYvga1nX3v6jbA%2Fimage.png?alt=media&amp;token=8f493e10-f3ab-4115-aaa5-c416cc84fbd5" alt="" width="563"><figcaption></figcaption></figure></div>
* **Select Start Date:** For email scans, specify a start date to scan only messages received after that date. Set this to a reasonable timeframe (e.g., the past 90 days) unless historical email coverage is required.<br>

  <div align="left"><figure><img src="https://4044942488-files.gitbook.io/~/files/v0/b/gitbook-x-prod.appspot.com/o/spaces%2FPtAo3ilfcIjmOhwnXZVf%2Fuploads%2FV3G4wELIZFWGypYUFWHq%2Fimage.png?alt=media&amp;token=753577e2-5a72-4a06-882a-932ae01b0c5c" alt="" width="508"><figcaption></figcaption></figure></div>

{% endstep %}

{% step %}

### Filter directories and file types

{% hint style="warning" %}
If you skip this configuration, DISCOVER **will scan all folders and file types** in every selected target for sensitive data.
{% endhint %}

This setting allows you to include or exclude specific folders and file types from the scan. You have multiple options for controlling which folders and file types are scanned:

#### Scan only the selected folders and file types

Limit the scan to specific locations and file formats. Only what you explicitly select is scanned. Use this when you already know where sensitive data is likely to exist and want to focus the scan there instead of scanning everything.

<div align="left"><figure><img src="https://4044942488-files.gitbook.io/~/files/v0/b/gitbook-x-prod.appspot.com/o/spaces%2FPtAo3ilfcIjmOhwnXZVf%2Fuploads%2Fxmlt4c9MTTTTlFsFPpRG%2FUnknown%20image?alt=media&amp;token=3de189ee-cbcf-4c76-ae3f-e1512d546d5e" alt="" width="563"><figcaption></figcaption></figure></div>

* **Include System Folders (Toggle):** Enable to include Windows system folders (`C:\Windows`, `C:\Program Files`). This is generally not recommended unless you need to scan system folders.
* **Custom Folder Path:** Click **+Add** to include folders to scan. Enter the full path (e.g., `C:\Users\Public\Documents`, `\\fileserver\HR\Payroll`). Add multiple paths as needed. Only these folders are scanned.
* **Include All File Types (Toggle):** Enable to scan all supported formats (documents, spreadsheets, presentations, images, archives, emails). Disable it to limit scanning to specific extensions only.
* **Include Custom File Types:** Click **+Add** to specify extensions to scan uncommon or proprietary file extensions not in DISCOVER's file type list. Only files having these extensions will be scanned.

#### Scan all content except the selected folders and file types

Scan everything except selected folders or file types. Use this when you want broad coverage while skipping known irrelevant areas, such as system folders, logs, or temporary folders.

<div align="left"><figure><img src="https://4044942488-files.gitbook.io/~/files/v0/b/gitbook-x-prod.appspot.com/o/spaces%2FPtAo3ilfcIjmOhwnXZVf%2Fuploads%2F5REXqTnmZe8pswQqfK7V%2FUnknown%20image?alt=media&amp;token=dcddac76-c0f9-43bc-83c2-6c7c864d4e84" alt="" width="563"><figcaption></figcaption></figure></div>

* **Exclude System Folders (Toggle):** Enable to skip all Windows system folders. This is recommended for most scans, as system folders rarely contain user-generated sensitive data.
* **Exclude Custom Folder Path:** Click **+Add** to specify folders to exclude. Enter the full path (e.g., `C:\Windows\Temp`, `\\fileserver\Backups`, `D:\Logs`). These folders are skipped during the scan.
* **Exclude All File Types (Toggle):** Enable to skip file content scanning entirely and examine only file metadata, such as filenames and paths. This is rarely used and typically needed only for filename-based data types.
* **Exclude Custom File Types:** Click **+Add** to specify extensions to exclude uncommon or proprietary extensions you don't want scanned (e.g., `.backup`, `.cache`).

1. Click **Next** to proceed.
   {% endstep %}

{% step %}

### Set the schedule

Set a schedule to define when and how often the scan runs.

1. In the **Scan Frequency** field, enter how frequently the scan should run.
   1. **Select an interval:** Select the rate at which the scans repeat.
   2. **Select a time:** Select the time at which the scans start.\
      Example: Selecting **2** Months at **6:00 PM** repeats the ongoing scan every 2 months at 6:00 PM.<br>

      <div align="left"><figure><img src="https://4044942488-files.gitbook.io/~/files/v0/b/gitbook-x-prod.appspot.com/o/spaces%2FPtAo3ilfcIjmOhwnXZVf%2Fuploads%2FtNcYVAk2SP5rCbH0NhKu%2Fimage.png?alt=media&amp;token=3877006b-aca2-468f-9a34-692aefb9bd99" alt="" width="552"><figcaption></figcaption></figure></div>
2. Choose the **Scan Start** date
   1. **On Date:** Select a calendar date when the first scan should run. The scan will start on this date and then repeat according to the interval you set.
   2. **Relative Date:** Select a specific period and day (Monday, Tuesday, etc.) when scans should run. This is useful for scheduling scans during low-activity periods (e.g., every Sunday).

      <div align="left"><figure><img src="https://4044942488-files.gitbook.io/~/files/v0/b/gitbook-x-prod.appspot.com/o/spaces%2FPtAo3ilfcIjmOhwnXZVf%2Fuploads%2FcTlEQIEwTeU6YjLFwikZ%2Fimage.png?alt=media&amp;token=7640c6d4-3cbf-4f7f-9ff9-5f133c8c7f70" alt="" width="554"><figcaption></figcaption></figure></div>
3. Ongoing scans can be resource-intensive (high CPU usage, network traffic, disk I/O); it's best to schedule them during off-hours when they won't impact user productivity. Use the **Avoid Scans On** setting to define periods during which scheduled scans must not run, even if they are due to start.
   1. Click **+Add avoid window** to add a restriction.
   2. Select the day(s) of the week when scans should be avoided. Select the time range to avoid (e.g., 8:00 AM to 6:00 PM for business hours). You can add multiple avoid time windows to accommodate different schedules.<br>

      <div align="left"><figure><img src="https://4044942488-files.gitbook.io/~/files/v0/b/gitbook-x-prod.appspot.com/o/spaces%2FPtAo3ilfcIjmOhwnXZVf%2Fuploads%2Fb6xr6qOvstIgkUolJexA%2Fimage.png?alt=media&amp;token=0719a54c-dc3e-4a88-a645-ce54bab6f8c7" alt="" width="532"><figcaption></figcaption></figure></div>
4. Beside the schedule, you'll find the **Terminate Current Scan** toggle.
   1. Enable this option to stop any scan that is currently running when the newly configured ongoing scan starts.
   2. Leave this option disabled if you want the current scan to finish first.<br>

      <div align="left"><figure><img src="https://4044942488-files.gitbook.io/~/files/v0/b/gitbook-x-prod.appspot.com/o/spaces%2FPtAo3ilfcIjmOhwnXZVf%2Fuploads%2FllkCclebM1RaM3nVTN9o%2Fimage.png?alt=media&amp;token=cd9ac754-c25d-4623-a87c-2f271c0c13f6" alt="" width="391"><figcaption></figcaption></figure></div>

{% hint style="danger" %}
**Note when Terminate Current Scan is disabled:**

If the current scan runs past the scheduled start time of the new scan, the new scan will not run for that occurrence. It will wait until the next scheduled slot, whether that is the following week or month. This can create a gap in scheduled coverage, so keep this in mind when setting scan times.
{% endhint %}

5. Click **Next** to continue.

Once configured, the schedule runs automatically until the scan is disabled or deleted.
{% endstep %}

{% step %}

### Review and execute scan

1. Once the schedule is configured, review the scan configuration summary.
2. Click **Save**. The scan starts automatically and appears in the Scans list with a status indicator.
3. Once the scan is running or complete, use the additional scan controls to pause, resume, delete, or terminate the scan, or to view its results and details.
   {% endstep %}
   {% endstepper %}

## Additional Scan Controls

Manage a running or completed scan directly from the Scans list, including viewing its results and details, pausing, or resuming the scan.

<details>

<summary><strong>View Scan Results</strong></summary>

After the scan completes, click **View Result** to see the findings.

1. Navigate to **DISCOVER** > **Scans**.

<div align="left"><figure><img src="https://4044942488-files.gitbook.io/~/files/v0/b/gitbook-x-prod.appspot.com/o/spaces%2FPtAo3ilfcIjmOhwnXZVf%2Fuploads%2FpCDmHpcGF8z0H4jEGSxW%2Fimage.png?alt=media&amp;token=30966bb3-eb07-4567-8b57-cffccf011e7e" alt="" width="563"><figcaption></figcaption></figure></div>

2. Locate the completed scan and click **View Result**.
3. This opens the Results page filtered to show only findings from this specific scan (see the Results section below for detailed information on reviewing scan findings).

</details>

<details>

<summary><strong>View Scan Details</strong></summary>

1. Navigate to **DISCOVER** > **Scans**.
2. Locate the scan and click **View** <i class="fa-eye">:eye:</i> .<br>

   <div align="left"><figure><img src="https://4044942488-files.gitbook.io/~/files/v0/b/gitbook-x-prod.appspot.com/o/spaces%2FPtAo3ilfcIjmOhwnXZVf%2Fuploads%2FaEHGuah8Pm2g1mN3sBts%2Fimage.png?alt=media&amp;token=099aad8d-db13-423a-abd1-f2ac255ed3d2" alt="" width="563"><figcaption></figcaption></figure></div>
3. This displays the complete scan configuration.

</details>

<details>

<summary><strong>Pause a Scan</strong></summary>

1. Navigate to **DISCOVER** > **Scans**.
2. Locate the running scan and click **Pause** <i class="fa-pause">:pause:</i>.<br>

<div align="left"><figure><img src="https://4044942488-files.gitbook.io/~/files/v0/b/gitbook-x-prod.appspot.com/o/spaces%2FPtAo3ilfcIjmOhwnXZVf%2Fuploads%2F493CgLE4dRaqL9579xjS%2Fimage.png?alt=media&amp;token=eea6c33f-fe89-437a-b179-2b9b0e0bf4ff" alt="" width="563"><figcaption></figcaption></figure></div>

3. The scan immediately pauses and stops processing targets. Targets that have already been scanned retain their results. Targets not yet scanned remain in the queue.

</details>

<details>

<summary><strong>Resume a Scan</strong></summary>

1. Navigate to **DISCOVER** > **Scans**.
2. Locate the paused scan and click **Resume** <i class="fa-play">:play:</i>.<br>

   <div align="left"><figure><img src="https://4044942488-files.gitbook.io/~/files/v0/b/gitbook-x-prod.appspot.com/o/spaces%2FPtAo3ilfcIjmOhwnXZVf%2Fuploads%2FiHcJ42pjnHerAA7XpPhF%2Fimage.png?alt=media&amp;token=6a19ce24-e9df-402b-a070-5831b21be510" alt="" width="563"><figcaption></figcaption></figure></div>
3. The scan resumes from where it was paused, continuing to process remaining targets in the queue.

</details>

<details>

<summary><strong>Delete a Scan</strong></summary>

1. Navigate to **DISCOVER** > **Scans**.
2. Locate the scan you want to remove and click **Delete** <i class="fa-trash-can">:trash-can:</i>.

   <div align="left"><figure><img src="https://4044942488-files.gitbook.io/~/files/v0/b/gitbook-x-prod.appspot.com/o/spaces%2FPtAo3ilfcIjmOhwnXZVf%2Fuploads%2FmKHbwMZCUZ1QB6rUk8MV%2Fimage.png?alt=media&amp;token=7356f4a8-6772-49ba-acbc-30e972bceb63" alt="" width="563"><figcaption></figcaption></figure></div>
3. A confirmation prompt will appear. Click **Delete** to confirm.

   <div align="left"><figure><img src="https://4044942488-files.gitbook.io/~/files/v0/b/gitbook-x-prod.appspot.com/o/spaces%2FPtAo3ilfcIjmOhwnXZVf%2Fuploads%2F8dOYaMTasvJDgjyeWj2e%2FUnknown%20image?alt=media&amp;token=02ccc523-4453-49f9-8a1a-b85a1731d571" alt="" width="375"><figcaption></figcaption></figure></div>

</details>

<details>

<summary><strong>Terminate a Scan</strong></summary>

1. Navigate to **DISCOVER** > **Scans**.
2. Locate the running scan and click **Terminate** <i class="fa-circle-xmark">:circle-xmark:</i>.<br>

   <div align="left"><figure><img src="https://4044942488-files.gitbook.io/~/files/v0/b/gitbook-x-prod.appspot.com/o/spaces%2FPtAo3ilfcIjmOhwnXZVf%2Fuploads%2F3sV9mfEOEMmgOg1rx4k9%2Fimage.png?alt=media&amp;token=5c9002b0-ffd7-4fbd-b648-12981a234416" alt="" width="563"><figcaption></figcaption></figure></div>
3. A confirmation prompt will appear. Click **Terminate** to end the scan immediately.

   <div align="left"><figure><img src="https://4044942488-files.gitbook.io/~/files/v0/b/gitbook-x-prod.appspot.com/o/spaces%2FPtAo3ilfcIjmOhwnXZVf%2Fuploads%2F5jNjQfAcxa2ZPKpLnlWs%2FUnknown%20image?alt=media&amp;token=357e0731-24d3-4dbc-bc3d-c52fc90e9cff" alt="" width="375"><figcaption></figcaption></figure></div>

</details>


# Scan Performance

This page provides reference scan times for each supported file type and size, to help you estimate how long a scan job will take.

Benchmarks were run on Windows 11 over a high-speed broadband network, using a recommended specification of an 8-core CPU and 16 GB RAM. Scan time estimates are calculated using the formula: scan time = file size (MB) × averaged scan rate (s/MB), where the scan rate is derived from benchmarks across seven connectors and averaged per file type.&#x20;

These figures are intended as a general reference for a standard enterprise. Scan times will vary in practice depending on system load, file content, and network conditions.

### File Count vs File Size

Scan duration is affected by both the size and the number of files in scope. A single file will scan faster than multiple smaller files that add up to the same total size, due to the overhead of initiating a scan for each file. When planning a scan job, keep this in mind if your target directories contain a large number of small files.

### OCR Impact by File Type

Enabling OCR increases processing time to varying degrees depending on file type:

**No meaningful impact:** TXT, XML, DOC, RTF, ODT, PPTX, XLSX

**Moderate impact (10–15%):** DOCX (\~14%), XLS (\~15%), ODS (\~11%)

**Pronounced impact:** PPT (\~26% increase in processing time)

**Small impact:** HTML/HTM/MD (\~6% increase in processing time)

**Severe impact:** PDF (\~410% increase in processing time on average when OCR is enabled; impact is significantly higher for PDFs containing image-based pages such as scanned documents)

### Quick Reference: Relative Scan Speed

From fastest to slowest (OCR off): TXT, XLS, XML, DOC, RTF, ODS, PPTX, ODT, DOCX, XLSX, PPT, PDF, HTML/HTM/MD.

PDF and HTML/HTM/MD take significantly longer to scan than other formats, and their scan times vary considerably depending on file content. For details on what to expect, see the PDF, HTML, HTM, and MD sections below.

### Office documents

#### DOCX

| File size | OCR off   | OCR on    |
| --------- | --------- | --------- |
| \~51 KB   | \~0.1 sec | \~0.1 sec |
| \~737 KB  | \~1 sec   | \~2 sec   |
| \~3 MB    | \~6 sec   | \~6 sec   |
| \~6 MB    | \~11 sec  | \~13 sec  |
| \~22 MB   | \~42 sec  | \~47 sec  |

#### DOC (legacy Word)

| File size | OCR off   | OCR on    |
| --------- | --------- | --------- |
| \~133 KB  | \~0.1 sec | \~0.1 sec |
| \~2.5 MB  | \~2 sec   | \~2 sec   |
| \~8.5 MB  | \~6 sec   | \~5 sec   |

#### ODT

| File size | OCR off   | OCR on    |
| --------- | --------- | --------- |
| \~30 KB   | \~0.1 sec | \~0.1 sec |
| \~563 KB  | \~1 sec   | \~1 sec   |
| \~3 MB    | \~6 sec   | \~6 sec   |
| \~6 MB    | \~12 sec  | \~13 sec  |

### Spreadsheets

#### XLSX

| File size | OCR off   | OCR on    |
| --------- | --------- | --------- |
| \~25 KB   | \~0.1 sec | \~0.1 sec |
| \~1 MB    | \~2 sec   | \~3 sec   |
| \~4 MB    | \~10 sec  | \~10 sec  |
| \~6 MB    | \~15 sec  | \~15 sec  |
| \~33 MB   | \~1.3 min | \~1.4 min |

#### XLS (legacy Excel)

| File size | OCR off   | OCR on    |
| --------- | --------- | --------- |
| \~51 KB   | \~0.0 sec | \~0.0 sec |
| \~2.5 MB  | \~2 sec   | \~2 sec   |
| \~12.5 MB | \~8 sec   | \~10 sec  |
| \~70 MB   | \~47 sec  | \~54 sec  |

#### ODS

| File size | OCR off   | OCR on    |
| --------- | --------- | --------- |
| \~15 KB   | \~0.0 sec | \~0.0 sec |
| \~1 MB    | \~2 sec   | \~2 sec   |
| \~4 MB    | \~7 sec   | \~8 sec   |
| \~6 MB    | \~11 sec  | \~12 sec  |
| \~34 MB   | \~1.0 min | \~1.1 min |

### Presentations

#### PPTX

| File size | OCR off   | OCR on    |
| --------- | --------- | --------- |
| \~87 KB   | \~0.1 sec | \~0.1 sec |
| \~1.2 MB  | \~2 sec   | \~2 sec   |
| \~3 MB    | \~5 sec   | \~5 sec   |
| \~5 MB    | \~8 sec   | \~8 sec   |
| \~21 MB   | \~34 sec  | \~35 sec  |

#### PPT (legacy PowerPoint)

| File size | OCR off   | OCR on    |
| --------- | --------- | --------- |
| \~256 KB  | \~0.7 sec | \~0.9 sec |
| \~2 MB    | \~6 sec   | \~7 sec   |
| \~4.5 MB  | \~13 sec  | \~17 sec  |
| \~5 MB    | \~15 sec  | \~18 sec  |
| \~18.5 MB | \~54 sec  | \~1.1 min |

PPT is slower than PPTX and shows more variability than any other format in this category. Enabling OCR adds roughly 26% to processing time on average, though individual results varied considerably across test runs.

### Plain text and markup

#### TXT

| File size | OCR off   | OCR on    |
| --------- | --------- | --------- |
| \~56 KB   | \~0.0 sec | \~0.0 sec |
| \~1 MB    | \~0.5 sec | \~0.5 sec |
| \~3 MB    | \~1 sec   | \~2 sec   |
| \~5 MB    | \~2 sec   | \~3 sec   |
| \~20 MB   | \~10 sec  | \~11 sec  |

#### XML

| File size | OCR off   | OCR on    |
| --------- | --------- | --------- |
| \~1.4 MB  | \~0.9 sec | \~0.9 sec |
| \~12 MB   | \~8 sec   | \~8 sec   |
| \~14 MB   | \~9 sec   | \~9 sec   |
| \~23 MB   | \~15 sec  | \~15 sec  |
| \~48 MB   | \~30 sec  | \~31 sec  |

#### RTF

| File size | OCR off   | OCR on    |
| --------- | --------- | --------- |
| \~133 KB  | \~0.2 sec | \~0.2 sec |
| \~6 MB    | \~8 sec   | \~8 sec   |
| \~8 MB    | \~11 sec  | \~11 sec  |
| \~10 MB   | \~14 sec  | \~14 sec  |
| \~24 MB   | \~33 sec  | \~34 sec  |

OCR has no meaningful impact on TXT, XML, or RTF. These formats are already plain text, so there is no text extraction step required, and they contain no embedded images for OCR to process.

### PDF

PDF behaviour is fundamentally different from all other formats. Scan time depends heavily on whether the PDF is text-native (created digitally) or image-based (scanned pages). Two PDFs of the same size can differ in scan time by an order of magnitude. This variability exists with OCR off, and becomes extreme with OCR on.

#### PDF (OCR off)

| File size | Scan time (approx.) |
| --------- | ------------------- |
| \~177 KB  | \~1 sec\*           |
| \~2.5 MB  | \~16 sec\*          |
| \~21 MB   | \~2 min\*           |

#### PDF (OCR on)

| File size | Scan time (approx.) |
| --------- | ------------------- |
| \~177 KB  | \~6 sec\*           |
| \~1.5 MB  | \~50 sec\*          |
| \~2.8 MB  | \~1.6 min\*         |
| \~3.2 MB  | \~1.8 min\*         |
| \~21 MB   | \~12 min\*          |

\*With OCR enabled, processing time increases by \~410% on average over the OCR-off rate, and considerably more for PDFs containing image-based pages.

**Why PDF is different**

Of all supported file types, PDF is where OCR has the most significant and least predictable impact on scan performance.

With OCR disabled, DISCOVER extracts text directly from the PDF and skips all other content. Scan times at this setting are generally predictable, though PDFs tend to scan more slowly than other formats of a similar size due to the complexity of the format.

With OCR enabled, DISCOVER passes each page through optical character recognition to attempt text extraction, including from images. For PDFs that contain image-based pages, such as scanned documents or photographs saved as PDF, this is computationally expensive. A single image-heavy PDF can take several minutes to scan, even at a relatively small file size.

If scan performance is a concern, consider the following:

* If your PDFs are primarily digital documents, OCR will add limited overhead and can generally be left enabled.
* If your PDFs contain scanned documents or image-heavy content, only enable OCR if extracting text from those pages is a requirement for your use case.
* If you are unsure of the composition of your PDF files, run a test scan on a representative sample with OCR on and off before scoping a full scan job.
* If unexpectedly long scan times are reported, check whether PDFs with OCR enabled are in scope. This is the most common cause.

### HTML, HTM, and MD

These are consistently the slowest file types to scan, regardless of OCR setting or connector. Unlike plain text formats, HTML and MD files contain markup, nested tags, inline elements, and links that must be parsed to extract the underlying text content.&#x20;

This parsing overhead is inherent to how these formats are processed and scales with file size, which is why a single large file can take several minutes to scan. Enabling or disabling OCR has no meaningful impact on this.

| File size | OCR off   | OCR on    |
| --------- | --------- | --------- |
| \~501 KB  | \~11 sec  | \~12 sec  |
| \~5.4 MB  | \~2 min   | \~2.2 min |
| \~6.0 MB  | \~2.3 min | \~2.4 min |

A single large HTML or Markdown file can take several minutes to scan. If your target directories contain many files of this type, the total scan duration will be significantly longer than the file count or total data size would suggest.

#### Managing scan time for HTML, HTM, and MD

If these file types are present in your scan scope and performance is a concern, consider the following:

* If HTML, HTM, or MD files do not contain sensitive data relevant to your scan objectives, exclude these extensions from the scan job entirely.
* If only specific directories are known to contain these file types, scope your scan to avoid those directories where possible.
* When planning scan jobs that include large numbers of these files, factor in the extended scan times shown above and adjust scheduling expectations accordingly.
* If a scan is taking longer than expected, check whether HTML, HTM, or MD files are in scope and in significant volume. Alongside PDFs with OCR enabled, these are the most common causes of unexpectedly long scan durations.


# Results

{% embed url="<https://www.youtube.com/watch?index=1&list=PLWi_UryZslgY&v=T_hVc20zOKU>" %}

The Results page provides a comprehensive view of sensitive data detected across scanned endpoints, SharePoint sites, and email mailboxes. From this page, you can examine detailed findings, initiate investigations for closer inspection, perform remediation actions, and download reports.

Results are organised into three tabs based on where the sensitive data was found:

* Devices (workstations, laptops, file servers)
* SharePoint
* Email (Exchange Online mailboxes)
* Gmail
* Google Drive

Navigate to **DISCOVER** > **Results**. By default, you'll see results from all completed scans. Use the filter options at the top of the page to narrow results by specific scan jobs, date ranges, data types, classifications, or target names.

<details>

<summary><strong>Devices</strong></summary>

For devices, you can view the scanned file details, including filename, file path, size, creation and modification dates, owner information, and operating system details. Detected data types and the number of hits are shown in a clickable format, allowing you to review sensitive content quickly. The classification of each file is displayed, and any remediation actions, such as move, copy, delete, or notifications, are tracked.

<figure><img src="https://4044942488-files.gitbook.io/~/files/v0/b/gitbook-x-prod.appspot.com/o/spaces%2FPtAo3ilfcIjmOhwnXZVf%2Fuploads%2FcLiqfaqpJ55xvJIfGYMD%2Fimage.png?alt=media&amp;token=5266cb33-93d2-4c1b-a2dc-b37d59c51afa" alt="" width="563"><figcaption></figcaption></figure>

1. Navigate to **DISCOVER** > **Results**.
2. Click on **Devices**.

<table><thead><tr><th width="167">Field Group</th><th width="161">Field</th><th>Description / Details</th></tr></thead><tbody><tr><td><strong>Device / Endpoint</strong></td><td>Device Name</td><td>Name of the device where the scanned file resides.</td></tr><tr><td><strong>Scan Details</strong></td><td>Date Scanned</td><td>Date when the scan was executed.</td></tr><tr><td><strong>File Details</strong></td><td>Filename</td><td>Name of the file containing sensitive data.</td></tr><tr><td></td><td>File Path</td><td>Full path of the file on the device.</td></tr><tr><td></td><td>File Size (BYTES)</td><td>Size of the file in bytes.</td></tr><tr><td></td><td>File Created</td><td>Timestamp when the file was created.</td></tr><tr><td></td><td>File Last Modified</td><td>Timestamp of the file’s last modification.</td></tr><tr><td><strong>Detection Results</strong></td><td>Data Type</td><td>Clickable list of sensitive data types detected in the file.</td></tr><tr><td></td><td>Number of Hits</td><td>Clickable count showing how many instances of each data type were found in the file. If the number of hits is below the configured upper limit, all results are displayed. If it exceeds the limit, only results up to the upper limit are shown.</td></tr><tr><td><strong>Classification &#x26; Security</strong></td><td>Classification</td><td>Clickable field showing which classification the file belongs to.</td></tr><tr><td><strong>Action / Remediation</strong></td><td>Action Taken</td><td>Status of any remediation actions applied to the file (move, copy, delete, notify file/device owner).</td></tr><tr><td><strong>Ownership &#x26; System Info</strong></td><td>Owner</td><td>Name of the file owner.</td></tr><tr><td></td><td>IP Address</td><td>IP address of the device where the file resides.</td></tr><tr><td></td><td>OS Version</td><td>Operating system version of the device.</td></tr></tbody></table>

</details>

<details>

<summary><strong>SharePoint</strong></summary>

For SharePoint, the Results page shows details of scanned documents, including the document name, library, path, site URL, owner, and size. Detected sensitive data types and the number of hits are clickable, providing additional details. Additionally, the status of any remediation actions performed is recorded.

<figure><img src="https://4044942488-files.gitbook.io/~/files/v0/b/gitbook-x-prod.appspot.com/o/spaces%2FPtAo3ilfcIjmOhwnXZVf%2Fuploads%2FqNiz1xt5BgAErJpV8Vgj%2Fimage.png?alt=media&amp;token=47127a3f-7e3d-4cb1-9df5-a85b2043a135" alt="" width="563"><figcaption></figcaption></figure>

1. Navigate to **DISCOVER** > **Results**.
2. Click on **SharePoint**.

<table><thead><tr><th width="164">Field Group</th><th width="145">Field</th><th>Description / Details</th></tr></thead><tbody><tr><td><strong>Target / Site</strong></td><td>Target Name</td><td>Name of the SharePoint site or specific device/user where the scan was executed.</td></tr><tr><td><strong>Scan Details</strong></td><td>Scan Date</td><td>Date when the SharePoint scan was executed.</td></tr><tr><td><strong>File / Document Details</strong></td><td>File Name</td><td>Name of the document where sensitive data was found.</td></tr><tr><td></td><td>Path</td><td>Path of the document within SharePoint.</td></tr><tr><td></td><td>Site URL</td><td>URL of the SharePoint site.</td></tr><tr><td></td><td>Library</td><td>SharePoint library where the document resides.</td></tr><tr><td></td><td>Owner</td><td>Name of the document owner.</td></tr><tr><td></td><td>Size (in bytes)</td><td>Size of the document in bytes.</td></tr><tr><td><strong>Detection Results</strong></td><td>Data Types</td><td>Clickable list of sensitive data types detected in the document.</td></tr><tr><td></td><td>Number of Hits</td><td>Clickable count showing how many instances of each data type were found. If below the configured upper limit, all results are shown; if above, only results up to the upper limit are displayed.</td></tr><tr><td><strong>Classification &#x26; Security</strong></td><td>Classification</td><td>Clickable field showing the classification of the document.</td></tr><tr><td><strong>Action / Remediation</strong></td><td>Action Taken</td><td>Status of any remediation actions applied to the document (move, copy, delete, notify file/device owner).</td></tr></tbody></table>

</details>

<details>

<summary><strong>Email</strong></summary>

For email results, the page provides metadata for each scanned email, including sender, recipients (To, CC, BCC), subject, sent date, and mailbox folder. Detected sensitive data types, number of hits, and the specific location of the data (body, attachment, or subject) are clickable for detailed review. The classification of the email or its contents is shown, and the status of any remediation actions is tracked.

<figure><img src="https://4044942488-files.gitbook.io/~/files/v0/b/gitbook-x-prod.appspot.com/o/spaces%2FPtAo3ilfcIjmOhwnXZVf%2Fuploads%2FBLz7YgvcaD4XC0ZEOcvf%2Fimage.png?alt=media&amp;token=e2cbe7d8-cfe4-450d-89b4-c72bd7cf208e" alt="" width="563"><figcaption></figcaption></figure>

1. Navigate to **DISCOVER** > **Results**.
2. Click on **Email**.

<table><thead><tr><th width="153">Field Group</th><th width="154">Field</th><th>Description / Details</th></tr></thead><tbody><tr><td><strong>Target / Mailbox</strong></td><td>Target Name</td><td>Name of the device or user mailbox where the email resides.</td></tr><tr><td><strong>Scan Details</strong></td><td>Scan Date</td><td>Date when the email scan was executed.</td></tr><tr><td><strong>Email Metadata</strong></td><td>From</td><td>Sender of the email.</td></tr><tr><td></td><td>To</td><td>Primary recipients of the email. Clickable to view details.</td></tr><tr><td></td><td>CC</td><td>CC recipients. Clickable to view details.</td></tr><tr><td></td><td>BCC</td><td>BCC recipients. Clickable to view details.</td></tr><tr><td></td><td>Subject</td><td>Subject of the email.</td></tr><tr><td></td><td>Sent Date</td><td>Date the email was sent.</td></tr><tr><td></td><td>Folder</td><td>Mailbox folder containing the email.</td></tr><tr><td><strong>Detection Results</strong></td><td>Data Type</td><td>Clickable list of sensitive data types detected in the email.</td></tr><tr><td></td><td>Number of Hits</td><td>Clickable count showing instances of each data type found. Applies upper limit if configured.</td></tr><tr><td></td><td>Data Found In</td><td>Indicates where the sensitive data was detected (body, attachment, subject, etc.).</td></tr><tr><td><strong>Classification &#x26; Security</strong></td><td>Classification</td><td>Clickable field showing the classification of the email or its contents.</td></tr><tr><td><strong>Action / Remediation</strong></td><td>Action Taken</td><td>Status of any remediation actions applied to the email (move, copy, delete, notify file/device owner).</td></tr></tbody></table>

</details>

<details>

<summary><strong>Gmail</strong></summary>

For email results, the page provides metadata for each scanned email, including sender, recipients (To, CC, BCC), subject, sent date, and mailbox folder. Detected sensitive data types, number of hits, and the specific location of the data (body, attachment, or subject) are clickable for detailed review. The classification of the email or its contents is shown, and the status of any remediation actions is tracked.

<figure><img src="https://4044942488-files.gitbook.io/~/files/v0/b/gitbook-x-prod.appspot.com/o/spaces%2FPtAo3ilfcIjmOhwnXZVf%2Fuploads%2F1HGbTX57rehBxIA6YtNC%2Fimage.png?alt=media&amp;token=c64a5992-ce3a-40fd-a457-898d50d2d759" alt="" width="563"><figcaption></figcaption></figure>

1. Navigate to **DISCOVER** > **Results**.
2. Click on **Gmail**.

<table><thead><tr><th width="153">Field Group</th><th width="154">Field</th><th>Description / Details</th></tr></thead><tbody><tr><td><strong>Target / Mailbox</strong></td><td>Target Name</td><td>Name of the device or user mailbox where the email resides.</td></tr><tr><td><strong>Scan Details</strong></td><td>Scan Date</td><td>Date when the email scan was executed.</td></tr><tr><td><strong>Email Metadata</strong></td><td>From</td><td>Sender of the email.</td></tr><tr><td></td><td>To</td><td>Primary recipients of the email. Clickable to view details.</td></tr><tr><td></td><td>CC</td><td>CC recipients. Clickable to view details.</td></tr><tr><td></td><td>BCC</td><td>BCC recipients. Clickable to view details.</td></tr><tr><td></td><td>Subject</td><td>Subject of the email.</td></tr><tr><td></td><td>Sent Date</td><td>Date the email was sent.</td></tr><tr><td></td><td>Folder</td><td>Mailbox folder containing the email.</td></tr><tr><td><strong>Detection Results</strong></td><td>Data Type</td><td>Clickable list of sensitive data types detected in the email.</td></tr><tr><td></td><td>Number of Hits</td><td>Clickable count showing instances of each data type found. Applies upper limit if configured.</td></tr><tr><td></td><td>Data Found In</td><td>Indicates where the sensitive data was detected (body, attachment, subject, etc.).</td></tr><tr><td><strong>Classification &#x26; Security</strong></td><td>Classification</td><td>Clickable field showing the classification of the email or its contents.</td></tr><tr><td><strong>Action / Remediation</strong></td><td>Action Taken</td><td>Status of any remediation actions applied to the email (move, copy, delete, notify file/device owner).</td></tr></tbody></table>

</details>

<details>

<summary><strong>Google Drive</strong></summary>

For Google Drive, the Results page shows details for each scanned file. You can review the file name, location, owner, size, and timestamps. Detected data types, hit counts, classifications, and remediation actions appear with each result.&#x20;

1. Navigate to **DISCOVER** > **Results**.
2. Click on **Google Drive**.

<table><thead><tr><th width="164">Field Group</th><th width="145">Field</th><th>Description / Details</th></tr></thead><tbody><tr><td><strong>Target</strong></td><td>Target Name</td><td>Name of the Google Drive scan target.</td></tr><tr><td><strong>Scan Details</strong></td><td>Scan Date</td><td>Date when the Google Drive scan was executed.</td></tr><tr><td></td><td>Scan Time</td><td>Time when the Google Drive scan was executed.</td></tr><tr><td><strong>File Details</strong></td><td>File Name</td><td>Name of the file where sensitive data was found.</td></tr><tr><td></td><td>Path</td><td>Location of the file in Google Drive.</td></tr><tr><td></td><td>File Size</td><td>Size of the file.</td></tr><tr><td></td><td>Last Modified</td><td>Date and time when the file was last modified.</td></tr><tr><td></td><td>File Created</td><td>Date and time when the file was created.</td></tr><tr><td></td><td>Owner</td><td>Owner of the file.</td></tr><tr><td><strong>Detection Results</strong></td><td>Data Types</td><td>Detected sensitive data types in the file.</td></tr><tr><td></td><td>Number of Hits</td><td>Number of detected instances for each data type.</td></tr><tr><td><strong>Classification &#x26; Security</strong></td><td>Classification</td><td>Classification assigned to the file.</td></tr><tr><td></td><td>Verified As</td><td>Manual review status. Mark a file as <strong>Important</strong> or <strong>Not Important</strong> to sort, filter, and revisit it later.</td></tr><tr><td><strong>Action / Remediation</strong></td><td>Action Taken</td><td>Remediation action applied to the file.</td></tr></tbody></table>

</details>

### Investigate

{% hint style="info" %}
You must create an investigation beforehand in **DISCOVER** > **Investigation**.
{% endhint %}

Investigate allows users to download scanned files for closer inspection of sensitive information. Use this when you need to verify whether a scan configuration is producing accurate results, or when a sensitive file has appeared in an unexpected location and requires manual review.

![](https://4044942488-files.gitbook.io/~/files/v0/b/gitbook-x-prod.appspot.com/o/spaces%2FPtAo3ilfcIjmOhwnXZVf%2Fuploads%2F6ft098q5rDkymV4uasDO%2FUnknown%20image?alt=media\&token=0fb1dacc-6e54-40da-b070-7dfc875db704)

1. Navigate to **DISCOVER** > **Results**.
2. Select the entries you want to include in the investigation, and click **Investigate**.
3. Click Select an existing investigation from the drop-down and add a **Comment** (optional).
4. Click **Investigate**. Selected files are downloaded as a password-protected ZIP file.

### Remediate

Remediate executes remediation actions (move, delete, or encrypt) on files identified during a scan or investigation. Unlike the **Remediation** section, which provides a status view of remediated files, this function performs the actual operational steps to secure, remove, or notify relevant parties about sensitive files.

![](https://4044942488-files.gitbook.io/~/files/v0/b/gitbook-x-prod.appspot.com/o/spaces%2FPtAo3ilfcIjmOhwnXZVf%2Fuploads%2F9IpTstJ9YTxjOOXC3Mzn%2FUnknown%20image?alt=media\&token=81868bde-3856-4b5f-8e8f-d97c27f094b7)

1. Go to **DISCOVER** > **Results** > **Remediate** or **DISCOVER** > **Investigation** > **Remediate**
2. Select one or more files and click **Remediate**.
3. Choose a remediation action from the drop-down.

<table><thead><tr><th width="267">Action</th><th>Function</th></tr></thead><tbody><tr><td>Move</td><td>Relocates the file to a secure location.</td></tr><tr><td>Copy</td><td>Creates a copy of the file to a secure or alternate location.</td></tr><tr><td>Delete</td><td>Permanently removes the file.</td></tr><tr><td>Send email to Data Owner</td><td>Notifies the assigned data owner with an email.</td></tr><tr><td>Send email to End User</td><td>Notifies the file owner or user who has the device in their possession.</td></tr></tbody></table>

5. Add an optional comment to provide context or notes for the task.
6. Click **Remediate** to execute the selected action.


# Set Up Secure Location

When GuardWare identifies sensitive files during a scan, you may need to investigate or remediate them. A Secure Location is a designated storage area where these files are copied or moved, keeping them in a controlled environment separate from their original location.

Configuring a Secure Location is recommended before running scans where remediation is anticipated. Without one, files identified during a scan cannot be moved or downloaded for investigation.

GuardWare supports two configuration methods, depending on whether the target device has been discovered.

{% hint style="success" icon="sparkles" %}
Click the tabs below to view the relevant content, or use the links provided here to navigate to the desired section.

* [**Set up a new secure location**](/documentation/discover/investigate-and-remediate/set-up-secure-location#set-up-a-new-secure-location)
* [**Set up a discovered device as a secure location**](/documentation/discover/investigate-and-remediate/set-up-secure-location#set-up-a-discovered-device-as-a-secure-location)
  {% endhint %}

{% tabs %}
{% tab title="Set Up Secure Location — New" %}

### Set up a new secure location

Use this method if the device you want to use as the Secure Location has not yet been registered in GuardWare.

<figure><img src="https://4044942488-files.gitbook.io/~/files/v0/b/gitbook-x-prod.appspot.com/o/spaces%2FPtAo3ilfcIjmOhwnXZVf%2Fuploads%2FmFMv2xH1trdmtjg7F8FE%2Fimage.png?alt=media&amp;token=e42b1de6-0c74-4cd1-9595-0ac9f85af938" alt="" width="563"><figcaption></figcaption></figure>

1. Navigate to **ORGANISATION** > **Set Up Secure Location**.
2. In **Target Type**, select **New**.
3. In **Target Name**, enter the exact hostname of the target device. This must match the device's computer name precisely. To find a device's hostname on Windows, right-click **Start** > **System** > look for **Device name**.<br>

   <figure><img src="https://4044942488-files.gitbook.io/~/files/v0/b/gitbook-x-prod.appspot.com/o/spaces%2FPtAo3ilfcIjmOhwnXZVf%2Fuploads%2FkD2has0QTON4AIf1QjMa%2Fimage.png?alt=media&amp;token=0ca3b9f6-5048-4ab9-8d60-938c01c90975" alt="" width="563"><figcaption></figcaption></figure>
4. In **Connection Protocol**, select how GuardWare will connect to the device. Select **WinRM** for Windows devices or **SSH** for Unix-based systems.
5. In **Username**, enter the credentials for an account with access to the target device. Use the following format depending on account type:
   1. Local account: `administrator`
   2. Azure AD account: `user@yourcompany.com`
   3. Domain account: `DOMAIN\username`
6. In **Password**, enter the password for this account.
7. In **Secure Folder** **Path**, enter the full path where files should be stored (e.g., `C:\SecureLocation`).
8. Click **Save**.

GuardWare will attempt to connect to the location using the credentials provided. A status of **Active** confirms the Secure Location is ready. If the connection fails, verify that the hostname, credentials, and path are correct, the device is reachable from the Scanning Server, and the account has sufficient permissions on the destination folder.

{% hint style="warning" %}
If you need to change the Secure Location later, repeat the above process with the new device details.
{% endhint %}
{% endtab %}

{% tab title="Set Up Secure Location — Discovered" %}

### Set up a discovered device as a secure location

Use this method if the device you want to use has already been scanned or appears in GuardWare's discovered devices list.

<figure><img src="https://4044942488-files.gitbook.io/~/files/v0/b/gitbook-x-prod.appspot.com/o/spaces%2FPtAo3ilfcIjmOhwnXZVf%2Fuploads%2FHI4oUhsUyRLZEnyNx10E%2Fimage.png?alt=media&amp;token=e9ee5cba-0fa3-4c32-a233-6a762c601728" alt="" width="563"><figcaption></figcaption></figure>

1. Navigate to **ORGANISATION** > **Set Up Secure Location**.
2. In **Target Type**, select **Discovered**.
3. In **Target Name**, select the device from the list. If the device does not appear, it has not yet been discovered. Either run a discovery scan first or use the New Device method above.
4. In **Secure Folder Path**, enter the full destination path (e.g., `C:\SecureLocation`) and click **Save**.

GuardWare will validate the path and confirm the location is accessible.
{% endtab %}
{% endtabs %}


# Set Investigation Password

Files downloaded using GuardWare DISCOVER's Investigate function are automatically password-protected. The password active at the time of download is applied to the file; if you change the password later, previously downloaded files still require the original password.

Set this password before conducting any investigations, and store it securely. If it is lost, previously downloaded files cannot be opened.

<figure><img src="https://4044942488-files.gitbook.io/~/files/v0/b/gitbook-x-prod.appspot.com/o/spaces%2FPtAo3ilfcIjmOhwnXZVf%2Fuploads%2FFKscb3hZMmxv72ZWtgP6%2Fimage.png?alt=media&amp;token=1573cd93-46b3-48bc-9460-90e42b7d9624" alt="" width="563"><figcaption></figcaption></figure>

1. Navigate to **ORGANISATION** > **Set Up Secure Location**.
2. Either enter a password manually or click **Generate** to create one automatically. The password must be at least eight characters and include uppercase, lowercase, a number, and a special character.
3. Click **Set Password**.

{% hint style="info" %}
Share the Investigation Password only through secure channels, an encrypted password manager, in person, or your organisation's secure messaging system. Do not include it in reports, emails, or unencrypted documents.
{% endhint %}

## View Investigation Password

1. Navigate to **ORGANISATION** > **Set Up Secure Location**
2. Go to the **View Investigation Password** section and click View password <i class="fa-eye">:eye:</i> to open the authenticator window.\
   &#x20;

   <div align="left"><figure><img src="https://4044942488-files.gitbook.io/~/files/v0/b/gitbook-x-prod.appspot.com/o/spaces%2FPtAo3ilfcIjmOhwnXZVf%2Fuploads%2Ff2phoNz64IPmutzeUU4o%2Fimage.png?alt=media&amp;token=aaabeb68-973d-47e9-b070-04ba8c4564bf" alt="" width="563"><figcaption></figcaption></figure></div>
3. If you have not yet set up an authenticator app, you will be prompted to do so before the password can be displayed.

   <div align="left"><figure><img src="https://4044942488-files.gitbook.io/~/files/v0/b/gitbook-x-prod.appspot.com/o/spaces%2FPtAo3ilfcIjmOhwnXZVf%2Fuploads%2FONsLNyX1zoxcjtg6FWGm%2Fimage.png?alt=media&amp;token=2cb2c37b-15fd-4b3b-8e2d-fbf4e8424926" alt="" width="539"><figcaption></figcaption></figure></div>
4. Enter the authentication code and click **Verify**. <br>

   <div align="left"><figure><img src="https://4044942488-files.gitbook.io/~/files/v0/b/gitbook-x-prod.appspot.com/o/spaces%2FPtAo3ilfcIjmOhwnXZVf%2Fuploads%2FKt8kWyJkPQaZsoJxEOev%2Fimage.png?alt=media&amp;token=412866f5-27e3-46e6-9fc5-910fe6d0f768" alt="" width="448"><figcaption></figcaption></figure></div>

To change the password, simply enter a new password or generate a new one automatically and click **Set Password**.


# Investigation

{% embed url="<https://www.youtube.com/watch?v=RglZZHeibrA>" %}

Investigation allows you to create cases that group files requiring further review. Each investigation maintains a record of which files were examined, by whom, and any comments added during the review process, providing an audit trail for compliance purposes.

Within an investigation case, you can tag detected sensitive data as **Important** or **Not Important**, review previous comments, and download password-protected files as a ZIP for analysis outside of GuardWare.

<figure><img src="https://4044942488-files.gitbook.io/~/files/v0/b/gitbook-x-prod.appspot.com/o/spaces%2FPtAo3ilfcIjmOhwnXZVf%2Fuploads%2Fnf7dAiEAI5DEETynOl2o%2Fimage.png?alt=media&amp;token=7760a081-0511-4965-af44-9c1b8045cd8b" alt="" width="563"><figcaption></figcaption></figure>

<table><thead><tr><th width="147">Field Group</th><th width="171">Field</th><th>Description / Details</th></tr></thead><tbody><tr><td>Scan Details</td><td>Scan Name</td><td>Name of the scan job.</td></tr><tr><td></td><td>Scan Date</td><td>Date the scan job was executed.</td></tr><tr><td>File Details</td><td>File Name</td><td>Name of the file where sensitive data was found.</td></tr><tr><td></td><td>Folder Path</td><td>Path of the file that contains the sensitive data.</td></tr><tr><td></td><td>File Owner</td><td>Name of the file owner.</td></tr><tr><td>Endpoint / Data Source</td><td>Target Name</td><td>Device or service name where the scan was executed. Endpoint and data source are the same in this context.</td></tr><tr><td>Scan Results</td><td>Data Types</td><td>List of sensitive data types found by the scan job. Click to view details.</td></tr><tr><td>Remediation Action</td><td>Action</td><td>Action performed on the file (e.g., move, copy, delete, or notify device/file owner).</td></tr><tr><td>Download / Investigation</td><td>Download Status</td><td>Status indicating whether the file is available for download: -Available: File is available for download.Not Available: File is unavailable for download currently.</td></tr><tr><td></td><td>Investigation</td><td>Action to make the file available for download for manual examination of sensitive data.</td></tr><tr><td></td><td>Investigated By</td><td>Name of the user who performed the investigation.</td></tr><tr><td></td><td>Investigated At</td><td>Timestamp when the investigation was initiated.</td></tr><tr><td></td><td>Investigation Available At</td><td>Timestamp when the file became available for download. Always later than Investigated At.</td></tr><tr><td></td><td>Previous Comment</td><td>Comments from previous investigations.</td></tr></tbody></table>

### Create New Investigation

Before performing any [**file-level examinations**](/documentation/discover/investigate-and-remediate/results#investigate) in the Results page, you must first create an Investigation. Each investigation group related files together for review, tracks examiner activities, and stores comments made during the investigation process.

![](https://4044942488-files.gitbook.io/~/files/v0/b/gitbook-x-prod.appspot.com/o/spaces%2FPtAo3ilfcIjmOhwnXZVf%2Fuploads%2FV91dmiIXCtnUgchVs1JS%2FUnknown%20image?alt=media\&token=10d81841-42a6-492d-8e8e-a98b134b080c)

1. Navigate to **DISCOVER** > **Investigation** and click **+Investigation.**
2. Enter a unique **Name** and add a short **Purpose**.
3. Click **Create**.

### View Investigations

View Investigation shows a searchable record of all investigations.

1. Navigate to **DISCOVER** > **Investigation** and click <i class="fa-eye">:eye:</i> **View Investigations**.
2. Search for or select an investigation from the dropdown.
3. Review the investigation details, including its name, purpose, creation date, and who created it.


# Remediation

Monitor and track actions applied to sensitive data. Remediation provides a clear overview of remediation status and history, serving as a trail of how your organisation has responded to discovered sensitive information.

The page displays all files that have undergone remediation, along with complete details about each file, the action taken, and the user who performed it.

<figure><img src="https://4044942488-files.gitbook.io/~/files/v0/b/gitbook-x-prod.appspot.com/o/spaces%2FPtAo3ilfcIjmOhwnXZVf%2Fuploads%2Ff5gI9acnZ9r5WRkTC88t%2Fimage.png?alt=media&amp;token=6fb98091-600f-4263-9b64-c0e5c8b43d62" alt="" width="563"><figcaption></figcaption></figure>

1. Navigate to **DISCOVER** > **Remediation**.&#x20;
2. The page displays all remediated files across all scans, grouped by device type. Select a category to view the relevant listings.
3. Use filter options at the top of the page to narrow results by date range, remediation action type, scan name, classification, or data type.

After [**performing remediations**](/documentation/discover/investigate-and-remediate/results#remediate), you can see the following information:

<table><thead><tr><th width="145">Field Group</th><th width="163">Field</th><th>Description / Details</th></tr></thead><tbody><tr><td>Scan Details</td><td>Scan Name</td><td>Name of the scan job that was run.</td></tr><tr><td></td><td>Scan Date</td><td>Date and time when the scan job was initiated.</td></tr><tr><td>File Details</td><td>File Name</td><td>Name of the file where sensitive data was detected.</td></tr><tr><td></td><td>Folder Path</td><td>Path of the file on the device.</td></tr><tr><td></td><td>File Owner</td><td>Owner of the file on the endpoint/data source.</td></tr><tr><td>Endpoint / Data Source</td><td>Target Name</td><td>Name of the device where the file resides. Endpoint and data source are the same in this context.</td></tr><tr><td>Scan Results</td><td>Data Types</td><td>Clickable field showing the sensitive data types detected during the scan. For example, if Visa card data is configured to be scanned, this shows how many instances were found. An upper limit can be configured, e.g., only 5 results will be displayed if the limit is set to 5.</td></tr><tr><td>Remediation Details</td><td>Status</td><td>Current status of the file (e.g., Remediated, Pending, Investigating).</td></tr><tr><td></td><td>Action</td><td>Action performed on the file or available actions.</td></tr><tr><td></td><td>Remediated By</td><td>Name of the user who performed the remediation.</td></tr><tr><td></td><td>Remediated At</td><td>Date and time when remediation was performed.</td></tr><tr><td></td><td>Remediation Performed At</td><td>Timestamp of the remediation activity (similar to Remediated At, can reflect exact system logging).</td></tr><tr><td></td><td>Previous Comment</td><td>Any comment added during prior remediation or investigation steps.</td></tr></tbody></table>


# Uninstall DISCOVER Agent

{% hint style="danger" %} <mark style="color:$danger;">**Before Uninstalling:**</mark> <mark style="color:$danger;"></mark><mark style="color:$danger;">Ensure you have administrator rights and have backed up any necessary configurations or data. Failing to follow the uninstall steps correctly can leave residual files, registry entries, and service stubs that cause conflicts if you reinstall later.</mark>
{% endhint %}

1. Double-click the DISCOVER Agent installe&#x72;**.**
2. Click **Next**.<br>

   <div align="left"><img src="https://4044942488-files.gitbook.io/~/files/v0/b/gitbook-x-prod.appspot.com/o/spaces%2FPtAo3ilfcIjmOhwnXZVf%2Fuploads%2FTax7xvnZHQC2YnL7i0D3%2FUnknown%20image?alt=media&amp;token=a8a77e1a-d36c-48dc-9dc2-2550c7c9421c" alt="" width="375"></div>
3. Select **Remove** and on the next page, click **Next**.<br>

   <div align="left"><figure><img src="https://4044942488-files.gitbook.io/~/files/v0/b/gitbook-x-prod.appspot.com/o/spaces%2FPtAo3ilfcIjmOhwnXZVf%2Fuploads%2FhnrXHtSSq1j7otsUiukr%2Fimage.png?alt=media&amp;token=e0b19cbe-cd76-469f-b58c-408c73390530" alt="" width="375"><figcaption></figcaption></figure></div>
4. Wait for the process to complete. You may be prompted to restart your device to complete the uninstallation.


# DISCOVER FAQs

<details>

<summary>Can I customise the types of sensitive data DISCOVER searches for?</summary>

Yes, you can customise the types of sensitive data DISCOVER searches for. DISCOVER provides flexibility to customise scan jobs according to your organisation’s specific data governance needs. You have the option to include predefined data (PCI and PII) or custom data types.

Custom data types can be defined as:

* Regular expressions: for pattern-based detection (e.g., employee ID formats, internal codes).
* Filename expressions: to detect files with specific naming conventions or keywords.
* Sensitive words: to locate documents containing custom phrases, particular terms, or confidential references.

When configuring a scan job, you can select or deselect predefined data types, such as PII (Personally Identifiable Information) and PCI (Payment Card Information), as well as custom data types.

</details>

<details>

<summary>What is different between a One-time Scan and an Ongoing Scan?</summary>

One-time Scan and Ongoing Scan differ in how DISCOVER executes and maintains scan jobs:

**One-time Scan**

* Runs only once when initiated manually.
* Ideal for quick assessments, targeted scans, or validating scan configuration changes.
* After completion, the scan won’t run again unless manually initiated.
* No automatic re-scan or scheduling is attached.

**Ongoing Scan**

* Configured to run at scheduled intervals.
* Automatically scans new or modified data sources according to the defined schedule.
* Used for routine monitoring, compliance tracking, and detection of newly introduced sensitive data.

</details>

<details>

<summary>How does agentless scanning work compared to scanning server-based scanning?</summary>

The difference is where the Scanning Server runs and what it scans.

| Agentless scanning                                                                                                          | Scanning server-based scanning                                                                                                |
| --------------------------------------------------------------------------------------------------------------------------- | ----------------------------------------------------------------------------------------------------------------------------- |
| The DISCOVER Scanning Server is installed on one host or VM.                                                                | The DISCOVER Scanning Server is installed on the same device being scanned.                                                   |
| The Scanning Server connects remotely to target devices and services over WinRM, SSH, SMB, or Microsoft 365 APIs.           | The Scanning Server scans files locally on that same device.                                                                  |
| Remote targets do **not** need any DISCOVER component installed.                                                            | The scanned device already has the Scanning Server installed because it is performing its own local scan.                     |
| Best for file servers, cloud services, shared infrastructure, or environments where you want one host to scan many targets. | Best for devices that need local scanning, such as roaming devices or systems you want to scan directly on the device itself. |
| Performance depends on network connectivity, protocol access, and target permissions.                                       | Performance depends mainly on the resources of the device running the Scanning Server.                                        |

</details>

<details>

<summary>What types of files does DISCOVER scan?</summary>

DISCOVER scans a wide range of file types across endpoints and storage systems, including:

<table><thead><tr><th width="199">Category</th><th>File types</th></tr></thead><tbody><tr><td>Data files</td><td><code>.sql</code>, <code>.xml</code>, <code>.yaml</code>, <code>.yml</code>, <code>.log</code>, <code>.bin</code>, <code>.ini</code>, <code>.cfg</code>, <code>.md</code>, <code>.dat</code>, <code>.nfo</code>, <code>.conf</code>, <code>.env</code>, <code>.tf</code>, <code>.tfvars</code>, <code>.mk</code>, <code>.cmake</code>, <code>.bzl</code>, <code>.evt</code>, <code>.evtx</code></td></tr><tr><td>Office documents</td><td><code>.docx</code>, <code>.doc</code>, <code>.dot</code>, <code>.dotx</code>, <code>.odt</code>, <code>.pdf</code>, <code>.xps</code>, <code>.pub</code>, <code>.pptx</code>, <code>.ppt</code>, <code>.pps</code>, <code>.odp</code>, <code>.rtf</code>, <code>.csv</code>, <code>.xlsx</code>, <code>.xls</code>, <code>.xlsm</code>, <code>.xlsb</code>, <code>.ods</code>, <code>.txt</code></td></tr><tr><td>Source code and web pages</td><td><code>.htm</code>, <code>.html</code>, <code>.js</code>, <code>.mjs</code>, <code>.cjs</code>, <code>.json</code>, <code>.py</code>, <code>.pyw</code>, <code>.pyi</code>, <code>.ts</code>, <code>.tsx</code>, <code>.css</code>, <code>.scss</code>, <code>.sass</code>, <code>.less</code>, <code>.php</code>, <code>.php3</code>, <code>.php4</code>, <code>.php5</code>, <code>.php7</code>, <code>.phtml</code>, <code>.asp</code>, <code>.aspx</code>, <code>.ascx</code>, <code>.vbhtml</code>, <code>.cshtml</code>, <code>.config</code>, <code>.c</code>, <code>.h</code>, <code>.cpp</code>, <code>.cc</code>, <code>.cxx</code>, <code>.hpp</code>, <code>.hh</code>, <code>.hxx</code>, <code>.cs</code>, <code>.m</code>, <code>.mm</code>, <code>.java</code>, <code>.kt</code>, <code>.kts</code>, <code>.scala</code>, <code>.sc</code>, <code>.groovy</code>, <code>.gvy</code>, <code>.gy</code>, <code>.gsh</code>, <code>.clj</code>, <code>.cljs</code>, <code>.cljc</code>, <code>.edn</code>, <code>.rb</code>, <code>.erb</code>, <code>.rake</code>, <code>.gemspec</code>, <code>.lua</code>, <code>.rs</code>, <code>.go</code>, <code>.swift</code>, <code>.hs</code>, <code>.lhs</code>, <code>.erl</code>, <code>.hrl</code>, <code>.ex</code>, <code>.exs</code>, <code>.ml</code>, <code>.mli</code>, <code>.mll</code>, <code>.mly</code>, <code>.fs</code>, <code>.fsi</code>, <code>.fsx</code>, <code>.fsscript</code>, <code>.f</code>, <code>.for</code>, <code>.f90</code>, <code>.f95</code>, <code>.f03</code>, <code>.f08</code>, <code>.cbl</code>, <code>.cob</code>, <code>.cpy</code>, <code>.pas</code>, <code>.pp</code>, <code>.dpr</code>, <code>.adb</code>, <code>.ads</code>, <code>.ada</code>, <code>.lisp</code>, <code>.lsp</code>, <code>.cl</code>, <code>.scm</code>, <code>.ss</code>, <code>.pro</code>, <code>.vb</code>, <code>.bas</code>, <code>.frm</code>, <code>.cls</code>, <code>.r</code>, <code>.rmd</code>, <code>.jl</code>, <code>.dart</code>, <code>.cr</code>, <code>.nim</code>, <code>.nims</code>, <code>.zig</code>, <code>.csproj</code>, <code>.vbproj</code>, <code>.fsproj</code>, <code>.gradle</code>, <code>.cfm</code>, <code>.cfc</code>, <code>.st</code>, <code>.apl</code>, <code>.dyalog</code>, <code>.ijs</code>, <code>.hack</code></td></tr><tr><td>Scripts</td><td><code>.ps1</code>, <code>.sh</code>, <code>.bash</code>, <code>.zsh</code>, <code>.ksh</code>, <code>.bat</code>, <code>.cmd</code>, <code>.psm1</code>, <code>.psd1</code>, <code>.pl</code>, <code>.pm</code>, <code>.t</code>, <code>.psql</code>, <code>.sas</code>, <code>.sps</code>, <code>.do</code></td></tr><tr><td>Assembly and hardware description</td><td><code>.s</code>, <code>.inc</code>, <code>.vhdl</code>, <code>.v</code>, <code>.sv</code>, <code>.svh</code> <code>.asm</code> <code>.vhd</code> </td></tr><tr><td>Build and project files</td><td><code>Makefile</code>, <code>Dockerfile</code>, <code>CMakeLists.txt</code>, <code>BUILD</code>, <code>WORKSPACE</code>, <code>.gradle.kts</code></td></tr><tr><td>CAD and 3D design</td><td><code>.dwg</code>, <code>.dxf</code>, <code>.dwt</code>, <code>.ipt</code>, <code>.iam</code>, <code>.idw</code>, <code>.ipn</code>, <code>.rvt</code>, <code>.rfa</code>, <code>.nwc</code>, <code>.nwd</code>, <code>.f3d</code>, <code>.fbx</code>, <code>.3ds</code>, <code>.max</code>, <code>.mb</code>, <code>.ma</code>, <code>.sldprt</code>, <code>.sldasm</code>, <code>.slddrw</code>, <code>.prt</code>, <code>.asm</code>, <code>.drw</code>, <code>.neu</code>, <code>.xpr</code>, <code>.xas</code>, <code>.catpart</code>, <code>.catproduct</code>, <code>.catdrawing</code>, <code>.cgr</code>, <code>.par</code>, <code>.dft</code>, <code>.step</code>, <code>.stp</code>, <code>.iges</code>, <code>.igs</code>, <code>.stl</code>, <code>.obj</code>, <code>.ply</code>, <code>.gltf</code>, <code>.glb</code>, <code>.usd</code>, <code>.usdz</code>, <code>.vrml</code>, <code>.wrl</code>, <code>.lwo</code>, <code>.lws</code>, <code>.lxo</code>, <code>.ztl</code>, <code>.zpr</code>, <code>.hip</code>, <code>.hiplc</code>, <code>.hipnc</code>, <code>.prefab</code>, <code>.unity</code>, <code>.uasset</code>, <code>.umap</code>, <code>.pak</code>, <code>.amf</code>, <code>.3mf</code>, <code>.gcode</code>, <code>.pts</code>, <code>.ptx</code>, <code>.e57</code>, <code>.xyz</code>, <code>.las</code>, <code>.laz</code></td></tr><tr><td>Images</td><td><code>.jpg</code>, <code>.jpeg</code>, <code>.png</code>, <code>.gif</code>, <code>.bmp</code>, <code>.tif</code>, <code>.tiff</code>, <code>.ico</code>, <code>.heic</code></td></tr><tr><td>Databases</td><td><code>.db</code>, <code>.sqlite</code>, <code>.mdb</code>, <code>.accdb</code>, <code>.dbf</code>, <code>.ora</code>, <code>.myd</code>, <code>.ibd</code></td></tr><tr><td>Backup and virtual disk images</td><td><code>.bak</code>, <code>.bkf</code>, <code>.gho</code>, <code>.vhd</code>, <code>.vhdx</code>, <code>.qcow2</code>, <code>.ova</code>, <code>.ovf</code></td></tr><tr><td>Financial and accounting</td><td><code>.qbw</code>, <code>.qbb</code>, <code>.qfx</code>, <code>.ofx</code>, <code>.mny</code>, <code>.gnucash</code></td></tr><tr><td>Healthcare records</td><td><code>.dcm</code>, <code>.hl7</code>, <code>.cda</code></td></tr><tr><td>Saved emails and Outlook contacts</td><td><code>.eml</code>, <code>.vcf</code>, <code>.msg</code>, <code>.pst</code>, <code>.ost</code>, <code>.mbox</code></td></tr></tbody></table>

</details>

<details>

<summary>What happens if the Scanning Server device or the target device goes offline during a scan?</summary>

DISCOVER scans involve multiple connections:

* **Scanning Server ↔ Management Console connection:**
  * If this connection goes offline, both the management console and the scanning server will continuously attempt to re-establish a connection.
  * Data transfer from the scanning server to the management console is temporarily halted, but the scan continues.
* **Scanning Server ↔ Target device connection:**
  * If a target device goes offline, the scan for that specific device pauses.
  * Once the target comes back online, the scan resumes from where it left off.
  * Other targets assigned to the same scanning server continue scanning uninterrupted.
* **Self-scan:**
  * This does not require network connectivity. It continues even if the scanning server or the management console is offline.
  * However, data cannot be sent to the management console until the scanning server-to-management console connection is restored.

</details>

<details>

<summary>How do I monitor the progress of ongoing scans?</summary>

You can monitor ongoing scans via the **DISCOVER Management Console**:

1. Navigate to **DISCOVER** > **Scans**.
2. In the scans list, check each scan's status.

| Status      | Explaination                                     |
| ----------- | ------------------------------------------------ |
| Not Started | The scan has been created but has not yet begun. |
| In Progress | The scan is currently running.                   |
| Completed   | The scan has been completed.                     |
| Terminated  | The scan was stopped manually.                   |

{% hint style="info" %}
Make sure to refresh the page to see the latest status, as this will update the display with any recent changes to the scanning server’s connectivity or activity.
{% endhint %}

</details>

<details>

<summary>How can I generate reports of discovered sensitive data?</summary>

Reports are automatically generated after each scan job. To download the generated reports:

1. Go to **DISCOVER** > **Results**.
2. Select a completed scan job from the list and click **Download.**

Reports will be downloaded as Excel (`.xlsx`) files.

</details>

<details>

<summary>Which environments and platforms does DISCOVER support?</summary>

DISCOVER supports scanning across a range of Windows environments and select Microsoft cloud services.

**Supported Environments**

* **Windows Operating Systems:**
  * Windows 10 and 11
  * Windows Server 2019, 2022, and 2025
* **File Servers:**
  * SMB-based file servers

**Supported Cloud Services**

* Microsoft Exchange
* Microsoft SharePoint

DISCOVER connects to these systems using protocols such as SMB, WinRM, and SSH, enabling scanning across environments.

</details>

<details>

<summary>What are the firewall or port requirements for DISCOVER?</summary>

Yes, DISCOVER requires the following firewall and ports:

| Port | Service       |
| ---- | ------------- |
| 22   | SSH           |
| 445  | SMB           |
| 443  | HTTPS         |
| 5986 | WinRM (HTTPS) |
| 3306 | MySQL         |
| 6379 | Redis         |

</details>

<details>

<summary>Can I schedule scans or run them on-demand?</summary>

Yes, DISCOVER allows both on-demand and scheduled scans:

* **On-demand scans:**
  * You can run a scan immediately whenever needed.
  * If a scan is already running on the same scanning server or host, the new scan is queued and will start once the current scan completes.
  * One scan task per scanning server can run at a time; additional scans are processed sequentially.
* **Scheduled scans:**
  * You can configure recurring scans on a fixed schedule (daily, weekly, monthly, or custom intervals).
  * Each scan job can have its own schedule, data scope, and sensitivity rules.
  * Ideal for continuous monitoring and compliance checks without manual intervention.

</details>

<details>

<summary>What should I do if the DISCOVER Scanning Server cannot connect to the Management Console?</summary>

If the Management Console cannot connect to the DISCOVER Scanning Server:

1. **Check Network Status** – Ensure the Management Console service and the Scanning Server can establish communication over the network.

If the network is functioning correctly but the scanning server still appears offline,

2. **Check Registry Configuration** – Open the Windows Registry Editor and navigate to:\
   `Computer\HKEY_LOCAL_MACHINE\SOFTWARE\GuardWare\DISCOVER`.
3. Confirm that the `organizationName` matches your Organisation
4. Confirm that the `serverPort` entry contains the correct HTTPS port value.
5. Confirm that the `serverIP` and `serverName` point to the correct domain address.

![](https://4044942488-files.gitbook.io/~/files/v0/b/gitbook-x-prod.appspot.com/o/spaces%2FPtAo3ilfcIjmOhwnXZVf%2Fuploads%2FqNqFVkqQ0Nw1mBopO2F0%2FUnknown%20image?alt=media\&token=104e94b6-243a-4030-b0de-e9ff52458e9d)

If the given values are incorrect, you will need to reconfigure the DISCOVER Scanning Server and re-establish the connection. To do this:

1. Press the <i class="fa-microsoft" style="color:blue;">:microsoft:</i> key, type **Task Scheduler**, and press **Enter**.
2. Search for **GuardWare Discover Agent Task,** right-click it, and select **End.**

![](https://4044942488-files.gitbook.io/~/files/v0/b/gitbook-x-prod.appspot.com/o/spaces%2FPtAo3ilfcIjmOhwnXZVf%2Fuploads%2FCVCzu08Aj7fz7Z3PcQF8%2FUnknown%20image?alt=media\&token=42274dd5-b609-4a77-b757-5c852890b20e)

3. Launch **Task Manager** by pressing **Ctrl + Shift + Esc** together.

![](https://4044942488-files.gitbook.io/~/files/v0/b/gitbook-x-prod.appspot.com/o/spaces%2FPtAo3ilfcIjmOhwnXZVf%2Fuploads%2F0kEk7tRQ9ypO1d1JiRae%2FUnknown%20image?alt=media\&token=3acb37f6-9792-4aa2-95b8-bca1e9f1cbc4)

4. Search for **GuardWare Scan Utility,** right-click the process, and select **End task.**
5. Open File Explorer, navigate to `C:\ProgramData\Guardware\GWScanningAgent`, and delete all the contents of the folder.

![](https://4044942488-files.gitbook.io/~/files/v0/b/gitbook-x-prod.appspot.com/o/spaces%2FPtAo3ilfcIjmOhwnXZVf%2Fuploads%2FEqW9brqPNSSXsNsSv1H4%2FUnknown%20image?alt=media\&token=4de9d663-2ebb-4037-b105-46afc10c10e2)

7. Navigate to `C:\Program Files\Guardware\Discover Agent`
8. **Right-click** `GuardWareDiscoverAgent.exe` and select **Run as administrator**.

![](https://4044942488-files.gitbook.io/~/files/v0/b/gitbook-x-prod.appspot.com/o/spaces%2FPtAo3ilfcIjmOhwnXZVf%2Fuploads%2FD0VgsmWOqfzLK4tNrha6%2FUnknown%20image?alt=media\&token=5754f1af-9906-492c-8b60-d14d908bad3e)

9. In your browser, refresh the Management Console page to see the reflected changes.

</details>

<details>

<summary>Who can I contact for technical support or further assistance?</summary>

For assistance, contact GuardWare support at <help@guardware.com.au>.

</details>


# Introduction to INSIGHT

GuardWare INSIGHT is a data visibility and monitoring solution that helps your organisation understand how data is being accessed, shared, and used across both internal and external environments. It provides a unified view of user activity and file movement, allowing you to detect unusual behaviour, potential data leaks, and policy violations in real time. By analysing user behaviour patterns and access trends, INSIGHT highlights anomalies and potential insider threats before they escalate.

INSIGHT continuously tracks activities such as data uploads, downloads, copies, email transfers, and print actions across corporate and non-corporate channels. This visibility helps your organisation identify where sensitive data resides, how it moves, and who interacts with it, enabling proactive data-loss prevention and compliance management.

INSIGHT works across desktops, servers, and cloud environments. Once installed, it begins collecting and displaying activity data in the GuardWare INSIGHT Management Console, where you can view dashboards, run reports, and manage alert configurations.

## GuardWare INSIGHT Architecture

![](https://3625419753-files.gitbook.io/~/files/v0/b/gitbook-x-prod.appspot.com/o/spaces%2FrbF1elaBmiAnq9oEPmNP%2Fuploads%2FcPaiIOwf2a0dErZxZhf3%2FINSIGHT_architecture.png?alt=media\&token=caeb8e64-62c3-4b15-b47b-948430af2f82)

GuardWare INSIGHT consists of three main components: the **Web Management Console**, **Windows Endpoint Devices (Agents)**, and **Exchange & SharePoint** **Cloud Services**, which communicate securely using HTTPS and Microsoft Graph API.

#### 1. Windows Endpoint Devices (Agents)

The **GuardWare INSIGHT Agent** is installed on each endpoint device, such as desktops, laptops, and servers, within your organisation. It continuously monitors user activities and file interactions, such as file uploads, downloads, and copies, email attachments, and print actions, access to non-corporate websites and applications, and so on.

The agent securely transmits all collected activity data to the Web Management Console using HTTPS (TLS-encrypted communication).

#### 2. Web Management Console

The Web Management Console is the central monitoring and reporting component of GuardWare INSIGHT. It can be deployed on-premises or hosted in the cloud, depending on your organisation’s infrastructure.

Key functions include:

* Receiving and processing data sent by endpoint agents.
* Communicating with Microsoft 365 services (Exchange and SharePoint Online) using the Microsoft Graph API.
* Applying policy rules, detecting risk levels, and correlating endpoint and cloud events.
* Displaying information through predefined and custom dashboards such as *Risk Summary*, *General*, *Risks*, and *SharePoint*.
* Managing alerts, reports, user permissions, and configurations.

#### 3. Exchange & SharePoint Cloud Services

GuardWare INSIGHT integrates directly with Microsoft 365 cloud services, specifically Exchange Online and SharePoint Online, to extend visibility to cloud-based activities. The Management Console communicates with these services through the Microsoft Graph API. This allows the collection of audit and activity logs, such as file access, sharing, downloads, email attachments, and external user activities.

GuardWare INSIGHT unifies endpoint and cloud data visibility, ensuring that every user action, whether on-premises or in the cloud, is tracked, analysed, and reported through a single management interface.


# GuardWare Components

GuardWare INSIGHT uses several core components that work together on each endpoint to monitor activity, protect data, enforce policies, and keep PCs connected to the Server.&#x20;

This page explains what each component does and how to enable and disable drivers and proxy/network monitoring.

## Drivers

Drivers operate at the system level on the device. They monitor specific activities and help INSIGHT apply security and monitoring rules.

1. **GWChatDocMon (File System Monitoring)**: Monitors activity in supported chat applications. It captures files shared through chat and sends them for inspection based on configured policies. It also handles scenarios such as double encryption during file transfers.
2. **GWUsbMon (USB File Transfers)**: Monitors file transfers to and from USB devices. It captures the files being transferred and sends the relevant data for further processing, supporting data loss prevention (DLP) use cases.
3. **GWScanner (USB Monitoring)**: Monitors USB activity from a productivity perspective. It detects connected USB devices, captures details such as serial numbers, and tracks usage, including devices already connected.
4. **GWPG (Process Guardian)**: Monitors and manages process-level activity related to device interactions, including USB operations, to ensure controlled execution and enforcement of policies.
5. **GWDogFile (File Guardian)**: Protects INSIGHT client files and components. It prevents unauthorised renaming, modification, or deletion of critical client files to maintain system integrity.

## GWClient

GWClient acts as the primary communication layer between the endpoint and the INSIGHT server.

* Establishes and maintains communication between the server and the endpoint.
* Downloads and applies policies, user settings, and configuration updates from the server.
* Sends system status, logs, and activity data back to the server.
* Handles commands from the server, such as policy updates or actions.
* Maintains handshake status (for example, whether endpoints are online).
* Updates local configurations, including registry settings, and distributes them to other components.

## GWW (Watcher)

GWW monitors user activity on the endpoint and acts as an intermediary between drivers and higher-level processing components.

* Monitors activities such as typing, file access, viewing, and printing.
* Detects sensitive data usage based on configured keywords or policies.
* Receives input from drivers and forwards it to the processing engine (engine DLL).
* Coordinates with other components to enforce policies based on detected activity.

## GWProxy

GWProxy monitors network-level activity on the endpoint.

* Tracks network traffic generated by applications.
* Enables inspection and control of data being transmitted over the network.
* Supports the enforcement of policies related to web and network usage.

These components work together to provide endpoint monitoring, data protection, and policy enforcement within GuardWare INSIGHT.

## Enable or Disable Drivers and Network Monitoring

You can enable or disable specific drivers and network monitoring, including switching between LSP and WFP, based on your organisation’s deployment and monitoring requirements.

{% hint style="warning" %}
Disable drivers and network monitoring only when required, such as troubleshooting system or application issues, resolving compatibility problems, or testing performance.&#x20;

Disabling drivers can reduce monitoring and control capabilities, so disable only the required driver. Disabling network monitoring stops traffic monitoring and enforcement, so it should be done with caution.&#x20;
{% endhint %}

1. Log in to the GuardWare Management Console.&#x20;
2. Navigate to **INSIGHT > Advanced Settings** and locate the Advanced Settings assigned to the device.&#x20;
3. Click **Edit** and go to the **Settings** section.
4. Edit the **Environment Settings**.
5. Enable or disable the settings you want.<br>

   <figure><img src="https://3625419753-files.gitbook.io/~/files/v0/b/gitbook-x-prod.appspot.com/o/spaces%2FrbF1elaBmiAnq9oEPmNP%2Fuploads%2FKYpGUfvsfELmN1JjS081%2Fimage.png?alt=media&amp;token=4da4c315-2ed5-4745-8d89-447d1ce4b274" alt=""><figcaption></figcaption></figure>
6. Once done, click **Review & Update**. The updated settings will then be applied to the devices assigned to those advanced settings.


# INSIGHT Glossary

A quick reference for INSIGHT-specific terms.

<table><thead><tr><th width="185.79998779296875">Term</th><th>Definition</th></tr></thead><tbody><tr><td><strong>Activity Log</strong></td><td>A chronological record of events, user actions, and system activities captured by INSIGHT.</td></tr><tr><td><strong>Advanced Setting</strong></td><td>A device-level configuration that controls how INSIGHT monitors activity, communicates with the server, and applies monitoring methods across endpoints.</td></tr><tr><td><strong>Agent</strong></td><td>The GuardWare INSIGHT software installed on an endpoint that collects and reports device, user, and activity information to the Management Console.</td></tr><tr><td><strong>Alert</strong></td><td>A notification generated when a configured condition, threshold, or rule is triggered.</td></tr><tr><td><strong>Audit Log</strong></td><td>A record of administrative actions and configuration changes performed within INSIGHT.</td></tr><tr><td><strong>Classification Label</strong></td><td>A sensitivity or handling label applied to a file or document and surfaced in INSIGHT events and reports.</td></tr><tr><td><strong>Cloud Monitor</strong></td><td>Monitoring for cloud-based activity, including actions performed in supported online services.</td></tr><tr><td><strong>Connection Status</strong></td><td>The communication state between an endpoint and the Management Console.</td></tr><tr><td><strong>Data Type</strong></td><td>A category of content identified by INSIGHT, such as regulated, confidential, or otherwise sensitive information.</td></tr><tr><td><strong>Event</strong></td><td>A recorded activity, action, or occurrence detected by the INSIGHT Agent.</td></tr><tr><td><strong>Event Log</strong></td><td>A collection of events captured from monitored endpoints and stored for analysis and reporting.</td></tr><tr><td><strong>Label Events</strong></td><td>Activity records that show when a classification label is added, changed, or removed from content.</td></tr><tr><td><strong>Management Console</strong></td><td>The web-based administration portal used to manage devices, agents, alerts, reports, and system settings.</td></tr><tr><td><strong>Monitoring</strong></td><td>The continuous collection and analysis of endpoint activity and system information.</td></tr><tr><td><strong>Organisation Settings</strong></td><td>Global configuration options that define how INSIGHT behaves across the organisation.</td></tr><tr><td><strong>Policy</strong></td><td>A configurable set of rules that determines how INSIGHT monitors, reports, or responds to endpoint activity.</td></tr><tr><td><strong>Risk Definition</strong></td><td>A rule or condition that determines how INSIGHT identifies, scores, and surfaces risky activity.</td></tr><tr><td><strong>Status Monitor</strong></td><td>A view or component that shows endpoint health, connectivity, agent state, and monitoring status.</td></tr><tr><td><strong>System Health</strong></td><td>Information about the operational status and performance of monitored devices and INSIGHT components.</td></tr><tr><td><strong>Tag</strong></td><td>A label assigned to devices or assets to simplify organisation and management.</td></tr><tr><td><strong>User Policy</strong></td><td>A rule set applied to a user or group that defines what INSIGHT monitors, reports, or protects.</td></tr></tbody></table>


# INSIGHT Quick Start Guide

GuardWare INSIGHT is a data visibility and monitoring solution that helps your organisation understand how data is being accessed, shared, and used across both internal and external environments. It provides a unified view of user activity and file movement, allowing you to detect unusual behaviour, potential data leaks, and policy violations in real time.

**Before you begin, make sure you have:**

* Access to the GuardWare Management Console.
* Endpoints ready for INSIGHT agent deployment.
* A Microsoft 365 Global Administrator account if you plan to monitor Exchange Online or SharePoint Online.

{% stepper %}
{% step %}

### Log in to the Console

1. Open the GuardWare Management Console.
2. Sign in with your admin account.
3. Complete 2FA, accept the EULA, and change the password if prompted.
   {% endstep %}

{% step %}

### Set up Cloud Monitor

Cloud Monitor audits user activities within your organisation’s Microsoft 365 environment, including Exchange Online and SharePoint Online.

To set up Cloud Monitor:

1. Navigate to **ORGANISATION** > **Integrations**.
2. Click **Connect Microsoft 365**.
3. Sign in with a Global Administrator account.
4. Approve MFA if prompted.
5. Select **Consent on behalf of your organisation**.
6. Click **Accept**.

Then go to **INSIGHT** > **Cloud Monitoring** and:

* Enable **Exchange Monitoring** if needed.
* Assign users to the monitoring group.
* Enable **SharePoint Monitoring** if needed.
* Run **Sync** to pull the latest Microsoft 365 data.<br>

  <figure><img src="https://3625419753-files.gitbook.io/~/files/v0/b/gitbook-x-prod.appspot.com/o/spaces%2FrbF1elaBmiAnq9oEPmNP%2Fuploads%2FOAlOFrFXHzybfI86lJEs%2FCloud%20Monitoring%20Settings.png?alt=media&amp;token=e6a57180-411a-43d3-8359-29e92db2d887" alt=""><figcaption></figcaption></figure>

{% endstep %}

{% step %}

### Download the INSIGHT Agent

The GuardWare INSIGHT Agent is installed on endpoint devices to continuously monitor user activities and file interactions, including file transfers, email attachments, printing, access to non-corporate websites and applications, etc.

1. Navigate to **Resources** > **Agent Download**.
2. Go to **INSIGHT Agent**.
3. Configure the required fields and click **Submit**.<br>

   <figure><img src="https://3625419753-files.gitbook.io/~/files/v0/b/gitbook-x-prod.appspot.com/o/spaces%2FrbF1elaBmiAnq9oEPmNP%2Fuploads%2FHDMjZI16AE5jZ2KKrPQV%2FDownload%20INSIGHT%20Agent.png?alt=media&amp;token=8c0f4448-73bf-4fce-9d6a-579109a5c38a" alt=""><figcaption></figcaption></figure>

Once the installation settings are complete, the **Download Installer** link becomes available. Click it to download the agent with the configured settings.
{% endstep %}

{% step %}

### Whitelist INSIGHT

Whitelist INSIGHT in the endpoints' AV, EDR, or XDR platforms.

1. Add `C:\Program Files (x86)\GuardWare\` to the allowlist.
2. Add `C:\ProgramData\Guardware` to the allowlist.

See [Whitelist GuardWare INSIGHT](/getting-started/install-insight-agent/whitelist-insight) for the full list of files, services, and network exceptions.
{% endstep %}

{% step %}

### Install INSIGHT Agent on endpoints

Deploy the INSIGHT agent on your endpoints.

To install INSIGHT Agent:

1. Run the INSIGHT Agent installer on the endpoint.
2. Complete the setup wizard.

{% hint style="info" %}
INSIGHT Agent can also be deployed via Active Directory, Microsoft Intune, and third-party solutions. See [Installation Methods](/getting-started/install-insight-agent/install-insight-agent#installation-methods) for details.
{% endhint %}

After deployment, open **INSIGHT** > **Devices** and confirm each device shows the expected:

* **Device Name** and **User Name**.
* **Setting Assigned** and **Last Online Time**.
* **Agent Version**.

If a device does not look right, use [INSIGHT Status Monitor](/documentation/insight/dashboard/insight-status-monitor) to review endpoint status.
{% endstep %}

{% step %}

### Configure Organisation Settings

Set the organisation-wide settings that INSIGHT uses for monitoring and reporting.

Navigate to **INSIGHT** > **Organisation Settings** and configure:

* **Working Days** for accurate activity timing.
* **Websites**, **Applications**, **Printers**, and **USBs** as organisational or non-organisational.
* **Email Domains** as organisational, insecure, or undefined.
* **Trusted Emails** to reduce false positives.
* **OneDrive Folder**, **AI Usages**, and **SharePoint** settings where needed.

<figure><img src="https://3625419753-files.gitbook.io/~/files/v0/b/gitbook-x-prod.appspot.com/o/spaces%2FrbF1elaBmiAnq9oEPmNP%2Fuploads%2FMIwSQT0XleovzPVDYw25%2FWorking%20Days.png?alt=media&amp;token=79c1702a-9b73-44c4-9245-38fee2ded27f" alt=""><figcaption></figcaption></figure>

For the detailed configuration steps, see [Organisation Settings](/documentation/insight/settings/organisation-settings).
{% endstep %}

{% step %}

### Create a User Policy and assign users

User Policies define how user activities are monitored, governed, and controlled within the organisation.

By default, new users are assigned to INSIGHT's base policy. If a different policy is configured as the default policy, all new users are automatically assigned to that policy.

To create a user policy:

1. Navigate to **INSIGHT** > **User Policies** and click **New User Policy**.
2. Add the policy name and description.
3. Configure the environment settings.
4. Add and configure the data types you want to monitor.
5. Save the policy.

<figure><img src="https://3625419753-files.gitbook.io/~/files/v0/b/gitbook-x-prod.appspot.com/o/spaces%2FrbF1elaBmiAnq9oEPmNP%2Fuploads%2FmslwJXLCHGMGMBQze32o%2FUsers%20policies.png?alt=media&amp;token=4df9da92-c0ef-48d0-bc1b-e87cef984a6d" alt=""><figcaption></figcaption></figure>

Then assign users from either:

* **INSIGHT** > **User Policies** > **Assign Users**.
* **End Users > INSIGHT > Assign Policies**.

See [User Policies](/documentation/insight/policies/user-policies) for more details.
{% endstep %}

{% step %}

### Define risk levels

Go to **INSIGHT** > **Risk Definition** and assign the risk levels for different user activities across applications, email, file sharing, and data transfers.

Start with the categories that matter most:

* SharePoint external and internal activity.
* Email, website uploads, and file-sharing applications.
* USB transfers, printing, keystrokes, copy/paste, and AI usage.

These risk levels drive dashboard visibility and help teams prioritise incidents.

<figure><img src="https://3625419753-files.gitbook.io/~/files/v0/b/gitbook-x-prod.appspot.com/o/spaces%2FrbF1elaBmiAnq9oEPmNP%2Fuploads%2FZNttTm2NZWdZ5Fa70qUI%2FRisk%20Definitions.png?alt=media&amp;token=c4b5b538-7345-4e4e-8104-ce7c87a564b6" alt=""><figcaption></figcaption></figure>

See [Risk Definitions](/documentation/insight/settings/risk-definitions) for more details.
{% endstep %}

{% step %}

### Configure Advanced Settings and assign to devices

Advanced Settings define the global monitoring parameters applied across audit reports and device policies in GuardWare INSIGHT.

The table below provides an overview of every Advanced Setting and what it does.

<table><thead><tr><th width="188.199951171875">Section</th><th>What It Does</th></tr></thead><tbody><tr><td><a href="#report-upload-and-communication-settings">Report Upload &#x26; Communication Settings</a></td><td>Controls the intervals, durations, timeouts, and bandwidth settings for uploading reports and downloading policies and commands.</td></tr><tr><td><a href="#applications-monitored-at-network-level">Applications Monitored at Network Level</a></td><td>Lists applications monitored for sensitive data uploads at the network level.</td></tr><tr><td><a href="#ip-addresses-not-monitored-at-network-level">IP Addresses Not Monitored at Network Level</a></td><td>Lists IP addresses included or excluded from network-level monitoring.</td></tr><tr><td><a href="#applications-with-monitored-ssl-traffic">Applications with Monitored SSL Traffic</a></td><td>Defines which applications have their SSL traffic monitored when network monitoring is used.</td></tr><tr><td><a href="#websites-with-monitored-ssl-traffic">Websites with Monitored SSL Traffic</a></td><td>Defines which websites have their SSL traffic monitored using certificate common names.</td></tr><tr><td><a href="#applications-with-monitored-keystrokes-and-copy-paste">Applications with Monitored Keystrokes and Copy/Paste</a></td><td>Specifies applications where keystroke and copy/paste activity is monitored or excluded.</td></tr><tr><td><a href="#websites-with-monitored-keystrokes-and-copy-paste">Websites with Monitored Keystrokes and Copy/Paste</a></td><td>Specifies websites where keystroke and copy/paste activity is monitored or excluded.</td></tr><tr><td><a href="#applications-monitored-at-network-level-lsp">Applications Monitored at Network Level (LSP)</a></td><td>Lists applications monitored at the network level using the LSP approach.</td></tr><tr><td><a href="#status-of-client-components">Status of Client Components</a></td><td>Lists client components and controls whether each is enabled or disabled.</td></tr><tr><td><a href="#file-extensions-monitored-at-file-system-level">File Extensions Monitored at File System Level</a></td><td>Filters file upload monitoring by file extension type.</td></tr><tr><td><a href="#applications-monitored-at-file-system-level">Applications Monitored at File System Level</a></td><td>Lists applications monitored for sensitive data uploads at the file system level.</td></tr><tr><td><a href="#applications-monitored-at-file-system-level-to-provide-file-path-information">Applications Monitored at File System Level to Provide File Path Information</a></td><td>Lists applications monitored to provide full file path data for network monitoring.</td></tr><tr><td><a href="#applications-monitored-at-file-system-level-where-repeated-incidents-are-ignored">Applications Monitored at File System Level where Repeated Incidents are Ignored</a></td><td>Suppresses repeated incident alerts from specified applications at the file system level.</td></tr><tr><td><a href="#applications-hosting-websites-with-end-to-end-encryption">Applications Hosting Websites with End-to-End Encryption</a></td><td>Lists browser applications monitored at the file system level to intercept file uploads on end-to-end encrypted websites.</td></tr><tr><td><a href="#websites-with-end-to-end-encryption">Websites with End-to-End Encryption</a></td><td>Lists websites with end-to-end encryption where file system monitoring is required alongside network monitoring.</td></tr></tbody></table>

To configure Advanced Settings:

1. Navigate to **INSIGHT** > **Advanced Settings,** and click **+ New Advanced Setting**.
2. Add a clear name and description.
3. Configure the settings you need.
4. Review and save the configuration.

<figure><img src="https://3625419753-files.gitbook.io/~/files/v0/b/gitbook-x-prod.appspot.com/o/spaces%2FrbF1elaBmiAnq9oEPmNP%2Fuploads%2Fj4AU6v8TKGP2FHUG0Cx8%2FAdvanced%20settings.png?alt=media&amp;token=3cf5d9ac-505f-48fd-b4e6-ea343b742a37" alt=""><figcaption></figcaption></figure>

Then assign the settings to devices from **INSIGHT** > **Advanced Settings > Assign Devices.**

See [Advanced Settings](/documentation/insight/policies/advanced-settings) for details.
{% endstep %}

{% step %}

### Configure Reports

Set up scheduled reporting once devices and users are active.

Configure:

* [Risk Summary](/documentation/insight/reporting/risk-summary-report) for a consolidated, high-level overview of risky activities and user behaviour of your organisation in a single email.
* [Cyber Awareness Report](/documentation/insight/reporting/cyber-awareness-report) for contextual reports via email sent directly to end users when a risk associated with their activity is triggered.

Use test emails before broad distribution. Then enable the schedules you want.

To configure **Risk Summary**:

1. Navigate to **INSIGHT** > **Risk Summary**.
2. Click **+ New Risk Summary**.
3. Set the schedule, filters, recipients, and widgets.
4. Send a test email, then save the report.

To configure **Cyber Awareness**:

1. Navigate to **INSIGHT** > **Cyber Awareness**.
2. Click **Configure Cyber Awareness Report**.
3. Choose the schedule, users, recipients, and risks.
4. Send a test email, then create the report.

See [Risk Summary](/documentation/insight/reporting/risk-summary-report) and [Cyber Awareness](/documentation/insight/reporting/cyber-awareness-report) for the full configuration steps.
{% endstep %}

{% step %}

### Monitor user activities in the Dashboard

Once data starts flowing, monitor activities from the dashboard in **INSIGHT** > **Dashboard**. INSIGHT Dashboard provides a centralised view of your organisation’s data activity, user behaviour, and potential security risks.

The dashboard includes the following Risk Category tabs, allowing you to switch between different risk areas. Each tab contains widgets that provide insights into data usage patterns, trends, and potential threats.

1. **Risk Summary** provides an overview of key security and data protection indicators across your organisation.
2. **Data Type Risks** help you review policy hits by content type.
3. **SharePoint Risks** help you review file access, downloads, anonymous links, and external sharing activity.
4. **AI Usage Risks** help you monitor AI websites, AI applications, file uploads, and sensitive prompts.
5. **Behaviour Risks** help you spot productivity trends and unusual activity patterns across users.
6. **Label Events** help you track activity involving labelled Office documents and emails.
7. **Location Risks** help you identify where risky activity is happening across countries and regions.
8. **Protected Files** help you monitor how protected files move through applications, email, websites, and storage devices.
9. **System Risks** help you monitor device status, active users, audit activity, and cloud sync health.

<figure><img src="https://3625419753-files.gitbook.io/~/files/v0/b/gitbook-x-prod.appspot.com/o/spaces%2FrbF1elaBmiAnq9oEPmNP%2Fuploads%2FDSuDvlrHYhi8kDchrk6E%2Fdefault%20dashboard.png?alt=media&amp;token=12990c41-98aa-485c-ac45-df4d72c74192" alt=""><figcaption></figcaption></figure>

You can also create a custom dashboard for your team and choose the users, devices, data types, risks, and widgets that matter most for that view.

For details, see [INSIGHT Dashboard](/documentation/insight/dashboard/insight-dashboard).
{% endstep %}
{% endstepper %}

With these steps complete, INSIGHT is ready to monitor activities and detect risks across your organisation.


# INSIGHT Partner Training Course

A 3-hour instructor-led training plan for partners.

### Format

See also: [INSIGHT Partner Training Course — 90 Minutes](/documentation/insight/getting-started/insight-partner-training-course-90-minutest-to-th)

**Total duration:** about 3 hours

* **Session 1:** Platform overview and deployment fundamentals — 45 minutes
* **Break:** 15 minutes
* **Session 2:** Governance, policies, and risk logic — 45 minutes
* **Break:** 15 minutes
* **Session 3:** Dashboards, reporting, investigation, and Q\&A — 45 minutes

### What partners should understand by the end

* How INSIGHT is deployed across endpoints and Microsoft 365.
* How organisation settings, user policies, risk definitions, and advanced settings work together.
* How to review activity, investigate incidents, and use dashboards and reports to drive action.

### Trainer preparation and demo environment checklist

Before delivering the training, prepare and verify the following:

* A reachable GuardWare Management Console URL.
* One working admin account that can sign in and complete 2FA.
* At least one online endpoint with the INSIGHT agent installed.
* At least one visible user account in **INSIGHT > End Users**.
* One configured user policy and one configured advanced setting.
* Risk definitions configured for the main monitored categories.
* Enough activity data to demonstrate dashboards, widget drill-downs, and reports.
* Microsoft 365 integration configured, or screenshots prepared, if Exchange Online or SharePoint Online monitoring will be shown.
* One demo endpoint with **INSIGHT Status Monitor** available.
* One prepared Risk Summary or Cyber Awareness email as a backup demo.
* Backup screenshots of key workflows in case live data is limited.

### Core reference material

* [Introduction to INSIGHT](/documentation/insight)
* [INSIGHT Quick Start Guide](/documentation/insight/getting-started/insight-quick-start-guide)
* [Cloud Monitor Settings](/documentation/insight/settings/cloud-monitoring)
* [Organisation Settings](/documentation/insight/settings/organisation-settings)
* [User Policies](/documentation/insight/policies/user-policies)
* [Risk Definitions](/documentation/insight/settings/risk-definitions)
* [INSIGHT Devices](/documentation/insight/users-and-devices/insight-devices)
* [INSIGHT Users](/documentation/insight/users-and-devices/insight-users)
* [INSIGHT Dashboard](/documentation/insight/dashboard/insight-dashboard)
* [Cyber Awareness](/documentation/insight/reporting/cyber-awareness-report)
* [INSIGHT Status Monitor](/documentation/insight/dashboard/insight-status-monitor)

### Terminology for the training

* **GuardWare Management Console** for the central web application.
* **INSIGHT Agent** for the endpoint software that collects and sends activity data.
* **Cloud Monitor** for Microsoft 365 monitoring across Exchange Online and SharePoint Online.
* **Organisation Settings** for global classifications and monitoring context such as websites, applications, printers, email domains, USBs, AI tools, and SharePoint libraries.
* **User Policy** for the rules applied to users to monitor, warn, or block activity.
* **Advanced Setting** for the device-level monitoring and communication configuration.
* **Data Type** for the sensitive content category INSIGHT detects and tracks.
* **Risk Definition** for the severity assigned to monitored activities.
* **Dashboard Widget** for the visual view used to summarise and drill into incidents.
* **Cyber Awareness Report** for user-facing email guidance triggered by defined risk conditions.

### Session 1: Platform overview and deployment fundamentals

**Duration:** 45 minutes

#### Session goal

Give partners a clear view of what INSIGHT monitors, how data reaches the console, and how to confirm the platform is working.

#### 1. Product overview — 10 minutes

Cover the core INSIGHT flow:

* Agents and cloud integrations collect activity.
* Policies and settings determine what is monitored.
* Risk definitions shape severity.
* Dashboards and reports surface what needs review.

Explain the three main components:

* GuardWare Management Console.
* Windows endpoint devices running the INSIGHT agent.
* Exchange Online and SharePoint Online through Cloud Monitor.

For reference, use [Introduction to INSIGHT](/documentation/insight).

#### 2. Accessing the system — 5 minutes

Show the standard admin access flow:

* Open the GuardWare Management Console.
* Sign in with the admin account.
* Complete 2FA, EULA acceptance, and password update if prompted.

Call out the difference between console access and Microsoft 365 consent during Cloud Monitor setup.

For reference, use [INSIGHT Quick Start Guide](/documentation/insight/getting-started/insight-quick-start-guide).

#### 3. Microsoft 365 integration and Cloud Monitor — 10 minutes

Cover this section when Exchange Online or SharePoint Online monitoring is in scope.

Show the setup path:

* **ORGANISATION > Integrations**
* **Connect Microsoft 365**
* Consent with a Global Administrator account
* **INSIGHT > Cloud Monitoring**

Then show what the connection enables:

* Exchange monitoring.
* SharePoint monitoring.
* User assignment to the monitoring group.
* Manual sync and last synced status.

For reference, use [Cloud Monitor Settings](/documentation/insight/settings/cloud-monitoring).

#### 4. Agent download, install, and validation — 10 minutes

Walk through the deployment path:

* **Resources > Agent Download**
* Configure and download the INSIGHT agent installer.
* Whitelist the agent where needed.
* Install the agent on a demo endpoint.
* Confirm the endpoint appears in **INSIGHT > Devices**.

Show how to validate:

* **Device Name** and **User Name**.
* **Setting Assigned**.
* **Last Online Time**.
* **Agent Version**.

For reference, use [INSIGHT Quick Start Guide](/documentation/insight/getting-started/insight-quick-start-guide) and [INSIGHT Devices](/documentation/insight/users-and-devices/insight-devices).

#### 5. Devices, users, and endpoint health — 10 minutes

Introduce the operational views used after deployment:

* **INSIGHT > Devices** for endpoint visibility and commands.
* **INSIGHT > End Users** for user visibility and policy assignment.
* **INSIGHT Status Monitor** for local endpoint validation and troubleshooting.

Demonstrate:

* Opening a device record.
* Opening a user record.
* Launching Status Monitor on the endpoint.
* Confirming the endpoint has received its settings.

For reference, use [INSIGHT Devices](/documentation/insight/users-and-devices/insight-devices), [INSIGHT Users](/documentation/insight/users-and-devices/insight-users), and [INSIGHT Status Monitor](/documentation/insight/dashboard/insight-status-monitor).

#### Demo outcomes

By the end of Session 1, partners should have seen:

* How INSIGHT is structured.
* How cloud monitoring is connected.
* How the agent is downloaded, installed, and validated.
* Where to confirm endpoint, user, and health status.

{% hint style="info" %}
If time is tight, keep the installer walkthrough short and rely on screenshots for the full install sequence.
{% endhint %}

### Session 2: Governance, policies, and risk logic

**Duration:** 45 minutes

#### Session goal

Show how INSIGHT decides what to monitor, how it scores risk, and how settings are applied across users and devices.

#### 1. Governance model overview — 5 minutes

Start with the relationship between the four core configuration areas:

* Organisation Settings define monitoring context.
* User Policies define what users are monitored for.
* Risk Definitions assign severity.
* Advanced Settings control device-level monitoring behaviour.

Explain the relationship:

* Organisation Settings reduce noise and improve context.
* User Policies define the monitored activities and control mode.
* Risk Definitions influence dashboard severity.
* Advanced Settings affect how endpoints collect and transmit data.

#### 2. Organisation Settings — 10 minutes

Show how to tune monitoring context across the organisation.

Cover:

* **Working Days** for accurate productivity and time-based analysis.
* **Websites** and **Applications** as organisational or non-organisational.
* **Printers**, **USBs**, and **Email Domains** for trusted and risky destinations.
* **Trusted Emails** to reduce false positives.
* **AI Usages**, **OneDrive Folder**, and **SharePoint** where relevant.

Explain why this matters:

* It improves reporting accuracy.
* It helps distinguish expected from risky behaviour.
* It supports better policy decisions.

For reference, use [Organisation Settings](/documentation/insight/settings/organisation-settings).

#### 3. User Policies — 15 minutes

This is the main working section of Session 2.

Start with the user policy lifecycle:

* Create a new policy.
* Configure environment settings.
* Add data types.
* Choose control modes.
* Assign users.

Cover the key settings:

* Application usage and blocked applications.
* Website usage and blocked websites.
* USB or storage control.
* Archive and password-protected file handling.
* Network access and connectivity.
* OCR for images and documents.
* Office document and Outlook email classification.

Then explain data type controls:

* **Off**.
* **Block**.
* **Monitor**.
* **Warn**.

Show a simple policy example:

* Monitor AI website uploads.
* Warn on sensitive email attachments.
* Block transfer of selected data types to storage media.

For reference, use [User Policies](/documentation/insight/policies/user-policies) and [INSIGHT Users](/documentation/insight/users-and-devices/insight-users).

#### 4. Risk Definitions — 5 minutes

Show how risk is assigned across categories such as:

* SharePoint activity.
* Email and file transfers.
* Printing, USB, keystrokes, and copy paste.
* AI usage and non-corporate websites or applications.

Explain why this matters:

* Dashboards become easier to prioritise.
* Reports become more meaningful.
* Teams can align severity with real business risk.

For reference, use [Risk Definitions](/documentation/insight/settings/risk-definitions).

#### 5. Advanced Settings and pushing changes — 10 minutes

Finish with the device-level configuration layer.

Cover:

* Report upload and communication settings.
* Network-level monitoring.
* SSL traffic monitoring.
* Keystroke and copy or paste monitoring scope.
* File-system monitoring and file extension scope.
* Assigning advanced settings to devices.-

Then show how to push or verify changes:

* Assign an advanced setting to a device.
* Use **Assign Command** where needed.
* Verify the applied configuration in Status Monitor.

For reference, use [INSIGHT Devices](/documentation/insight/users-and-devices/insight-devices) and [INSIGHT Status Monitor](/documentation/insight/dashboard/insight-status-monitor).

#### Demo outcomes

By the end of Session 2, partners should understand:

* How INSIGHT’s configuration layers fit together.
* How to create and assign a user policy.
* How risk levels shape dashboard visibility.
* How advanced settings affect endpoint monitoring.

### Session 3: Dashboards, reporting, investigation, and Q\&A

**Duration:** 45 minutes

#### Session goal

Turn collected activity into a practical review workflow. Show partners how to read dashboards, drill into incidents, and use reporting to support follow-up.

#### 1. Dashboard overview — 15 minutes

Open **INSIGHT > Dashboard** and explain the main risk categories:

* **Risk Summary** for high-level visibility.
* **Data Type Risks** for policy hits by content type.
* **SharePoint Risks** for cloud file activity.
* **AI Usage Risks** for AI websites, apps, prompts, and uploads.
* **Behaviour Risks** for productivity and heatmap views.
* **Label Events**, **Location Risks**, **Protected Files**, and **System Risks**.

Show how to use:

* The dashboard search and filters.
* Widget drill-down.
* User, device, data type, and time-based views.

For reference, use [INSIGHT Dashboard](/documentation/insight/dashboard/insight-dashboard).

#### 2. Incident review and investigation flow — 10 minutes

Show how an analyst or partner reviews activity in practice.

Demonstrate drill-downs from widgets such as:

* **Incidents by Data Type**.
* **Website Uploads** or **Application Transfer**.
* **Keystrokes** or **Copy Paste** when screenshot evidence is available.
* **SharePoint** widgets for internal or external access.

Explain what to review in the details:

* User and device.
* Activity type.
* Date and time.
* Data type.
* File name, path, or destination.
* Screenshot or detected content where available.

Prepare at least one earlier captured incident path before training day in case live activity is limited.

#### 3. Reports and awareness workflows — 10 minutes

Cover the reporting options that support follow-up:

* **Risk Summary** for scheduled summaries to admins.
* **Cyber Awareness** for contextual guidance sent to end users.
* Custom dashboards for team-specific views.

Explain when each is useful:

* Risk Summary for oversight.
* Cyber Awareness for behaviour change.
* Custom dashboards for role-specific monitoring.

For reference, use [Cyber Awareness](/documentation/insight/reporting/cyber-awareness-report) and [INSIGHT Dashboard](/documentation/insight/dashboard/insight-dashboard).

#### 4. Operational wrap-up and troubleshooting — 5 minutes

Finish by showing the main operational checks:

* Device online status.
* Last cloud sync.
* Audit activity.
* Status Monitor for endpoint diagnostics.

Position this as the standard first pass when a customer says data is missing, a device looks stale, or a setting has not applied.

For reference, use [INSIGHT Dashboard](/documentation/insight/dashboard/insight-dashboard), [INSIGHT Devices](/documentation/insight/users-and-devices/insight-devices), and [INSIGHT Status Monitor](/documentation/insight/dashboard/insight-status-monitor).

#### 5. Question and answer — 5 minutes

#### Demo outcomes

By the end of Session 3, partners should be able to:

* Navigate the main dashboard categories.
* Drill into incidents and explain what they mean.
* Use Risk Summary and Cyber Awareness in the right scenarios.
* Perform basic health and troubleshooting checks.

{% hint style="info" %}
If live incident data is limited, use prepared screenshots or a saved report to preserve the investigation flow.
{% endhint %}


# INSIGHT Partner Training Course -90 Minutest to th

**Total duration:** 1.5 hours

* **Session 1:** Platform overview and deployment essentials — 20 minutes
* **Break:** 15 minutes
* **Session 2:** Policies, risk logic, and core configuration — 20 minutes
* **Break:** 15 minutes
* **Session 3:** Dashboards, reporting, and Q\&A — 20 minutes

### What partners should understand by the end

* How INSIGHT is deployed across endpoints and Microsoft 365.
* How policies, organisation settings, and risk definitions shape monitoring.
* How to review activity in dashboards and use reports for follow-up.

### Trainer preparation and demo environment checklist

Before delivering the training, prepare and verify the following:

* A reachable GuardWare Management Console URL.
* One working admin account with 2FA completed.
* At least one online endpoint with the INSIGHT agen t installed.
* At least one visible user in **INSIGHT > End Users**.
* One configured user policy.
* Risk definitions configured for the main monitored categories.
* Enough activity data to demonstrate dashboard drill-downs and reports.
* Microsoft 365 integration configured, or screenshots prepared, if Exchange Online or SharePoint Online monitoring will be shown.
* One demo endpoint with **INSIGHT Status Monitor** available.

### Session 1: Platform overview and deployment essentials

**Duration:** 20 minutes

#### Session goal

Give partners a clear view of what INSIGHT monitors, how data reaches the console, and how to confirm the platform is working.

#### 1. Product overview - 5 minutes

Cover the core INSIGHT flow.

Explain the main components:

* GuardWare Management Console.
* Windows endpoints running the INSIGHT agent.
* Exchange Online and SharePoint Online through Cloud Monitor.

For reference, use [Introduction to INSIGHT](/documentation/insight).

#### 2. Access and Microsoft 365 setup — 5 minutes

Show the standard admin access flow:

* Sign in to the Management Console.
* Complete 2FA if prompted.
* Connect Microsoft 365 when cloud monitoring is in scope.

Then show what the integration enables:

* Exchange monitoring.
* SharePoint monitoring.
* Cloud sync visibility.

#### 3. Agent install and validation — 10 minutes

Walk through the deployment path:

* **Resources > Agent Download**.
* Download and install the INSIGHT agent.
* Confirm the device appears in **INSIGHT > Devices**.
* Confirm the user appears in **INSIGHT > End Users**.
* Use **INSIGHT Status Monitor** to verify health and settings.

Call out the key checks:

* Device and user name.
* Last online time.
* Assigned setting.
* Agent status.

For reference, use [INSIGHT Devices](/documentation/insight/users-and-devices/insight-devices), [INSIGHT Users](/documentation/insight/users-and-devices/insight-users), and [INSIGHT Status Monitor](/documentation/insight/dashboard/insight-status-monitor).

#### Demo outcomes

By the end of Session 1, partners should have seen:

* How INSIGHT is structured.
* How cloud monitoring is connected.
* How the agent is installed and validated.

### Session 2: Policies, risk logic, and core configuration

**Duration:** 20 minutes

#### Session goal

Show how INSIGHT decides what to monitor and how severity is applied.

#### 1. Configuration model overview — 5 minutes

Start with the relationship between the main configuration areas:

* **Organisation Settings** define the monitoring context.
* **User Policies** define monitored behaviour.
* **Risk Definitions** assign severity.
* **Advanced Settings** control endpoint behaviour.

#### 2. Organisation Settings and User Policies — 10 minutes

Show the highest-value settings first:

* Websites and applications.
* Email domains and trusted emails.
* USB and printer context.
* Data type controls inside a user policy.

Then show a simple policy example:

* Monitor AI website uploads.
* Warn on sensitive email attachments.
* Block selected transfers to storage media.

For reference, use [Organisation Settings](/documentation/insight/settings/organisation-settings) and [User Policies](/documentation/insight/policies/user-policies).

#### 3. Risk Definitions and applying changes — 5 minutes

Show how risk is assigned to monitored activities.

Explain why this matters:

* Dashboards become easier to prioritise.
* Reports become more meaningful.
* Teams can align alerts with business risk.

Then show how to verify that changes have applied on the endpoint.

For reference, use [Risk Definitions](/documentation/insight/settings/risk-definitions) and [INSIGHT Status Monitor](/documentation/insight/dashboard/insight-status-monitor).

#### Demo outcomes

By the end of Session 2, partners should understand:

* How the main INSIGHT settings fit together.
* How to create a simple user policy.
* How risk levels affect visibility.

### Session 3: Dashboards, reporting, and Q\&A

**Duration:** 20 minutes

#### Session goal

Show partners how to review activity quickly and explain the main follow-up options.

#### 1. Dashboard overview — 10 minutes

Open **INSIGHT > Dashboard** and focus on the core views:

* **Risk Summary**.
* **Data Type Risks**.
* **AI Usage Risks**.
* **Behaviour Risks**.
* **SharePoint Risks** when cloud monitoring is enabled.

Show how to use:

* Filters.
* Widget drill-down.
* User, device, and time-based views.

For reference, use [INSIGHT Dashboard](/documentation/insight/dashboard/insight-dashboard).

#### 2. Reporting and awareness workflows — 5 minutes

Cover the fastest reporting paths:

* **Risk Summary** for scheduled admin visibility.
* **Cyber Awareness** for end-user guidance.

Explain when each is useful:

* Risk Summary for oversight.
* Cyber Awareness for behaviour change.

For reference, use [Cyber Awareness](/documentation/insight/reporting/cyber-awareness-report).

#### 3. Q\&A and operational close — 5 minutes

Finish with the standard health checks:

* Device online status.
* Last cloud sync.
* Status Monitor for endpoint diagnostics.

Position this as the first response when a customer reports missing data or stale devices.

#### Demo outcomes

By the end of Session 3, partners should be able to:

* Navigate the main dashboard views.
* Drill into core incidents.
* Explain the role of Risk Summary and Cyber Awareness.
* Perform basic health checks.

{% hint style="info" %}
If time is tight, use one prepared dashboard path and one prepared report instead of multiple live examples.
{% endhint %}


# INSIGHT Training Course - 100 Minutes

## Overview

This training gives users a practical introduction to INSIGHT.

The objective is to help attendees deploy INSIGHT, configure core settings, and start monitoring user activities.

It covers:

* Product architecture and key components
* Microsoft 365 and endpoint monitoring setup
* Users, devices, policies, and organisation settings
* Risk definitions, reporting, dashboards, and troubleshooting

### Duration

* **Session 1** - 45 minutes
* **Break** - 10 minutes
* **Session 2** - 45 minutes

### Session 1 - 45 minutes

#### Topics covered

* INSIGHT overview
* How to connect Microsoft 365/Cloud Monitor
* How to deploy the INSIGHT Agent
* How users and devices appear in INSIGHT
* How to configure Organisation Settings
* How to create and assign a User Policy
* How to define risk levels

#### 1. Product overview and architecture - 5 minutes

Cover the product at a high level first.

**Explain**:

* What INSIGHT is
* Where it fits in the data security workflow
* How monitored activity becomes actionable risk

Review the components:

* **Management Console**
* **INSIGHT Agent**
* **Cloud Monitor**

Then explain the two monitoring models.

#### Endpoint monitoring

* Agent installed on the endpoint
* Monitors local user activity and data movement

#### Cloud monitoring

* Microsoft 365 integration connected in the console
* Monitors Exchange Online and SharePoint Online activity

#### 2. Microsoft 365 integration and console access - 5 minutes

This section introduces the first cloud setup steps in INSIGHT. It helps attendees understand how Microsoft 365 activity becomes visible in the console.

**Cover:**

* Admin sign-in flow
* Microsoft 365 connection path
* Exchange monitoring
* SharePoint monitoring
* Cloud activity visibility

**Demonstrate:**

* Signing in to the Management Console
* Connecting Microsoft 365

#### 3. Agent download and installation - 5 minutes

Walk through agent preparation for monitoring.

This section shows how to move from console setup to live endpoint monitoring. It should help attendees understand how to deploy and validate one test device.

**Cover:**

* Agent configuration
* Agent download path
* Agent installation flow

**Demonstrate:**

1. Configure the agent package from the console.
2. Download the installer.
3. Install the agent on a demo endpoint.
4. Confirm the device appears as online in INSIGHT.

**Trainer focus:**

* Show the minimum steps needed to get one device reporting
* Point out any endpoint or security software exclusions needed

#### 4. Users and devices - 10 minutes

This section explains where users and devices appear after deployment. It also shows how to maintain the device and assign commands.&#x20;

**Cover:**

* **Devices**
  * Device Maintenance
  * Assigning commands
  * Retrieving logs
* **End Users**

**Demonstrate:**

* How synced users appear
* How to uninstall and update the agent
* How to retrieve logs
* How to assign commands

#### 5. Organisation Settings - 5 minutes

Show the main organisational settings used to improve the monitoring context.

This section explains how organisational context improves the quality of monitoring. It helps attendees understand which settings make alerts and activity more meaningful.

**Cover:**

* Working days
* Websites and applications
* Email domains and trusted emails

**Demonstrate:**

* Opening Organisation Settings
* Reviewing working days
* Reviewing websites, applications, and trusted domains

#### 6. User Policies - 10 minutes

This section shows how INSIGHT moves from visibility into control. It gives attendees a practical example of how to build a user policy that monitors and responds to user behaviour.

**Cover:**

* Policy structure
* Monitored activities and data types
* Control actions
* User assignment

**Demonstrate:**

* Creating a policy
* Configuring monitored activities and data types
* Setting control actions
* Assigning users
* Building one simple demo example:
  * Monitor the AI website uploads
  * Warn on sensitive email attachments
  * Block selected file transfers

**Trainer focus:**

* Keep the example simple and realistic
* Show how policy settings affect captured events

#### 7. Risk Definitions - 5 minutes

Explain how severity is assigned across monitored activities.

This section explains how INSIGHT prioritises monitored events. It helps attendees understand how risk levels support review, reporting, and operational response.

**Cover:**

* How severity is assigned
* How risk levels support prioritisation

**Demonstrate:**

* Reviewing a sample risk definition
* Showing how severity appears in reporting

**Key points:**

* Easier dashboard prioritisation
* Better reporting context
* Closer alignment with business risk

### Break - 10 minutes

### Session 2 - 45 minutes

#### Topics covered

* How to configure Advanced Settings
* How to assign settings to devices
* How to configure Cyber Awareness and Risk Summary reports
* How to review dashboard data and drill into incidents
* How to validate endpoint health
* Common troubleshooting checks

#### 8. Advanced Settings - 15 minutes

This section explains how device behaviour is fine-tuned after the main policy is in place. It helps attendees focus on the settings that matter most for initial rollout and troubleshooting.

**Cover:**

* Communication and upload behaviour
* Monitoring scope
* Network and file-system monitoring
* Device assignment

**Demonstrate:**

* Creating an Advanced Setting
* Changing one or two key monitoring options
* Assigning the setting to a device

**Trainer focus:**

* Keep the demo to the highest-value settings
* Show how to confirm the assigned setting on the endpoint

#### 9. Reports - 10 minutes

Show the two main reporting paths.

This section shows how INSIGHT supports both awareness and oversight. It helps attendees choose the right report for coaching users or reviewing risk.

**Cover:**

* When to use **Cyber Awareness**
* When to use **Risk Summary**

**Demonstrate:**

* **Cyber Awareness** for end-user guidance
* **Risk Summary** for admin visibility

**Key points:**

* Cyber Awareness drives behaviour change
* Risk Summary supports operational oversight

#### 10. Dashboard and incident review - 10 minutes

Show how to move from high-level views into incident detail.

This section introduces the main workflow for reviewing activity in INSIGHT. It shows how to start from summary data and move into the details needed for investigation.

**Cover:**

* **Risk Summary**
* **Data Type Risks**
* **Behaviour Risks**

**Demonstrate:**

* Opening the main dashboard
* Reviewing high-level risk views
* Drilling into incidents

**Trainer focus:**

* Show how to filter by user, device, and time
* Show how to move from summary widgets into incident detail

#### 11. Endpoint health and troubleshooting - 5 minutes

Show the main checks to use when data looks missing.

This section gives attendees a simple validation path when endpoints are not reporting as expected. It focuses on the quickest checks to confirm status, sync, and applied settings.

**Cover:**

* **INSIGHT Status Monitor**
* Device online status
* Last sync and applied settings

**Demonstrate:**

* Opening **INSIGHT Status Monitor**
* Reviewing device online status
* Reviewing last sync and applied settings

**Trainer focus:**

* Position this as the first check when data looks missing
* Show how to confirm a policy or setting has applied

#### 12. Q\&A - 5 minutes

Overview

Leave time for open discussion.

This section gives attendees time to clarify setup, policy, and reporting questions. It also reinforces the workflows that matter most in their own environment.

**Cover:**

* Open questions from attendees
* Follow-up scenarios from the demo

**Demonstrate:**

* Revisiting one workflow if attendees need clarification

{% hint style="info" %}
If time is tight, prepare one policy example, one report example, and one dashboard drill-down in advance.
{% endhint %}


# INSIGHT Training Course - 3 Hours

## Overview

This training gives users a practical introduction to INSIGHT.

The objective is to help attendees deploy INSIGHT, configure core settings, and start monitoring user activities.

It covers:

* Product architecture and key components
* Microsoft 365 and endpoint monitoring setup
* Users, devices, policies, and organisation settings
* Risk definitions, reporting, dashboards, and troubleshooting

### Duration

* **Session 1** - 50 minutes
* **Break** - 10 minutes
* **Session 2** - 50 minutes
* **Break** - 10 minutes
* **Session 3** - 60 minutes

### Session 1 - 50 minutes

#### Topics covered

* INSIGHT overview
* How to connect Microsoft 365/Cloud Monitor
* How to deploy the INSIGHT Agent
* How users and devices appear in INSIGHT
* How to configure Organisation Settings

#### 1. Product overview and architecture - 5 minutes

Cover the product at a high level first.

Explain:

* What INSIGHT is
* Where it fits in the data security workflow
* How monitored activity becomes actionable risk

Review the components:

* **Management Console**
* **INSIGHT Agent**
* **Cloud Monitor**

Then explain the two monitoring models.

#### Endpoint monitoring

* Agent installed on the endpoint
* Monitors local user activity and data movement

#### Cloud monitoring

* Microsoft 365 integration connected in the console
* Monitors Exchange Online and SharePoint Online activity

#### 2. Microsoft 365 integration and console access - 10 minutes

Walk through the first admin access path.

Demonstrate:

* Signing in to the Management Console
* Connecting Microsoft 365

Then explain what the integration enables.

* Exchange monitoring
* SharePoint monitoring
* Cloud activity visibility

#### 3. Agent download and installation - 5 minutes

Walk through agent preparation for monitoring.

Demonstrate:

* Agent configuration
* Agent download
* Agent installation

1. Configure the agent package from the console.
2. Download the installer.
3. Install the agent on a demo endpoint.
4. Confirm the device appears as online in INSIGHT.

Trainer focus:

* Show the minimum steps needed to get one device reporting
* Point out any endpoint or security software exclusions needed

#### 4. Users and devices - 20 minutes

Cover:

* **Devices**
  * Device Maintenance
  * Assigning commands
  * Retrieving logs
* **End Users**

Demonstrate

* how synced users appear
* how to uninstall and update the agent&#x20;
* how to retrieve logs&#x20;
* how to assign commands

#### 5. Organisation Settings - 10 minutes

Show the main organisational settings used to improve the monitoring context.

Then explain the key Organisation Settings that improve monitoring context.

Examples:

* Working days
* Websites and applications
* Email domains and trusted emails

### Break - 10 minutes

### Session 2 - 50 minutes

#### Topics covered

* How to create and assign a User Policy
* How to define risk levels
* How to configure Advanced Settings
* How to assign settings to devices
* How to validate endpoint health

#### 6. User Policies - 15 minutes

Explain the user policy lifecycle.

Demonstrate:

* Creating a policy
* Configuring monitored activities and data types
* Setting control actions
* Assigning users

Use this simple demo example:

* Monitor the AI website uploads
* Warn on sensitive email attachments
* Block selected file transfers

Trainer focus:

* Show the link between policy rules and captured events
* Use one realistic policy example end to end

#### 7. Risk Definitions - 10 minutes

Explain how severity is assigned across monitored activities.

Focus on the value:

* Easier dashboard prioritisation
* Better reporting context
* Closer alignment with business risk

#### 8. Advanced Settings - 20 minutes

Explain the role of Advanced Settings first.

Cover:

* Communication and upload behaviour
* Monitoring scope
* Network and file-system monitoring
* Device assignment

Then demonstrate:

* Creating an Advanced Setting
* Changing one or two key monitoring options
* Assigning the setting to a device

Trainer focus:

* Keep the demo to the highest-value settings
* Show how to confirm the assigned setting on the endpoint

#### 9. Endpoint health and troubleshooting - 5 minutes

Demonstrate:

* **INSIGHT Status Monitor**
* Device online status
* Last sync and applied settings

Trainer focus:

* Position this as the first check when data looks missing
* Show how to confirm a policy or setting has applied

### Break - 10 minutes

### Session 3 - 60 minutes

#### Topics covered

* How to configure Cyber Awareness and Risk Summary reports
* How to review dashboard data and drill into incidents
* Common troubleshooting checks
* Q\&A

#### 10. Reports - 15 minutes

Show the two main reporting paths.

Demonstrate:

* **Cyber Awareness** for end-user guidance
* **Risk Summary** for admin visibility

Explain when to use each report.

Key point:

* Cyber Awareness drives behaviour change
* Risk Summary supports operational oversight

#### 11. Dashboard and incident review - 25 minutes

Demonstrate:

* Opening the main dashboard
* Reviewing high-level risk views
* Drilling into incidents

Start here so trainees can review activity at a higher level before moving into specific events.

Cover these views:

* **Risk Summary**
* **Data Type Risks**
* **Behaviour Risks**

Trainer focus:

* Show how to filter by user, device, and time
* Show how to move from summary widgets into incident detail

#### 12. Common troubleshooting checks - 15 minutes

Cover:

* Microsoft 365 connection status
* Agent connectivity and sync timing
* Policy and Advanced Setting assignment
* Missing activity validation steps

Trainer focus:

* Use a simple troubleshooting path from symptom to cause
* Keep the checks practical and repeatable

#### 13. Q\&A - 5 minutes

Leave time for open discussion.

{% hint style="info" %}
Prepare one policy example, one report example, and one dashboard drill-down in advance.
{% endhint %}


# INSIGHT Training Knowledge Check

A post-training multiple-choice questionnaire for INSIGHT participants.

## INSIGHT training knowledge check

Use this questionnaire after an INSIGHT training session. Choose one answer for each question.

### Questions

#### 1. What is the primary role of the INSIGHT Agent?

A. It creates scheduled reports.\
B. It monitors local endpoint activity and data movement.\
C. It manages Microsoft 365 permissions.\
D. It replaces the Management Console.

#### 2. Which INSIGHT component provides Exchange Online and SharePoint Online visibility?

A. INSIGHT Agent\
B. Management Console\
C. Cloud Monitor\
D. Risk Summary

#### 3. What must you confirm after installing the agent on an endpoint?

A. The device appears online in INSIGHT.\
B. A report has been sent.\
C. A risk definition has been created.\
D. A user policy has expired.

#### 4. Which organisation setting adds context for trusted communications?

A. Working days\
B. Trusted emails and email domains\
C. Device Maintenance\
D. Risk Summary

#### 5. What does a User Policy define?

A. Dashboard layout and report frequency\
B. Monitored activities, data types, control actions, and assigned users\
C. Microsoft 365 licence allocation\
D. Endpoint hardware requirements

#### 6. Which action is appropriate for a selected file transfer policy rule?

A. Block the transfer.\
B. Archive the device.\
C. Remove the user.\
D. Disable Cloud Monitor.

#### 7. Why do you configure Risk Definitions?

A. To install the endpoint agent.\
B. To assign severity and prioritise monitored activities.\
C. To connect Microsoft 365.\
D. To schedule agent updates.

#### 8. Which area controls communication, upload behaviour, and monitoring scope?

A. Advanced Settings\
B. Cyber Awareness\
C. Organisation Settings\
D. Risk Summary

#### 9. What can Advanced Settings be assigned to?

A. A dashboard widget\
B. A device\
C. A report recipient\
D. A Microsoft 365 tenant

#### 10. What is the first check when expected endpoint data is missing?

A. Delete the policy.\
B. Review the INSIGHT Status Monitor.\
C. Reconnect Microsoft 365.\
D. Export the Risk Summary.

#### 11. Which report helps educate end users and support behaviour change?

A. Cyber Awareness\
B. Risk Summary\
C. Device Maintenance\
D. Status Monitor

#### 12. Which report supports operational oversight for administrators?

A. Cyber Awareness\
B. Risk Summary\
C. User Policy\
D. Cloud Monitor

#### 13. What should you do first when reviewing activity in the dashboard?

A. Start with high-level risk views.\
B. Uninstall the agent.\
C. Create a new device.\
D. Delete existing incidents.

#### 14. Which filters help narrow dashboard results?

A. User, device, and time\
B. Licence, browser, and printer\
C. Password, region, and theme\
D. Agent version only

#### 15. Which checks help troubleshoot missing activity?

A. Microsoft 365 connection, agent connectivity, and setting assignment\
B. Dashboard colours, report templates, and browser cache\
C. Licence expiry, printer status, and user profile photo\
D. Device name, keyboard layout, and screen resolution

#### 16. When does an assigned device command run?

A. Immediately after the administrator selects it\
B. During the agent's next server communication\
C. Only during the next Microsoft 365 sync\
D. After the device is restarted

#### 17. What is the purpose of the **Application Scan** command?

A. Update the installed agent version\
B. Report the current installed applications\
C. Test Microsoft 365 connectivity\
D. Reset the device identifier

#### 18. What should you verify before assigning a command?

A. The device checked in recently\
B. The user has exported a report\
C. The dashboard uses the default filters\
D. The Microsoft 365 tenant has no MFA

#### 19. Which command helps resolve duplicate device reporting after device imaging?

A. Hardware Scan\
B. Force Reload Settings\
C. Refresh SSL Certificate\
D. Enable Test Communication Settings

#### 20. Which command should you use to retrieve a current hardware snapshot?

A. Application Scan\
B. Hardware Scan\
C. Uninstall Client\
D. Clear SSL Cache

#### 21. What does the **Uninstall Client** command do?

A. Removes the agent from selected devices\
B. Disables a user policy\
C. Disconnects Microsoft 365\
D. Deletes the device record

#### 22. What is the impact of an **Immediate** agent uninstall?

A. It waits for the next device restart\
B. It runs in the background without user interruption\
C. It interrupts the user session and restarts `explorer.exe`\
D. It only removes the agent after a scheduled sync

#### 23. Which account is required to connect Microsoft 365?

A. Exchange recipient account\
B. Azure Global Administrator account\
C. SharePoint site owner account\
D. Standard Microsoft 365 user account

#### 24. What must the administrator select on the Microsoft permissions screen?

A. Export device inventory\
B. Consent on behalf of your organisation\
C. Enable test communication settings\
D. Assign all users

#### 25. What does the **Sync** button in Cloud Monitoring do?

A. It updates the endpoint agent\
B. It synchronises configuration and user information from Microsoft 365\
C. It uninstalls inactive agents\
D. It rebuilds dashboard reports

#### 26. Where do you deploy an uploaded agent update?

A. **DEVICES** > **INSIGHT** > **Maintenance Mode** > **Update**\
B. **INSIGHT** > **Cloud Monitoring** > **Sync**\
C. **ORGANISATION** > **Integrations**\
D. **REPORTING** > **Risk Summary**

<details>

<summary>Trainer answer key</summary>

1. **B** — The agent monitors endpoint activity and data movement.
2. **C** — Cloud Monitor provides Microsoft 365 visibility.
3. **A** — Confirm the device is online and reporting.
4. **B** — Trusted emails and domains improve communication context.
5. **B** — Policies define monitoring, controls, and user assignments.
6. **A** — Policy rules can block selected file transfers.
7. **B** — Risk Definitions assign severity and improve prioritisation.
8. **A** — Advanced Settings control communications and monitoring scope.
9. **B** — Assign Advanced Settings to devices.
10. **B** — Status Monitor checks endpoint health and applied settings.
11. **A** — Cyber Awareness supports end-user guidance.
12. **B** — Risk Summary supports administrative oversight.
13. **A** — Review higher-level risks before incident detail.
14. **A** — Filter by user, device, and time.
15. **A** — Validate connections, agent status, and assignments.
16. **B** — Commands run during the agent's next server communication.
17. **B** — Application Scan returns current installed application data.
18. **A** — Confirm the device has checked in recently.
19. **B** — Force Reload Settings resolves identifier conflicts after imaging.
20. **B** — Hardware Scan reports device specifications and peripherals.
21. **A** — Uninstall Client removes the agent from selected devices.
22. **C** — Immediate uninstall interrupts the session and restarts `explorer.exe`.
23. **B** — Microsoft 365 connection requires an Azure Global Administrator.
24. **B** — Consent is granted on behalf of the organisation.
25. **B** — Sync refreshes Microsoft 365 configuration and user information.
26. **A** — Upload the MSI first, then deploy it from Maintenance Mode.

</details>


# INSIGHT Dashboard

The GuardWare INSIGHT Dashboard provides a centralised view of your organisation’s data activity, user behaviour, and potential security risks. It brings key insights into one place, helping you monitor file movements, SharePoint activity, email usage, AI tool usage, device activity, label events, location-based risks, and other sensitive events. The dashboard helps administrators and security teams to quickly detect unusual behaviour, assess risk levels, and investigate incidents across the organisation.

The dashboard includes the following Risk Category tabs, allowing you to switch between different risk areas. Each tab contains widgets that provide insights into data usage patterns, trends, and potential threats.

1. [Risk Summary](#risk-summary)
2. [Data Type Risks](#data-type-risks)
3. [SharePoint Risks](#sharepoint-risks)
4. [AI Usage Risks](#ai-usage-risks)
5. [Behaviour Risks](#behaviour-risks)
6. [Label Events](#label-events)
7. [Location Risks](#location-risks)
8. [Protected File](#protected-files)
9. [System Risks](#system-risks)

You can also create **custom dashboards** and choose the widgets according to your organisation’s monitoring priorities. For details on creating custom dashboards, see [Create a New Dashboard](#create-a-new-dashboard).

Use the **Search** icon in the top-right corner to filter the dashboard data.

<figure><img src="https://3625419753-files.gitbook.io/~/files/v0/b/gitbook-x-prod.appspot.com/o/spaces%2FrbF1elaBmiAnq9oEPmNP%2Fuploads%2F6X6WaKXOAM3fdOWWdr8F%2FFilter%20dashboard.png?alt=media&amp;token=7f5bc1a5-c29a-4f2d-bf96-e7b4d75362d2" alt=""><figcaption></figcaption></figure>

## Dashboard Risk Categories and Widgets

### Risk Summary

Risk Summary provides an overview of key security and data protection indicators across your organisation. It displays critical activities such as file sharing, data transfers, email usage, and device interactions, helping you identify potential risks and monitor sensitive information in real time.

This is particularly useful for executives and security managers who need a quick summary of data-related risks without navigating through detailed reports.

Each widget in this risk category displays the following:

1. Activities related to various categories like SharePoint, File and data transfer, file upload, usage of AI tools, non-corporate websites and applications, and so on.
2. The total number of users involved in specific activities or incidents during the specific period.
3. The total number of incidents recorded for each monitored category. (for example, how many files were downloaded).
4. Risk levels for each activity category.

You can export a widget’s data to **PDF or Excel** by clicking **Download Excel** or **Download PDF** in the top-right corner of the widget.

#### Risk Levels

Each activity in the widgets is assigned a risk level that indicates the severity of detected activities. The risk level for each activity is defined in [Risk Definitions](/documentation/insight/settings/risk-definitions).

<table><thead><tr><th width="145">Risk Level</th><th width="117">Colour</th><th>Description</th></tr></thead><tbody><tr><td>No Risk</td><td><span data-gb-custom-inline data-tag="emoji" data-code="2b1c">⬜</span> <strong>White</strong></td><td>No unusual or unauthorised activity detected. This includes routine activities within corporate policy.</td></tr><tr><td>Low Risk</td><td><span data-gb-custom-inline data-tag="emoji" data-code="1f7e9">🟩</span> <strong>Green</strong></td><td>Minor or low-impact activities that slightly deviate from standard policy but pose minimal threat, such as occasional access from non-corporate networks.</td></tr><tr><td>Medium Risk</td><td>🟨 <strong>Yellow</strong></td><td>Actions that may require review, such as occasional file transfers to external sites.</td></tr><tr><td>High Risk</td><td>🟥 <strong>Red</strong></td><td>Activities that indicate potential misuse or data breaches, such as unauthorised data sharing or file copying to external drives.</td></tr></tbody></table>

#### Widgets in Risk Summary <a href="#widgets-in-risks-summary-dashboard" id="widgets-in-risks-summary-dashboard"></a>

<table><thead><tr><th width="274">Category</th><th>Widget Name</th></tr></thead><tbody><tr><td><strong>SharePoint Activities</strong></td><td><a href="#external-sharepoint-events">​External SharePoint Events​</a></td></tr><tr><td>​</td><td><a href="#internal-sharepoint-events">​Internal SharePoint Events​</a></td></tr><tr><td><strong>Email Activities</strong></td><td><a href="#email-activities">​Email Activities​</a></td></tr><tr><td><strong>Data Transfers</strong></td><td><a href="#data-transfer-using-non-corporate-websites">​Data Transfer Using Non-Corporate Websites​</a></td></tr><tr><td>​</td><td><a href="#file-uploads-to-non-corporate-file-sharing-applications">​File Uploads to Non-Corporate File-Sharing Applications​</a></td></tr><tr><td><strong>Device Usage</strong></td><td><a href="#storage-device-risk">​Storage Device Risk​</a></td></tr><tr><td>​</td><td><a href="#printing-incidents">​Printing Incidents​</a></td></tr><tr><td>​</td><td><a href="#access-of-documents-on-local-devices">​Access of Documents on Local Devices​</a></td></tr><tr><td><strong>Behavioural Monitoring</strong></td><td><a href="#keystroke-capture">​Key Stroke Capture</a></td></tr><tr><td></td><td><a href="#copy-paste">Copy Paste</a></td></tr><tr><td></td><td><a href="#screen-capture">Screen Capture</a></td></tr><tr><td></td><td><a href="#access-of-documents-on-local-devices">Access of Documents on Local Devices</a></td></tr><tr><td>​</td><td><a href="#usage-of-ai-tools">​Usage of AI Tools​</a></td></tr><tr><td>​</td><td><a href="#usage-of-non-corporate-websites">​Usage of Non-Corporate Websites​</a></td></tr><tr><td>​</td><td><a href="#usage-of-non-corporate-applications">​Usage of Non-Corporate Applications</a></td></tr></tbody></table>

#### External SharePoint Events

The External SharePoint Events widget helps you track how files are accessed and shared by users outside your organisation, such as partners, vendors, or contractors. It highlights activities such as access or downloads from sensitive libraries, actions by anonymous or invited users, access from mobile devices, and file interactions through links shared on Teams.

This widget allows you to investigate events at multiple levels of detail:

* **Summary View:** Displays an overview of external SharePoint activities, including the number of users, total incidents, and risk level for each risk category.<br>

  <figure><img src="https://3625419753-files.gitbook.io/~/files/v0/b/gitbook-x-prod.appspot.com/o/spaces%2FrbF1elaBmiAnq9oEPmNP%2Fuploads%2FCsZHXWevEgnA6SNUkeQx%2FExternal%20SharePoint%20Events.png?alt=media&amp;token=e3a97b04-d541-460b-bc14-4a8ca47410fb" alt=""><figcaption></figcaption></figure>
* **Event Details View:** Click the **View** icon in the **ACTION** column to view detailed information, including username, email address, file name, incident date and time, file path, expiry date, URL, etc. Use the search filter at the top to quickly filter specific information.<br>

  <figure><img src="https://3625419753-files.gitbook.io/~/files/v0/b/gitbook-x-prod.appspot.com/o/spaces%2FrbF1elaBmiAnq9oEPmNP%2Fuploads%2FX5e8Auyx9EgYBgVOMYjr%2FExternal%20SharePoint%20Events%20-%20drilldown.png?alt=media&amp;token=a5b33764-a925-484c-ac11-b28de3480bae" alt=""><figcaption></figcaption></figure>

#### Internal SharePoint Events

The Internal SharePoint Events widget helps you track how files are accessed and shared by users within your organisation. It shows who has viewed, modified, or shared files across SharePoint, highlighting activities such as link creation for anonymous users, access to sensitive libraries, downloads from mobile devices, and file access through links shared on Teams.

<figure><img src="https://3625419753-files.gitbook.io/~/files/v0/b/gitbook-x-prod.appspot.com/o/spaces%2FrbF1elaBmiAnq9oEPmNP%2Fuploads%2FWoPJVnSlNhRaXDjEOHDj%2FInternal%20SharePoint%20Events.png?alt=media&amp;token=d491cd66-d2a2-428d-b35b-be43e575ad7f" alt=""><figcaption></figcaption></figure>

Click the **View** icon in the **ACTION** column to view detailed information, including the username, email address, file name, incident date and time, file path, expiration date, URL, etc. Use the search filter at the top to quickly filter specific information.

<figure><img src="https://3625419753-files.gitbook.io/~/files/v0/b/gitbook-x-prod.appspot.com/o/spaces%2FrbF1elaBmiAnq9oEPmNP%2Fuploads%2FLPvbEwSyisJhGufsjB1K%2FInternal%20SharePoint%20Events%20-%20drilldown.png?alt=media&amp;token=220cb222-45b9-4a2e-90c0-ee76febb361f" alt=""><figcaption></figcaption></figure>

#### Email Activities

The Email Activities widget provides an overview of email usage patterns across your organisation, helping you monitor how attachments and sensitive information are shared through corporate email channels. It tracks email attachments sent from corporate to non-corporate domains, as well as emails sent to insecure, personal, or internal corporate addresses, and attachments shared from non-corporate email accounts.

Click the **View** icon in the **ACTION** column to view detailed information, including the username, date and time, sender and recipient addresses, subject, and file name.

<figure><img src="https://3625419753-files.gitbook.io/~/files/v0/b/gitbook-x-prod.appspot.com/o/spaces%2FrbF1elaBmiAnq9oEPmNP%2Fuploads%2FHUJicKd39vtcClUPYIMJ%2FEmail%20activities.png?alt=media&amp;token=b24c1cbe-171b-4456-b81a-0f69b6ac6428" alt=""><figcaption></figcaption></figure>

Click the menu icon (**☰**) in the **ACTION** column to drill down further into the details, and use the search filter at the top to quickly filter for specific information.

#### Data Transfer using Non-Corporate Websites

The Data Transfer using Non-Corporate Websites widget helps you track file uploads or transfers made to non-corporate websites, such as public file-sharing services or personal cloud storage platforms. It helps you detect and prevent potential data leaks by identifying instances where sensitive files may have been transferred outside secure corporate networks.

Click the **View** icon in the **ACTION** column to view detailed information, including the username, PC name, file name, software used, website URL, and the date and time of the violation.

<figure><img src="https://3625419753-files.gitbook.io/~/files/v0/b/gitbook-x-prod.appspot.com/o/spaces%2FrbF1elaBmiAnq9oEPmNP%2Fuploads%2FtMJfT9ylHDh2TqrqAaPm%2FData%20Transfer%20using%20Non-Corporate%20Websites.png?alt=media&amp;token=a3bb38a8-4925-45a3-8ad5-7599eefc4b9b" alt=""><figcaption></figcaption></figure>

Click the menu icon (**☰**) in the **ACTION** column to drill down further into the details, and use the search filter at the top to quickly filter for specific information.

#### File Uploads to Non-Corporate File Sharing Applications

The File Uploads to Non-Corporate File Sharing Applications widget helps you track files uploaded via applications such as Dropbox or Google Drive that are not managed through your organisation’s approved corporate accounts. Frequent uploads to these applications can indicate attempts to bypass corporate storage policies or move confidential data to personal accounts.

Click the **View** icon in the **ACTION** column to view detailed information, including the username, file name, file path, application name, and violation date and time.

<figure><img src="https://3625419753-files.gitbook.io/~/files/v0/b/gitbook-x-prod.appspot.com/o/spaces%2FrbF1elaBmiAnq9oEPmNP%2Fuploads%2FjrxlWn7WMnwRgc9I5H13%2FFile%20Uploads%20to%20Non-Corporate%20File%20Sharing%20Applications.png?alt=media&amp;token=9b463abb-7f93-456b-a7f1-d822ff978abf" alt=""><figcaption></figcaption></figure>

Click the menu icon (**☰**) in the **ACTION** column to drill down further into the details, and use the search filter at the top to quickly filter for specific information.

#### Storage Device Risk

The Storage Device Risk widget helps you track files copied or moved to portable storage devices such as USB drives or external hard disks, along with the users who performed these actions. Because these transfers are often offline and unmonitored, this widget helps mitigate risks of data theft or accidental exposure through removable media.

Click the **View** icon in the **ACTION** column to view detailed information, including the username, file name, file path, transfer means, PC name, and violation date and time.

<figure><img src="https://3625419753-files.gitbook.io/~/files/v0/b/gitbook-x-prod.appspot.com/o/spaces%2FrbF1elaBmiAnq9oEPmNP%2Fuploads%2FmttsOpkfAa8SmwDAODiB%2FStorage%20Device%20Risk.png?alt=media&amp;token=6f36d856-164a-4fe7-a774-c9606a6150fe" alt=""><figcaption></figcaption></figure>

Click the menu icon (**☰**) in the **ACTION** column to drill down further into the details, and use the search filter at the top to quickly filter for specific information.

#### Printing Incidents

The Printing Incidents widget helps you track files printed using non-corporate or unauthorised printers. It provides visibility into printing activities that may lead to hard-copy data leaks.

Click the **View** icon in the **ACTION** column to view detailed information, including the username, file name, file path, printer name, PC name, and violation date and time.

<figure><img src="https://3625419753-files.gitbook.io/~/files/v0/b/gitbook-x-prod.appspot.com/o/spaces%2FrbF1elaBmiAnq9oEPmNP%2Fuploads%2F3R35lUO7d0uQYDLWK0DY%2FPrinting%20Incidents.png?alt=media&amp;token=0b8c33e8-f279-4153-b30a-ed4337d081d8" alt=""><figcaption></figcaption></figure>

Click the menu icon (**☰**) in the **ACTION** column to drill down further into the details, and use the search filter at the top to quickly filter for specific information.

#### Keystroke Capture

The Keystroke Capture widget helps you detect specific keywords or phrases typed by users that match predefined monitoring criteria (for example, financial terms, project codes, or classified labels). It helps detect early signs of policy violations, insider threats, or attempts to exfiltrate sensitive data through manual entry or chat messages. Additionally, screenshots are captured at the moment users type sensitive words, allowing you to visually review the exact scenario and better understand the intent and risk behind each action.

Click the **View** icon in the **ACTION** column to view detailed information, including the username, application name, PC name, violation date and time, and a screenshot of the violation.

<figure><img src="https://3625419753-files.gitbook.io/~/files/v0/b/gitbook-x-prod.appspot.com/o/spaces%2FrbF1elaBmiAnq9oEPmNP%2Fuploads%2FmnXy9SzEvW41K35GG4z9%2FKeystroke%20Capture.png?alt=media&amp;token=502142f3-9997-45cf-b549-47b9c8ec75e8" alt=""><figcaption></figcaption></figure>

Click the menu icon (**☰**) in the **ACTION** column to drill down further into the details, and use the search filter at the top to quickly filter for specific information.

#### Copy Paste

The Copy Paste widget helps you monitor how sensitive information is copied and pasted into non-corporate applications across your organisation, giving you visibility into potential data leakage risks. The widget provides an overview of users involved and the number of incidents associated with each user. Additionally, screenshots are captured at the moment sensitive content is pasted, allowing you to visually review the exact scenario and better understand the intent and risk behind each action.

Click the **View** icon in the **ACTION** column to view detailed information, including PC name, username, violation date and time, and a screenshot of the violation.

<figure><img src="https://3625419753-files.gitbook.io/~/files/v0/b/gitbook-x-prod.appspot.com/o/spaces%2FrbF1elaBmiAnq9oEPmNP%2Fuploads%2FAFsgRJmkXoWgr1bOfVPJ%2FCopy%20Paste.png?alt=media&amp;token=64aa8be3-79a5-42ab-887c-0b1b5bbc4e7a" alt=""><figcaption></figcaption></figure>

Click the menu icon (**☰**) in the **ACTION** column to drill down further into the details, and use the search filter at the top to quickly filter for specific information.

#### **Screen Capture**

The Screen Capture widget provides an overview of sensitive data captured through screenshots in corporate applications. It helps you monitor potential data exposure by identifying screen-capture incidents involving sensitive information, such as confidential business data, personal information, or other protected content.

<figure><img src="https://3625419753-files.gitbook.io/~/files/v0/b/gitbook-x-prod.appspot.com/o/spaces%2FrbF1elaBmiAnq9oEPmNP%2Fuploads%2FBOsEYyzSlvrjQV5bDV3S%2Fimage.png?alt=media&amp;token=682f0daa-c370-428f-ae53-8e5ef9650e07" alt=""><figcaption></figcaption></figure>

Click the risk or the **View** icon in the **ACTION** column to view all incidents associated with the risk and their detailed information, including the user, date and time of capture, application used to capture the screen, device name, location, and the associated screenshot. The screenshot enables you to review the captured content and investigate whether sensitive information was exposed.&#x20;

Click the menu icon (**☰**) in the **ACTION** column to drill down further into the details, and use the search filter at the top to quickly filter for specific information.

#### Access of Documents on Local Devices

The **Access of Documents on Local Devices** widget helps you track when Office documents, such as Word, Excel, or PowerPoint files, are opened on local devices. Tracking local document access helps ensure files are viewed only by authorised users and assists in identifying unusual access outside regular working patterns.

Click the **View** icon in the **ACTION** column to view detailed information, including the username, file name, file path, PC name, and violation date and time.

<figure><img src="https://3625419753-files.gitbook.io/~/files/v0/b/gitbook-x-prod.appspot.com/o/spaces%2FrbF1elaBmiAnq9oEPmNP%2Fuploads%2F1HREiPX2915XTwetImjr%2FAccess%20of%20Documents%20on%20Local%20Devices.png?alt=media&amp;token=d0128d16-b988-4feb-8291-bae6fa7217ec" alt=""><figcaption></figcaption></figure>

Click the menu icon (**☰**) in the **ACTION** column to drill down further into the details, and use the search filter at the top to quickly filter for specific information.

#### Usage of AI Tools

The **Usage of AI Tools** widget helps you track any instance where corporate files are uploaded to AI-powered platforms such as ChatGPT, Gemini, and similar tools. These tools may inadvertently store or process sensitive information externally.

Click the **View** icon in the **ACTION** column to view detailed information, including the username, application name, URL, PC name, and violation date and time.

<figure><img src="https://3625419753-files.gitbook.io/~/files/v0/b/gitbook-x-prod.appspot.com/o/spaces%2FrbF1elaBmiAnq9oEPmNP%2Fuploads%2F6azFvwlXWv9wENE3RNPo%2FUsage%20of%20AI%20Tools.png?alt=media&amp;token=fabc388d-3918-4a3f-88b5-3f34ce407ea8" alt=""><figcaption></figcaption></figure>

Click the menu icon (**☰**) in the **ACTION** column to drill down further into the details, and use the search filter at the top to quickly filter for specific information.

#### Usage of Non-Corporate Websites

The **Usage of Non-Corporate Websites** widget helps you track how much time users spend browsing or interacting with non-corporate websites. It helps identify productivity risks and potential exposure to untrusted domains.

<figure><img src="https://3625419753-files.gitbook.io/~/files/v0/b/gitbook-x-prod.appspot.com/o/spaces%2FrbF1elaBmiAnq9oEPmNP%2Fuploads%2FonOOW7TTLbfaDYlSa7cF%2FUsage%20of%20Non-Corporate%20Websites.png?alt=media&amp;token=9393daec-d608-4979-820e-cdb792e6bf68" alt=""><figcaption></figcaption></figure>

Click the **View** icon in the **ACTION** column to view detailed information, including the username, PC name, website source, total time spent on the website, and violation date. Use the search filter at the top to quickly filter specific information.

#### Usage of Non-Corporate Applications

The **Usage of Non-Corporate Applications** widget helps you monitor the use of unapproved applications that are not part of your organisation’s authorised software list. Frequent use of such tools can introduce vulnerabilities, create compliance risks, or bypass existing security controls.

<figure><img src="https://3625419753-files.gitbook.io/~/files/v0/b/gitbook-x-prod.appspot.com/o/spaces%2FrbF1elaBmiAnq9oEPmNP%2Fuploads%2FjpiGxRgz9fj6AyFf4oWu%2FUsage%20of%20Non-Corporate%20Applications.png?alt=media&amp;token=bd6bdffd-18f9-4e4e-98cc-8698c6b7f752" alt=""><figcaption></figcaption></figure>

Click the **View** icon in the **ACTION** column to view detailed information, including the username, PC name, application source, total time spent on the application, and violation date. Use the search filter at the top to quickly filter specific information.

### Data Type Risks

#### Widgets in Data Type Risks

<table><thead><tr><th width="274">Category</th><th>Widget Name</th></tr></thead><tbody><tr><td><strong>Incident Overview</strong></td><td><a href="#incidents-by-data-type">Incidents By Data Type</a></td></tr><tr><td><strong>File and Data Transfers</strong></td><td><a href="#application-transfer">Application Transfer</a></td></tr><tr><td>​</td><td><a href="#website-uploads">Website Uploads</a></td></tr><tr><td>​</td><td><a href="#storage-transfers">Storage Transfers</a></td></tr><tr><td><strong>Email and Printing</strong></td><td><a href="#printed-files">Printed Files</a></td></tr><tr><td>​</td><td><a href="#emails">Emails</a></td></tr><tr><td><strong>User Activity</strong></td><td><a href="#document-views">Document Views</a></td></tr><tr><td>​</td><td><a href="#keystrokes">Keystrokes</a></td></tr><tr><td>​</td><td><a href="#copy-paste-1">Copy Paste</a></td></tr><tr><td></td><td><a href="#screenshot">Screenshot</a></td></tr></tbody></table>

#### Incidents By Data Type

The **Incidents by Data Type** widget provides a breakdown of detected incidents based on predefined data types, helping you understand how sensitive information is being handled across different channels. You can use this widget to identify which types of sensitive data are most at risk, how they are being exposed, and through which user activities.

This widget allows you to investigate incidents at multiple levels of detail:

* **Summary View:** Displays an overview of incidents grouped by data type, helping you identify which sensitive data categories are most frequently involved in policy violations across different activities and channels.<br>

  <figure><img src="https://3625419753-files.gitbook.io/~/files/v0/b/gitbook-x-prod.appspot.com/o/spaces%2FrbF1elaBmiAnq9oEPmNP%2Fuploads%2FbW7v9EqfSfgDghgXQEx6%2FIncidents%20By%20Data%20Type.png?alt=media&amp;token=d26b273e-ab1c-4b0a-b683-7d52815a3f84" alt=""><figcaption></figcaption></figure>
* **Incident Details View:** Click a specific record to view detailed incident information, such as username, violation date and time, activity type, device name, file name, application, and detected data type.<br>

  <figure><img src="https://3625419753-files.gitbook.io/~/files/v0/b/gitbook-x-prod.appspot.com/o/spaces%2FrbF1elaBmiAnq9oEPmNP%2Fuploads%2Fq2PTnNpWMPr8UR2ZIJG7%2FIncidents%20By%20Data%20Type%20-%20drilldown%201.png?alt=media&amp;token=f89b6787-6ac3-42b0-a30d-04b196d03911" alt=""><figcaption></figcaption></figure>
* **Detected Content View:** Click the menu icon (☰) in the **ACTION** column to further investigate the incident and view the specific sensitive data or matched policy content detected within the file or activity.

#### Application Transfer

The **Application Transfer** widget helps you track policy violations detected during file transfers through specific applications or cloud-based services such as Dropbox, Google Drive, OneDrive, FileZilla, and WhatsApp. It provides visibility into tools, whether corporate-approved or not, being used to move data and users involved in moving the data, helping identify potential data-leakage channels or policy violations. You can filter the data by application name, data type, and user.

<figure><img src="https://3625419753-files.gitbook.io/~/files/v0/b/gitbook-x-prod.appspot.com/o/spaces%2FrbF1elaBmiAnq9oEPmNP%2Fuploads%2FVPDB7tDaL0tNxL0jTWla%2Fimage.png?alt=media&amp;token=75f4fe95-90b9-460c-814c-c6368f27e12c" alt=""><figcaption></figcaption></figure>

Click a specific record to view detailed information, including the username, date and time of the violation, application name, device name, file name, data type, and so on.

<figure><img src="https://3625419753-files.gitbook.io/~/files/v0/b/gitbook-x-prod.appspot.com/o/spaces%2FrbF1elaBmiAnq9oEPmNP%2Fuploads%2FPs48wZPQnmKfFBoiypnB%2FApplication%20Transfer%20-%20Drill%20down%201.png?alt=media&amp;token=57273e48-e140-4f39-9d20-77378b5369d8" alt=""><figcaption></figcaption></figure>

Click the menu icon (**☰**) in the **ACTION** column to further drill down into detected content in the transferred file.

#### Printed Files

The **Printed Files** widget helps you track violations related to printing activities and identify potential data leaks through physical copies. It helps you identify unauthorised or excessive printing of sensitive or confidential documents and trace which users and devices were involved. You can filter the data by printer name, rule, and user.

<figure><img src="https://3625419753-files.gitbook.io/~/files/v0/b/gitbook-x-prod.appspot.com/o/spaces%2FrbF1elaBmiAnq9oEPmNP%2Fuploads%2FlnyInC3ZNBieVbKXdQAe%2FPrinted%20files.png?alt=media&amp;token=a0f4215f-8786-4b20-9f1b-e334cddbfe8e" alt=""><figcaption></figcaption></figure>

Click a specific record to view detailed information, including the username, date and time of the violation, printer name, file name, data type, printer's location, first 500 characters of the printed document, and so on.

Click the menu icon (**☰**) in the **ACTION** column to further drill down into detected content in the printed file.

#### Emails

The **Emails** widget helps you track email-related policy violations across both message content and attachments, helping you monitor how sensitive information is shared within your organisation. It includes detailed insights into violations found in emails sent through both corporate and non-corporate accounts, allowing you to identify risks and ensure compliance with communication policies.

<figure><img src="https://3625419753-files.gitbook.io/~/files/v0/b/gitbook-x-prod.appspot.com/o/spaces%2FrbF1elaBmiAnq9oEPmNP%2Fuploads%2FqY8SiftmVLukshBUxKGC%2Fimage.png?alt=media&amp;token=b532dba8-6bd0-44fe-90d3-b0dc01214448" alt=""><figcaption></figcaption></figure>

Click a specific record to view detailed information, including the username, date and time of the violation, email provider, subject, data type, file name, device name, sender and recipient information, VPN used or not, location, SSID, and the first 500 characters of the email content.

Click the menu icon (**☰**) in the **ACTION** column to further drill down into detected content in the printed file.

#### Website Uploads

The **Website Uploads** widget helps you detect and prevent potential data leaks by identifying websites where sensitive content was uploaded or shared. This widget shows which files are transferred and the total number of uploads or transfers to both corporate and non-corporate websites, such as public file-sharing services or personal cloud storage platforms, along with the users who initiated them.

<figure><img src="https://3625419753-files.gitbook.io/~/files/v0/b/gitbook-x-prod.appspot.com/o/spaces%2FrbF1elaBmiAnq9oEPmNP%2Fuploads%2F7j0ZxqCsgpq1QjScccUo%2Fimage.png?alt=media&amp;token=bc805890-95bf-4422-9914-1da19f73fa2a" alt=""><figcaption></figcaption></figure>

Click a specific record to view detailed information, including the username, violation date and time, website URL, file name, device name, VPN used or not, location, SSID, and the first 500 characters of the transferred file.

<figure><img src="https://3625419753-files.gitbook.io/~/files/v0/b/gitbook-x-prod.appspot.com/o/spaces%2FrbF1elaBmiAnq9oEPmNP%2Fuploads%2FEQj2aQZ6p6Y2iNzLlAmy%2FWebsite%20Uploads%20-%20drilldown.png?alt=media&amp;token=26b4e91d-f453-4b39-8f7f-2d4cc52a57c5" alt=""><figcaption></figcaption></figure>

Click the menu icon (**☰**) in the **ACTION** column to further drill down into detected content in the transferred file.

#### Storage Transfers

The **Storage Transfers** widget helps you detect and prevent potential data leaks by identifying files copied or transferred to removable media. This widget shows the total number of files transferred to USB drives or external storage devices, along with the users who performed these actions, and provides detailed visibility into file transfers to help you ensure they align with your organisation’s policies.

<figure><img src="https://3625419753-files.gitbook.io/~/files/v0/b/gitbook-x-prod.appspot.com/o/spaces%2FrbF1elaBmiAnq9oEPmNP%2Fuploads%2FtpYjYa39fGcoAJFGec5N%2FStorage%20Transfers.png?alt=media&amp;token=b12a3913-ae58-4b62-94c2-1ca7ccddaa8b" alt=""><figcaption></figcaption></figure>

Click a specific record to view detailed information, including the username, violation date and time, website URL, file name, device name, file path, data type, VPN used or not, location, SSID, serial number of the USB, and the first 500 characters of the transferred file.

Click the menu icon (**☰**) in the **ACTION** column to further drill down into detected content in the transferred file.

#### Document Views

The **Document Views** widget helps you monitor how sensitive documents are accessed and viewed across your organisation. It provides detailed visibility into user activity, such as which documents were viewed and who viewed them, to ensure that confidential files are only accessed by authorised users within authorised limits.

Click a specific record to view detailed information, including the username, violation date and time, data type, VPN used or not, application used to view the file, file name, device name, file path, location, SSID, and the first 500 characters of the viewed file.

<figure><img src="https://3625419753-files.gitbook.io/~/files/v0/b/gitbook-x-prod.appspot.com/o/spaces%2FrbF1elaBmiAnq9oEPmNP%2Fuploads%2FbqTCEuuyZBdKJD7HeA00%2Fimage.png?alt=media&amp;token=9edbcd9b-2887-4f3c-9bf2-40686101c607" alt=""><figcaption></figcaption></figure>

Click the menu icon (**☰**) in the **ACTION** column to further drill down into detected content in the viewed file.

#### Keystrokes

The **Keystrokes** widget helps you track and monitor sensitive phrases entered by users across your organisation. It enables you to detect potential insider threats and identify attempts to manually share confidential information through chat messages, documents, or forms.

<figure><img src="https://3625419753-files.gitbook.io/~/files/v0/b/gitbook-x-prod.appspot.com/o/spaces%2FrbF1elaBmiAnq9oEPmNP%2Fuploads%2FDOQpYhafPjfKtKZ1wAPt%2Fimage.png?alt=media&amp;token=2945cbe9-9cc3-4638-8c2d-8e1832606fb1" alt=""><figcaption></figcaption></figure>

Click a specific record to view detailed information, including the username, violation date and time, data type, VPN used or not, application used to view the file, device name, location, and SSID. The widget also **includes a screenshot** of the user’s screen at the time the sensitive phrase was entered, providing additional context for investigation.

<figure><img src="https://3625419753-files.gitbook.io/~/files/v0/b/gitbook-x-prod.appspot.com/o/spaces%2FrbF1elaBmiAnq9oEPmNP%2Fuploads%2Fs1EBEJAEJ8PRNFILT3ss%2Fimage.png?alt=media&amp;token=96b1c1d5-7b9a-45cc-b245-4ec6d4ece673" alt=""><figcaption></figcaption></figure>

Click the menu icon (**☰**) in the **ACTION** column to further analyse the detected content.

#### Copy Paste

The **Copy Paste** widget helps you monitor how data is transferred between applications through copy and paste actions. It provides visibility into potential data leakage by identifying when sensitive information is copied and pasted from one application to another.

<figure><img src="https://3625419753-files.gitbook.io/~/files/v0/b/gitbook-x-prod.appspot.com/o/spaces%2FrbF1elaBmiAnq9oEPmNP%2Fuploads%2FvimdXYzNdFKwXHO8IwKZ%2Fimage.png?alt=media&amp;token=f2cb4ff6-37dd-42f8-a4c5-e93bb19a6bc3" alt=""><figcaption></figcaption></figure>

Click a specific record to view detailed information, including the username, violation date and time, source application, target application, data type, VPN used or not, application used to view the file, device name, location, and SSID. The widget also includes a screenshot of the user’s screen at the time the sensitive content was pasted, providing additional context for investigation.

Click the menu icon (**☰**) in the **ACTION** column to further analyse the copied content.

#### **Screenshot**&#x20;

The Screenshot widget provides a detailed view of screen-capture activities across the organisation. It helps you identify the applications in which screenshots are captured, the number of users involved, and the total number of recorded screenshot details.&#x20;

By default, the page displays screenshot activity by application name. The table includes the software name, user count, and detail count for each application. Use this view to identify applications with the highest volume of screenshot activity. <br>

<figure><img src="https://3625419753-files.gitbook.io/~/files/v0/b/gitbook-x-prod.appspot.com/o/spaces%2FrbF1elaBmiAnq9oEPmNP%2Fuploads%2Fk6IWXdFCQ48mCrkUjfGI%2Fimage.png?alt=media&amp;token=f6bbe827-881f-436d-b959-9ba44468e78d" alt=""><figcaption></figcaption></figure>

Click a specific record to view detailed information, including the user, date and time of capture, application used to capture the screen, device name, location, and the associated screenshot. The screenshot enables you to review the captured content and investigate whether sensitive information was exposed.&#x20;

Click the menu icon (**☰**) in the **ACTION** column to drill down further into the details, and use the search filter at the top to quickly filter for specific information.&#x20;

### SharePoint Risks

#### Widgets in SharePoint Risks

<table><thead><tr><th width="274">Category</th><th>Widget Name</th></tr></thead><tbody><tr><td><strong>File and User Activity</strong></td><td><a href="#sharepoint-file-access-and-download-logs-by-file-name-or-by-platform">SharePoint File Access And Download Logs By File Name Or By Platform</a></td></tr><tr><td><strong>Library Activity</strong></td><td><a href="#sharepoint-activity-logs-by-library-name">SharePoint Activity Logs By Library Name</a></td></tr><tr><td><strong>Link and Access Management</strong></td><td><a href="#sharepoint-anonymous-link-creation-by-file-name-or-by-username">SharePoint Anonymous Link Creation By File Name Or By Username</a></td></tr><tr><td>​</td><td><a href="#sharepoint-external-file-access-logs-by-file-name-or-by-username">SharePoint External File Access Logs By File Name Or By Username</a></td></tr><tr><td><strong>Downloads and Access by Platform</strong></td><td><a href="#sharepoint-file-download-logs-by-file-name">SharePoint File Download Logs By File Name</a></td></tr><tr><td>​</td><td><a href="#sharepoint-file-access-logs-by-platform">SharePoint File Access Logs By Platform</a></td></tr><tr><td>​</td><td><a href="#sharepoint-file-download-logs-by-platform">SharePoint File Download Logs By Platform</a></td></tr></tbody></table>

#### SharePoint File Access And Download Logs By File Name Or By Platform

The **SharePoint File Access And Download Logs By File Name Or By Platform** widget displays detailed logs of file access and download activity for SharePoint files. It provides visibility into how and where files are being used across your organisation’s SharePoint environment, helping you track external collaboration and detect potential unauthorised sharing through anonymous or external access links. You can filter the data by filename, platform name, and IP address.

For each file, the widget shows:

* **Secure Links Created**: Number of secure or organisation-approved sharing links created.
* **Anonymous Links Created**: Number of public or unrestricted sharing links generated.
* **Accessed by (Internal/External)**: Number of times files were accessed by internal or external users.
* **Downloaded by (Internal/External)**: Number of times files were downloaded within or outside the organisation.<br>

  <figure><img src="https://3625419753-files.gitbook.io/~/files/v0/b/gitbook-x-prod.appspot.com/o/spaces%2FrbF1elaBmiAnq9oEPmNP%2Fuploads%2FlhGH8Q6ZEzXxqWU5atIG%2FSharePoint%20File%20Access%20And%20Download%20Logs%20By%20File%20Name%20Or%20By%20Platform.png?alt=media&amp;token=03f91952-eb26-4d4f-875d-2ceda0450a6c" alt=""><figcaption></figcaption></figure>

Click a specific record to view detailed information, including the user who accessed or shared the file, file path, incident date and time, browser name, and so on.

#### SharePoint Activity Logs By Library Name

The **SharePoint Activity Logs By Library Name** widget displays activity logs for SharePoint libraries, showing file access, sharing, and download activity within each document library. It helps you track how data is being used within different libraries and identify which files or folders are being accessed most frequently, and detect unusual access patterns.

<figure><img src="https://3625419753-files.gitbook.io/~/files/v0/b/gitbook-x-prod.appspot.com/o/spaces%2FrbF1elaBmiAnq9oEPmNP%2Fuploads%2F7mALt8MHv5OFoaE4Tkq7%2FSharepoint%20Activity%20Logs%20By%20Library%20Name.png?alt=media&amp;token=a4e069ac-9d45-4f1a-87ba-00138e8d118a" alt=""><figcaption></figcaption></figure>

For each library, the widget lists details such as:

* **File Path and Site Name:** Location of the library and the associated SharePoint site.
* **File Name:** Name of the file stored in that library.
* **Secure Links Created / Anonymous Links Created:** Number of secure or public links generated for files within the library.
* **Accessed by (Internal/External):** Number of times files were accessed by internal staff or external users.
* **Downloaded by (Internal/External):** Number of times files were downloaded inside or outside the organisation.

Click a specific record to view detailed information, including the user who accessed the file, file name, file path, URL, incident date and time, browser name, and so on.

#### SharePoint Anonymous Link Creation By File Name Or By Username

The **SharePoint Anonymous Link Creation By File Name Or By Username** widget displays details of anonymous link creation activity within SharePoint. It helps you identify when files are shared publicly through links that allow access without authentication. The **SharePoint Anonymous Link Creation By File Name Or By Username** widget is crucial for monitoring data exposure risks, as anonymous links bypass user identity verification and can be forwarded to unauthorised recipients. By tracking which files and users are involved, you can review, revoke, or restrict public sharing and enforce secure link policies. You can filter the data by file name or user name.

For each file or user, the widget shows:

* **Number of Users:** How many users created anonymous links for the listed files.
* **Number of Incidents:** How many times anonymous links were generated for the same file or by the same user.

Click a specific record to view detailed information, including the user who created the link, file name, file path, URL, incident date and time, browser name, and so on.

#### SharePoint External File Access Logs By File Name Or By Username

The **SharePoint External File Access Logs By File Name Or By Username** widget provides visibility into external access activity for SharePoint files. It helps you track when and how files stored in SharePoint are being accessed by users outside the organisation’s domain. The **SharePoint External File Access Logs By File Name Or By Username** widget is essential for identifying data exposure risks through external collaboration or sharing. By reviewing external access patterns, you can verify whether file-sharing aligns with business requirements and take action to revoke access or strengthen permissions when needed. You can filter the data by file name or user name.

For each file or user, the widget includes:

* **Number of Users:** Total external users who accessed the file.
* **Number of Incidents:** Total number of times the file was accessed externally.

Click a specific record to view detailed information, including the user who accessed the file, file name, file path, URL, incident date and time, browser name, and so on.

#### SharePoint File Download Logs By File Name

The **SharePoint File Download Logs By File Name** widget displays detailed logs of file download activity within SharePoint. It helps you track which files are being downloaded, by whom, and how often, helping ensure that downloads comply with organisational data handling policies. You can filter the data by internal or external users.

For each file, the widget shows:

* **Number of Users:** Total users who downloaded the file.
* **Incidents:** Total number of download actions recorded for that file.

Click a specific record to view detailed information, including the user who downloaded the file, file name, file path, URL, incident date and time, browser name, and so on.

#### SharePoint File Access Logs By Platform

The **SharePoint File Access Logs By Platform** widget displays detailed records of SharePoint file access activity, categorised by platform or device type. It provides visibility into which operating systems and applications are being used to access SharePoint files, helping you detect unusual access from unauthorised devices, such as personal mobile phones or unregistered systems. You can filter the data by internal or external users.

For each platform, the widget shows:

* **Number of Users:** Total users who accessed files using that platform.
* **Incidents:** Total number of access events recorded for that platform.

Click a specific record to view detailed information, including the user who accessed the file, file name, file path, URL, incident date and time, browser name, and so on.

#### SharePoint File Download Logs By Platform

The **SharePoint File Download Logs By Platform** widget shows detailed information on SharePoint file download activity, categorised by platform or device type. It helps you identify which devices and operating systems are being used to download files, offering insights into unusual download patterns, such as large file transfers from unverified devices or unapproved operating systems. You can filter the data by internal or external users.

For each platform, the widget displays:

* **Number of Users:** Total users who downloaded files using that platform.
* **Incidents:** Total number of download actions recorded for that platform.

Click a specific record to view detailed information, including the user who downloaded the file, file name, file path, URL, incident date and time, browser name, and so on.

### AI Usage Risks

#### Widgets in AI Usage Risks

<table><thead><tr><th width="241.20001220703125">Category</th><th>Widget Name</th></tr></thead><tbody><tr><td><strong>AI Application Usage</strong></td><td><a href="#time-spent-on-generative-ai-application">Time Spent On Generative AI Application</a></td></tr><tr><td>​</td><td><a href="#file-uploaded-to-generative-ai-application">File Uploaded To Generative AI Application</a></td></tr><tr><td><strong>AI Website Usage</strong></td><td><a href="#time-spent-on-generative-ai-website">Time Spent On Generative AI Website</a></td></tr><tr><td>​</td><td><a href="#file-uploaded-to-generative-ai-website">File Uploaded To Generative AI Website</a></td></tr><tr><td><strong>Prompt Monitoring</strong></td><td><a href="#sensitive-prompt-used-in-website">Sensitive Prompt Used In Website</a></td></tr><tr><td></td><td><a href="#sensitive-prompt-used-in-ai-application">Sensitive Prompt Used In AI Application</a></td></tr><tr><td></td><td><a href="#all-prompts-used-in-ai-website">All Prompts Used In AI Website</a></td></tr></tbody></table>

#### Time Spent On Generative AI Application

The **Time Spent On Generative AI Application** widget displays how much time users spend using installed Generative AI applications on their devices, such as the desktop version of ChatGPT (e.g. `CHATGPT.EXE`) or other desktop-based AI tools. It shows the number of users who accessed the application and the total time spent, helping you understand how frequently AI tools are being used within the organisation. You can use this information to assess productivity impact, detect unauthorised AI tool usage, and ensure compliance with organisational policies.

Click any incident to view detailed information, including the username, application name, and total time spent on the application.

<figure><img src="https://3625419753-files.gitbook.io/~/files/v0/b/gitbook-x-prod.appspot.com/o/spaces%2FrbF1elaBmiAnq9oEPmNP%2Fuploads%2F9RZ5VNKejunZwuzu20aE%2Fimage.png?alt=media&amp;token=9d7017f5-e4aa-4693-aaed-cb637d211b0e" alt=""><figcaption></figcaption></figure>

Click the menu icon (**☰**) in the **ACTION** column to further analyse the incident details.

<figure><img src="https://3625419753-files.gitbook.io/~/files/v0/b/gitbook-x-prod.appspot.com/o/spaces%2FrbF1elaBmiAnq9oEPmNP%2Fuploads%2FDGoXnEEsWKAUyaoD03NY%2Fimage.png?alt=media&amp;token=b275c2e0-3f06-4b37-b298-231722dcc657" alt=""><figcaption></figcaption></figure>

#### Time Spent On Generative AI Website

The **Time Spent On Generative AI Website** widget displays time spent on AI websites or domains, listing the number of users and the total time spent on each platform. It provides visibility into how long employees interact with AI websites such as *ChatGPT*, *Claude*, *Gemini*, *DeepSeek*, and *so on*. You can use it to monitor engagement levels with AI tools, detect excessive usage, and evaluate whether users are relying on external AI systems for work-related tasks.

<figure><img src="https://3625419753-files.gitbook.io/~/files/v0/b/gitbook-x-prod.appspot.com/o/spaces%2FrbF1elaBmiAnq9oEPmNP%2Fuploads%2Fx31wHIKamqSG5BpRwzNJ%2Fimage.png?alt=media&amp;token=cf6702bb-733b-410c-8998-6e8c7ad93f8f" alt=""><figcaption></figcaption></figure>

Click any incident to view detailed information, including the username, website URL, and total time spent on the website.&#x20;

Click the menu icon (**☰**) in the **ACTION** column to further analyse the incident details.

#### File Uploaded To Generative AI Application

The **File Uploaded to Generative AI Application** widget helps you monitor file uploads to installed generative AI applications, such as CHATGPT.EXE and similar desktop-based AI tools. It shows which user uploaded which files to which AI applications, helping you track potential sharing of sensitive data. It helps you detect when corporate documents, reports, or other sensitive files are shared in AI software. This is useful for preventing data leakage through unmanaged or offline AI applications that bypass browser-based monitoring.

<figure><img src="https://3625419753-files.gitbook.io/~/files/v0/b/gitbook-x-prod.appspot.com/o/spaces%2FrbF1elaBmiAnq9oEPmNP%2Fuploads%2F1OwS5htCbBqXfsem4ErT%2Fimage.png?alt=media&amp;token=c98dad22-aa8f-4d57-a446-b0002a37435d" alt=""><figcaption></figcaption></figure>

Click any incident to view detailed information, including the username, violation date and time, file name, application name, device name, VPN used or not, SSID, and location.

Click the menu icon (**☰**) in the **ACTION** column to further analyse the incident details.

#### File Uploaded To Generative AI Website

The **File Uploaded to Generative AI Website** widget helps you monitor file uploads to web-based generative AI platforms, such as *ChatGPT*, *Claude*, *Gemini*, *Perplexity, and so on*. It provides visibility into which users uploaded which files to which online AI tools, helping you identify potential exposure of sensitive information.

<figure><img src="https://3625419753-files.gitbook.io/~/files/v0/b/gitbook-x-prod.appspot.com/o/spaces%2FrbF1elaBmiAnq9oEPmNP%2Fuploads%2FdYofYXFD46AYZFtgiDhQ%2Fimage.png?alt=media&amp;token=52833ab0-5e03-40c2-9d17-f4fca59162f7" alt=""><figcaption></figcaption></figure>

Click any incident to view detailed information, including the username, violation date and time, URL, file name, device name, VPN used or not, SSID, and location. Click the menu icon (**☰**) in the **ACTION** column to further analyse the incident details.

#### Sensitive Prompt Used In AI Website

The **Sensitive Prompts Used in AI Website** widget helps you monitor how users interact with web-based generative AI platforms using potentially sensitive prompts. It provides visibility into the type and frequency of sensitive information being entered into AI websites, helping you identify data exposure risks. It helps you review prompt-level violations and take corrective actions such as user training or access restrictions.

<figure><img src="https://3625419753-files.gitbook.io/~/files/v0/b/gitbook-x-prod.appspot.com/o/spaces%2FrbF1elaBmiAnq9oEPmNP%2Fuploads%2FSdaufmDttT80ro8xLmBl%2Fimage.png?alt=media&amp;token=bcfd626e-9b70-41a1-8fbe-af3e2e7ad1d2" alt=""><figcaption></figcaption></figure>

Click any incident to view detailed information, including the username, violation date and time, URL, device name, VPN used or not, SSID, and location.

Click the menu icon (**☰**) in the **ACTION** column to further analyse the incident details.

#### Sensitive Prompt Used In AI **Application**&#x20;

The **Sensitive Prompts Used in AI Application** widget helps you monitor how users interact with generative AI applications using potentially sensitive prompts. It provides visibility into the type and frequency of sensitive information being entered into AI applications, helping you identify data exposure risks. It helps you review prompt-level violations and take corrective actions such as user training or access restrictions.

<figure><img src="https://3625419753-files.gitbook.io/~/files/v0/b/gitbook-x-prod.appspot.com/o/spaces%2FrbF1elaBmiAnq9oEPmNP%2Fuploads%2FGsbo0UErCPDMcEJTYR3b%2Fimage.png?alt=media&amp;token=72c2deea-f1b2-4d0e-ab49-63cb1d0c0987" alt=""><figcaption></figcaption></figure>

Click any incident to view detailed information, including the username, violation date and time, application name, device name, VPN used or not, SSID, and location.

Click the menu icon (**☰**) in the **ACTION** column to further analyse the incident details.

#### All Prompts Used In AI Website

The **Sensitive Prompts Used in AI Website** widget helps you monitor how users interact with web-based generative AI platforms using potentially sensitive prompts. It provides visibility into the type and frequency of sensitive information being entered into AI websites, helping you identify data exposure risks. It helps you review prompt-level violations and take corrective actions such as user training or access restrictions.

<figure><img src="https://3625419753-files.gitbook.io/~/files/v0/b/gitbook-x-prod.appspot.com/o/spaces%2FrbF1elaBmiAnq9oEPmNP%2Fuploads%2FAwruQANyobKQ0HiceVds%2Fimage.png?alt=media&amp;token=f5e106d3-56d0-4818-94e7-40dfc111073b" alt=""><figcaption></figcaption></figure>

Click any incident to view detailed information, including the username, violation date and time, URL, device name, VPN used or not, SSID, and location.

Click the menu icon (**☰**) in the **ACTION** column to further analyse the incident details.

### Behaviour Risks

#### Widgets in Behaviour Risks

<table><thead><tr><th width="274">Category</th><th>Widget Name</th></tr></thead><tbody><tr><td><strong>Productivity Monitoring</strong></td><td><a href="#productivity">Productivity</a></td></tr><tr><td><strong>Activity Monitoring</strong></td><td><a href="#heatmap">Heatmap</a></td></tr><tr><td></td><td><a href="#search-terms">Search Terms</a></td></tr><tr><td></td><td><a href="#blocked-applications">Blocked Applications</a></td></tr><tr><td></td><td><a href="#blocked-websites">Blocked Websites</a></td></tr></tbody></table>

#### Productivity

The **Productivity** widget shows time spent by users on productive, unproductive, or uncategorised applications and websites. These categories are configured in [Organisation Settings](/documentation/insight/settings/organisation-settings), where applications and websites marked as **Organisational** are treated as productive, and **Non-organisational** are treated as unproductive. This widget helps you evaluate how users spend their time and identify opportunities to improve efficiency.

<figure><img src="https://3625419753-files.gitbook.io/~/files/v0/b/gitbook-x-prod.appspot.com/o/spaces%2FrbF1elaBmiAnq9oEPmNP%2Fuploads%2FONxgq9IfuHp3SeckjdAm%2FProductivity.png?alt=media&amp;token=daa89a30-2006-4af3-8109-6e5ff6e57611" alt=""><figcaption></figcaption></figure>

Click a percentage record to see the list of applications used by the user and the time spent on each application.

<figure><img src="https://3625419753-files.gitbook.io/~/files/v0/b/gitbook-x-prod.appspot.com/o/spaces%2FrbF1elaBmiAnq9oEPmNP%2Fuploads%2Fond9WMUBydLgy6leOpuK%2FProductivity%20-%20drilldown.png?alt=media&amp;token=a2c663e9-1042-4011-a032-70ed523dd387" alt=""><figcaption></figcaption></figure>

#### Heatmap

The **Heatmap** widget helps you analyse application usage patterns and identify periods of increased activity across users throughout the day. This widget displays user activity in a visual heatmap format, where each row represents a user and each column represents an hourly time period. Colour intensity indicates the level of application usage during that period, allowing you to quickly identify peak activity hours, unusual behaviour patterns, or excessive application usage.

<figure><img src="https://3625419753-files.gitbook.io/~/files/v0/b/gitbook-x-prod.appspot.com/o/spaces%2FrbF1elaBmiAnq9oEPmNP%2Fuploads%2FSV37lnQV2dyS5u0aXBgm%2FHeatmap.png?alt=media&amp;token=73d18fce-9ca7-4455-9ec7-ef2d4ab2a349" alt=""><figcaption></figcaption></figure>

Hover over a specific record to view the number of incidents recorded during that time period. Click the record to see detailed information such as incident date and time, application name, vendor, and total time spent on each application.

<figure><img src="https://3625419753-files.gitbook.io/~/files/v0/b/gitbook-x-prod.appspot.com/o/spaces%2FrbF1elaBmiAnq9oEPmNP%2Fuploads%2F3FZ9ybKdIckAFDTAKe3g%2FHeatmap%20-%20drilldown.png?alt=media&amp;token=98a26014-a4a7-43d8-b4a9-63b50d8c3509" alt=""><figcaption></figcaption></figure>

#### **Search Terms**

The Search Terms widget provides an overview of search-related activities across the organisation. It helps you identify and monitor users who have searched for sensitive data and the websites where the searches occurred.&#x20;

By default, the widget displays activity by user. Select **By URL** to view search-term activity grouped by website address.

<figure><img src="https://3625419753-files.gitbook.io/~/files/v0/b/gitbook-x-prod.appspot.com/o/spaces%2FrbF1elaBmiAnq9oEPmNP%2Fuploads%2FXCkwUuIGg9cyw5UgHT5b%2Fimage.png?alt=media&amp;token=898fd5c1-4c52-4e30-bdf0-2afa06bb5343" alt=""><figcaption></figcaption></figure>

Click any incident to view the incident details, such as device name, URL, search terms, browser used to search, incident date and time.

<figure><img src="https://3625419753-files.gitbook.io/~/files/v0/b/gitbook-x-prod.appspot.com/o/spaces%2FrbF1elaBmiAnq9oEPmNP%2Fuploads%2FtrgEBrk5r84MJ4LDODFg%2Fimage.png?alt=media&amp;token=712ed8e7-fa81-4b16-b45c-c0a5204e071b" alt=""><figcaption></figcaption></figure>

#### **Blocked Applications**

The Blocked Applications widget provides an overview of attempts to access applications that are restricted by organisational policy. It helps you identify users with repeated blocked-application activity and assess the volume of related incidents.

By default, the widget displays activity by user. Select **By Software** to view activity grouped by application. Click an incident count to view the related incident details.<br>

<figure><img src="https://3625419753-files.gitbook.io/~/files/v0/b/gitbook-x-prod.appspot.com/o/spaces%2FrbF1elaBmiAnq9oEPmNP%2Fuploads%2FrvvNsoWg2Qv6Gj6DlNxb%2Fimage.png?alt=media&amp;token=c31d47b1-7832-4ab7-93d6-75a66ed069e1" alt=""><figcaption></figcaption></figure>

Click any incident to view the incident details, such as device name, application name, vendor, incident date and time.<br>

<figure><img src="https://3625419753-files.gitbook.io/~/files/v0/b/gitbook-x-prod.appspot.com/o/spaces%2FrbF1elaBmiAnq9oEPmNP%2Fuploads%2F61yLCqMmAAW9SyoQcvqj%2Fimage.png?alt=media&amp;token=810a2c1b-fb4f-4ccb-bfb8-c06d40083dbf" alt=""><figcaption></figcaption></figure>

#### **Blocked Websites**

The Blocked Websites widget provides an overview of attempts to access websites that are restricted by organisational policy. It helps you monitor blocked web activity and identify users or websites with a high number of access attempts.

By default, the widget displays activity by user. Select **By URL** to view activity grouped by website address.&#x20;

<figure><img src="https://3625419753-files.gitbook.io/~/files/v0/b/gitbook-x-prod.appspot.com/o/spaces%2FrbF1elaBmiAnq9oEPmNP%2Fuploads%2FwmlMPBrCXTLy72vc4rJE%2Fimage.png?alt=media&amp;token=5b40cf4a-f6ff-4252-8d83-a6f9326061a4" alt=""><figcaption></figcaption></figure>

Click any incident to view the incident details, such as device name, URL, browser, incident date and time.

<figure><img src="https://3625419753-files.gitbook.io/~/files/v0/b/gitbook-x-prod.appspot.com/o/spaces%2FrbF1elaBmiAnq9oEPmNP%2Fuploads%2FevmM5G9ofwMNa2vWmpj4%2Fimage.png?alt=media&amp;token=82f3ef44-4213-4f16-a40f-32dd1ee9b1bb" alt=""><figcaption></figcaption></figure>

### Label Events

#### Widgets in Label Events

<table><thead><tr><th width="274">Category</th><th>Widget Name</th></tr></thead><tbody><tr><td><strong>Label Monitoring</strong></td><td><a href="#office-document">Office Document</a></td></tr><tr><td>​</td><td><a href="#email">Email</a></td></tr></tbody></table>

#### Office Document

The **Office Document** widget helps you track activities involving classified or sensitivity-labelled Microsoft Office documents within the organisation. This widget displays details of the labelled Office documents, helping you identify how sensitive or classified information is being created, modified, or accessed across the organisation.

Click the menu icon (**☰**) to expand the record and view detailed information such as label name, device name, host application, incident date and time, and URL of the document.<br>

<figure><img src="https://3625419753-files.gitbook.io/~/files/v0/b/gitbook-x-prod.appspot.com/o/spaces%2FrbF1elaBmiAnq9oEPmNP%2Fuploads%2FJS7GRfJefxw3XTOyTorK%2FOffice%20Document.png?alt=media&amp;token=5c2a0fe7-89f8-40d7-a9e7-ac4581dfdb5e" alt=""><figcaption></figcaption></figure>

You can also switch between **By User** and **By Label** views to analyse incidents from different perspectives.

#### Email

The **Email** widget helps you track email activities involving classified or sensitivity-labelled information within the organisation. This widget displays details of the labelled emails, helping you identify how sensitive or classified information is being shared through emails.

Click the menu icon (**☰**) to expand the record and view detailed information such as label name, device name, host application from where the email was sent, incident date and time, sender, recipient, and email subject.

<figure><img src="https://3625419753-files.gitbook.io/~/files/v0/b/gitbook-x-prod.appspot.com/o/spaces%2FrbF1elaBmiAnq9oEPmNP%2Fuploads%2FMRYVh1fLtpVjE563IQVH%2FEmail.png?alt=media&amp;token=c80e5a3b-3782-4ad8-a9c8-6b352239fcfe" alt=""><figcaption></figcaption></figure>

You can also switch between **By User** and **By Label** views to analyse incidents from different perspectives.

### Location Risks

**Location Risks** help you identify and analyse risk activities based on geographical locations. It helps organisations detect suspicious cross-region activities and gain better visibility into where sensitive data interactions are occurring. It provides a world map view highlighting countries where risks have been detected, allowing you to quickly identify regions with higher risk activity. The **Country List** table provides a detailed breakdown of incidents by country across different activity types, such as document views, email, storage transfer, web posts, data transfers, file uploads, printing, keystrokes, and copy-paste actions.

<figure><img src="https://3625419753-files.gitbook.io/~/files/v0/b/gitbook-x-prod.appspot.com/o/spaces%2FrbF1elaBmiAnq9oEPmNP%2Fuploads%2Fx0VsEndqXNSZc5iSMBiq%2Flocation%20risk%20widget.png?alt=media&amp;token=5baf0cdc-b375-40ef-aaf3-9e88f0d3345f" alt=""><figcaption></figcaption></figure>

Click on any incident count to view detailed information, including username, device name, violated rule name, file name, email details, incident date and time, and so on. Click the menu icon (**☰**) to further drill down into detected content in each activity.

<figure><img src="https://3625419753-files.gitbook.io/~/files/v0/b/gitbook-x-prod.appspot.com/o/spaces%2FrbF1elaBmiAnq9oEPmNP%2Fuploads%2FE5044axdOlKBAsPBq8hQ%2FLocation%20Risk%20-%20drilldown.png?alt=media&amp;token=d9802cfc-5b8c-4d8b-ab85-cd33b0a70f3b" alt=""><figcaption></figcaption></figure>

### Protected Files

#### Widgets in Protected Files

<table><thead><tr><th width="314.79998779296875">Category</th><th>Widget Name</th></tr></thead><tbody><tr><td><strong>File and Data Transfers</strong></td><td><a href="#application-transfer-protected">Application Transfer</a></td></tr><tr><td></td><td><a href="#email-attachments-protected">Email Attachments</a></td></tr><tr><td></td><td><a href="#website-uploads-protected">Website Uploads</a></td></tr><tr><td></td><td><a href="#storage-transfers-protected">Storage Transfers</a></td></tr></tbody></table>

#### Application Transfer <a href="#application-transfer-protected" id="application-transfer-protected"></a>

The **Application Transfer** widget helps you monitor the transfer of **protected files** through specific applications or cloud-based services such as Dropbox, Google Drive, OneDrive, FileZilla, and WhatsApp. It provides visibility into where protected files are being transferred, the applications being used, and the users involved in the transfers, helping you verify that protected data is being handled appropriately and identify potential policy violations or attempts to move sensitive information outside authorised channels. You can filter the data by application name and user.

<figure><img src="https://3625419753-files.gitbook.io/~/files/v0/b/gitbook-x-prod.appspot.com/o/spaces%2FrbF1elaBmiAnq9oEPmNP%2Fuploads%2FXxqvroYi5c9SIkZ0YFug%2FApplication%20Transfer%20-%20Protected%20files.png?alt=media&amp;token=8c05b4ea-6458-46f5-8c4d-aa9232814348" alt=""><figcaption></figcaption></figure>

Click an incident count to view detailed information, including the username, date and time of the violation, application name, device name, file name, data type, and so on.

<figure><img src="https://3625419753-files.gitbook.io/~/files/v0/b/gitbook-x-prod.appspot.com/o/spaces%2FrbF1elaBmiAnq9oEPmNP%2Fuploads%2F7h4eC9peRKGW5eiZwGiF%2FApplication%20Transfer%20drilldown%20-%20Protected%20files.png?alt=media&amp;token=11ab8b61-ae3a-40ad-a41c-e08fa227de86" alt=""><figcaption></figcaption></figure>

You can export the widget’s data to **PDF or Excel** by clicking the **Download Excel** or **Download PDF** **icons** in the top-right corner of the page.

#### Email Attachments <a href="#email-attachments-protected" id="email-attachments-protected"></a>

The **Email Attachments** widget helps you monitor how **protected files** are shared through email attachments. It provides visibility into which protected files are being sent, the users sending them, and the email accounts used, helping you ensure that sensitive information is shared in accordance with your organisation’s policies. This widget helps identify potential policy violations, unauthorised sharing of protected files, and risks associated with transmitting sensitive data through email. You can filter the data by user and email provider.

<figure><img src="https://3625419753-files.gitbook.io/~/files/v0/b/gitbook-x-prod.appspot.com/o/spaces%2FrbF1elaBmiAnq9oEPmNP%2Fuploads%2FvmU1FtATDaV43q54gggv%2FEmail%20Attachments%20-%20Protected%20Files.png?alt=media&amp;token=b8177385-66d3-4786-a714-8b967ae79798" alt=""><figcaption></figcaption></figure>

Click an incident count to view detailed information, including the email provider, email subject, sender and recipient email addresses, file name, device name, username, date and time of the violation, data type, whether a VPN was used, SSID, and the sender's location.

You can export the widget’s data to **PDF or Excel** by clicking the **Download Excel** or **Download PDF** **icons** in the top-right corner of the page.

#### Website Uploads <a href="#website-uploads-protected" id="website-uploads-protected"></a>

The **Website Uploads** widget helps you monitor the upload of **protected files** to websites, including both corporate and non-corporate platforms such as file-sharing services, cloud storage sites, and web applications. It provides visibility into which protected files are being uploaded, the websites receiving the files, and the users performing the uploads, helping you ensure that sensitive information is shared only through authorised channels. This widget helps identify potential policy violations and reduce the risk of sensitive data being exposed through web-based transfers. You can filter the data by website and user.

<figure><img src="https://3625419753-files.gitbook.io/~/files/v0/b/gitbook-x-prod.appspot.com/o/spaces%2FrbF1elaBmiAnq9oEPmNP%2Fuploads%2FgzjRqlumJcWRHOfAhKdJ%2FWebsite%20Uploads%20-%20Protected%20files.png?alt=media&amp;token=fe8d1844-f77d-43bf-904a-d84e85e80cf8" alt=""><figcaption></figcaption></figure>

Click an incident count to view detailed information, including the username, violation date and time, website URL, file name, device name, data type, VPN used or not, SSID, and location.

You can export the widget’s data to **PDF or Excel** by clicking the **Download Excel** or **Download PDF** **icons** in the top-right corner of the page.

#### Storage Transfers <a href="#storage-transfers-protected" id="storage-transfers-protected"></a>

The **Storage Transfers** widget helps you monitor the transfer of **protected files** to removable and external storage devices, such as USB drives and external hard drives. It provides visibility into which protected files are being transferred, the users performing the transfers, and the devices involved, helping you ensure that sensitive information is handled in accordance with your organisation’s policies. This widget helps identify potential policy violations and reduce the risk of data leakage through removable media.

<figure><img src="https://3625419753-files.gitbook.io/~/files/v0/b/gitbook-x-prod.appspot.com/o/spaces%2FrbF1elaBmiAnq9oEPmNP%2Fuploads%2FYwqx2d8Crjlv3Qx5ATKY%2FStorage%20Transfers%20-%20Protected%20files.png?alt=media&amp;token=57bbaa9d-27b6-4d72-b7c7-be26e79bdf52" alt=""><figcaption></figcaption></figure>

Click an incident count to view detailed information, including the device name, file name, file path, serial number of the USB, violation date and time, data type, VPN used or not, SSID, and location.

You can export the widget’s data to **PDF or Excel** by clicking the **Download Excel** or **Download PDF** **icons** in the top-right corner of the page.

### System Risks

#### Widgets in System Risks

<table><thead><tr><th width="274">Category</th><th>Widget Name</th></tr></thead><tbody><tr><td><strong>Activity Status</strong></td><td><a href="#online-devices">Online Devices</a></td></tr><tr><td>​</td><td><a href="#online-users">Online Users</a></td></tr><tr><td>​</td><td><a href="#online-web-console-users">Online Web Console Users</a></td></tr><tr><td>​</td><td><a href="#last-cloud-sync">Last Cloud Sync</a></td></tr><tr><td><strong>Inventory and Lists</strong></td><td><a href="#list-of-devices">List of Devices</a></td></tr><tr><td>​</td><td><a href="#list-of-users">List of Users</a></td></tr><tr><td>​</td><td><a href="#list-of-web-console-users">List of Web Console Users</a></td></tr><tr><td><strong>Administration and Monitoring</strong></td><td><a href="#audit-log">Audit Log</a></td></tr><tr><td>​</td><td><a href="#guardware-cloud-monitor">GuardWare Cloud Monitor</a></td></tr><tr><td>​</td><td><a href="#database-tables">Database Tables</a></td></tr><tr><td></td><td><a href="#network-usage">Network Usage</a></td></tr><tr><td><strong>Device Inventory</strong></td><td><a href="#devices---software-installed">Devices - Software Installed</a></td></tr><tr><td>​</td><td><a href="#devices---hardware-specification">Devices - Hardware Specification</a></td></tr></tbody></table>

#### Online Devices

The **Online Devices** widget displays the total number of devices that are active in the environment. This widget helps you quickly monitor endpoint availability and determine which systems are active across the network.

<figure><img src="https://3625419753-files.gitbook.io/~/files/v0/b/gitbook-x-prod.appspot.com/o/spaces%2FrbF1elaBmiAnq9oEPmNP%2Fuploads%2FqB6ZFRCEy4t0Q583zkJO%2FOnline%20DEVICES.png?alt=media&amp;token=f6dcbdd9-d932-43cb-b7f8-365e0384bec8" alt=""><figcaption></figcaption></figure>

#### Online Users

The **Online Users** widget displays the total number of users currently active in the environment. This widget helps you monitor active user sessions.

#### Online Web Console Users

The **Online Web Console Users** widget displays the number of users currently logged in to the GuardWare Management console. This widget helps you monitor active console access and track administrative or monitoring activities within the platform.

#### Last Cloud Sync

The **Last Cloud Sync** widget displays the most recent cloud synchronisation time between the endpoint devices and the Cloud Monitor. This widget helps you verify whether cloud synchronisation is occurring successfully and identify potential delays in data updates or communication.

#### List of Devices

The **List of Devices** widget provides detailed information about online and offline endpoint devices, such as device name, serial number, assigned username, and last online time, helping administrators monitor device connectivity and user-device associations. You can switch between **Online** and **Offline** views to filter devices based on their current connection status.

<figure><img src="https://3625419753-files.gitbook.io/~/files/v0/b/gitbook-x-prod.appspot.com/o/spaces%2FrbF1elaBmiAnq9oEPmNP%2Fuploads%2FT5gc378kc0DjypaSnuCW%2FList%20of%20devices.png?alt=media&amp;token=482929b1-6e32-4140-ace0-691250863d27" alt=""><figcaption></figcaption></figure>

#### List of Users

The **List of Users** widget displays users associated with endpoint devices along with their assigned device names and last online time. This widget helps you monitor user activity and identify when users were last connected to the system. You can switch between **Online** and **Offline** views to filter users based on their activity status.

<figure><img src="https://3625419753-files.gitbook.io/~/files/v0/b/gitbook-x-prod.appspot.com/o/spaces%2FrbF1elaBmiAnq9oEPmNP%2Fuploads%2Fh5MtiRN18WIJ6n3cZ45k%2FList%20of%20users.png?alt=media&amp;token=ea8a051b-bb76-41e3-ab78-2d813996342c" alt=""><figcaption></figcaption></figure>

#### List of Web Console Users

The **List of Web Console Users** widget displays users who have access to the GuardWare Management console, along with their last online activity. This widget helps you monitor console access and track user login activity within the management console. You can switch between **Online** and **Offline** views to filter users based on their login status.

#### Audit Log

The **Audit Log** widget provides a record of user and system activities performed within the Management Console. It displays details such as username, activity performed, and event time, helping you monitor administrative actions, track user activity history, and maintain audit visibility for security and compliance purposes.

<figure><img src="https://3625419753-files.gitbook.io/~/files/v0/b/gitbook-x-prod.appspot.com/o/spaces%2FrbF1elaBmiAnq9oEPmNP%2Fuploads%2FsBVj7NQO5pA3fjhVnxju%2Faudit%20log.png?alt=media&amp;token=40d2c142-5b89-431c-90b6-67d97084c2a2" alt=""><figcaption></figcaption></figure>

#### GuardWare Cloud Monitor

The **GuardWare Cloud Monitor** widget displays the certificate/token expiry information of the Cloud Monitor along with the last updated time. This widget helps you monitor certificate validity, ensure uninterrupted cloud communication, and identify certificates or tokens approaching expiration.

#### Database Tables

The **Database Tables** widget provides visibility into database usage and storage statistics within the environment. It displays details such as table name, row count, and table size in MB, helping you monitor database growth, identify large or heavily used tables, and manage storage utilisation more effectively.

#### Devices - Applications Installed

The **Devices - Applications Installed** widget provides information about applications installed across endpoint devices. It displays details such as application name, vendor, description, example installation path, and the number of devices where the software is installed. This widget helps you monitor software inventory, identify unauthorised or unapproved applications, and gain visibility into software distribution across devices. You can switch between **By Application Name** and **By PC** views to analyse the data from different perspectives.

<figure><img src="https://3625419753-files.gitbook.io/~/files/v0/b/gitbook-x-prod.appspot.com/o/spaces%2FrbF1elaBmiAnq9oEPmNP%2Fuploads%2FlgzAJfPXLqTRcXTSyGsx%2Fimage.png?alt=media&amp;token=2c921ea1-9679-4fc2-8103-6da098ca58da" alt=""><figcaption></figcaption></figure>

#### Devices - Hardware Specification

The **Devices - Hardware Specification** widget provides detailed hardware information for endpoint devices. It displays details such as device name, RAM, available free space, CPU information, hardware change count, and last audit time. This widget helps you monitor device hardware configurations, track hardware changes, and maintain visibility into system resources and endpoint specifications across the organisation.

<figure><img src="https://3625419753-files.gitbook.io/~/files/v0/b/gitbook-x-prod.appspot.com/o/spaces%2FrbF1elaBmiAnq9oEPmNP%2Fuploads%2FiNfl43IORbHWf1BbxXRn%2FDevices%20-%20Hardware%20Specs.png?alt=media&amp;token=d9784ac9-3438-4fae-b030-c1f4b0e88cf4" alt=""><figcaption></figcaption></figure>

#### **Network Usage**

The Network Usage widget provides an overview of networks accessed across the organisation. It helps you identify the wireless networks and Ethernet gateways used by monitored devices, along with the number of users connected to each network.

By default, the widget displays activity by network. Select **By User** to view the networks accessed by each user. Click a user count to view more details.

<figure><img src="https://3625419753-files.gitbook.io/~/files/v0/b/gitbook-x-prod.appspot.com/o/spaces%2FrbF1elaBmiAnq9oEPmNP%2Fuploads%2FVj2sOQacO8I5A5npOyjP%2Fimage.png?alt=media&amp;token=fad63eae-1f7f-4ead-961e-dcd7148796e9" alt=""><figcaption></figcaption></figure>

Click the menu icon (**☰**) to expand the record and view detailed information such as IP addresses, connection start and end dates, and connection duration.

<figure><img src="https://3625419753-files.gitbook.io/~/files/v0/b/gitbook-x-prod.appspot.com/o/spaces%2FrbF1elaBmiAnq9oEPmNP%2Fuploads%2Fz4B1UvdibrVoPTIdNdjN%2Fimage.png?alt=media&amp;token=5c88ae85-c36d-452d-8bb1-fcbdf959627e" alt=""><figcaption></figcaption></figure>

## Create a New Dashboard

1. Navigate to ***INSIGHT > Dashboard***.
2. Click **Configure Dashboards**.<br>

   <figure><img src="https://3625419753-files.gitbook.io/~/files/v0/b/gitbook-x-prod.appspot.com/o/spaces%2FrbF1elaBmiAnq9oEPmNP%2Fuploads%2F8fmSyYmkQicWZ0P23r4n%2FConfigure%20Dashboards.png?alt=media&amp;token=702460da-f46c-43c8-b7f6-1e2bdbe3f340" alt=""><figcaption></figcaption></figure>
3. Click **+New Dashboard**.<br>

   <figure><img src="https://3625419753-files.gitbook.io/~/files/v0/b/gitbook-x-prod.appspot.com/o/spaces%2FrbF1elaBmiAnq9oEPmNP%2Fuploads%2Fp1jvEpDoyfTwS8VJTGYI%2F%2BNew%20Dashboard.png?alt=media&amp;token=e6c34aa8-d8b6-43a5-a1d9-94f4e7755a30" alt=""><figcaption></figcaption></figure>
4. In **General Details**:
   1. Enter the **Dashboard Name** and **Description.** Use a clear, descriptive name that reflects the dashboard’s purpose.
   2. Select the **Duration** for which you want the data to be displayed (for example, Daily, Weekly, Monthly).
   3. Select **Set as an Active Dashboard** to make it visible and accessible from the Dashboard page. You can switch between active dashboards at any time using the **Switch Dashboard** dropdown.
   4. Click **Next**.<br>

      <figure><img src="https://3625419753-files.gitbook.io/~/files/v0/b/gitbook-x-prod.appspot.com/o/spaces%2FrbF1elaBmiAnq9oEPmNP%2Fuploads%2FyBIMn5UA0x3dXnf5dEHO%2FAdd%20new%20dashboard%20-%20General%20details.png?alt=media&amp;token=d615273a-14b2-4838-8418-048948fb6084" alt=""><figcaption></figcaption></figure>
5. In **Select Devices:**
   1. Search and select the devices you want to monitor in this dashboard and click **Next**. The dashboard will show activities performed on those specific devices only.
   2. You can also select a configured **Advanced Setting** from the dropdown to display only the devices associated with the selected Advanced Setting.<br>

      <figure><img src="https://3625419753-files.gitbook.io/~/files/v0/b/gitbook-x-prod.appspot.com/o/spaces%2FrbF1elaBmiAnq9oEPmNP%2Fuploads%2FDwdhNiP7jlhvHW80BiJe%2FAdd%20new%20dashboard%20-%20Select%20devices.png?alt=media&amp;token=8d53f2c5-711c-4848-b2d6-2d60b6df3ee4" alt=""><figcaption></figcaption></figure>
6. In **Select Users:**
   1. Search and select the users whose data you want to monitor in this dashboard and click **Next**.
   2. You can also select a configured **User policy** from the **Select policy dropdown** to display only the users associated with the selected policy.<br>

      <figure><img src="https://3625419753-files.gitbook.io/~/files/v0/b/gitbook-x-prod.appspot.com/o/spaces%2FrbF1elaBmiAnq9oEPmNP%2Fuploads%2FmqNzgeaIHSmVTRC9LZfL%2FAdd%20new%20dashboard%20-%20Select%20users.png?alt=media&amp;token=1da83f11-e487-4f26-b1f4-af079a219a78" alt=""><figcaption></figcaption></figure>
7. In **Select Data Types**, search and select the data types you want to monitor in this dashboard and click **Next**.\
   ![](https://3625419753-files.gitbook.io/~/files/v0/b/gitbook-x-prod.appspot.com/o/spaces%2FrbF1elaBmiAnq9oEPmNP%2Fuploads%2FIXlfejFiOpqpvyptPvnF%2FAdd%20new%20dashboard%20-%20Select%20data%20type.png?alt=media\&token=d89c5e86-c0e6-4640-b978-a7032c0ff08a)
8. In **Select Risks**, select the risks you want to monitor in this dashboard and click **Next**. These risks are displayed in Risk Summary.<br>

   <figure><img src="https://3625419753-files.gitbook.io/~/files/v0/b/gitbook-x-prod.appspot.com/o/spaces%2FrbF1elaBmiAnq9oEPmNP%2Fuploads%2FJ9piXoSBrrTUozEOS3lY%2FAdd%20new%20dashboard%20-%20Select%20risks.png?alt=media&amp;token=42914873-a1db-480f-9ee2-922f1fd6c6d7" alt=""><figcaption></figcaption></figure>
9. In **Select Widget**, select the widgets to customise your dashboard insights and click **Review and Save**. Only the selected widgets appear in the dashboard.<br>

   <figure><img src="https://3625419753-files.gitbook.io/~/files/v0/b/gitbook-x-prod.appspot.com/o/spaces%2FrbF1elaBmiAnq9oEPmNP%2Fuploads%2FCPupQNzmceJiuXSY25Sw%2FAdd%20new%20dashboard%20-%20Select%20widgets.png?alt=media&amp;token=fe285075-1faa-4ea5-bd19-b66aab971a1a" alt=""><figcaption></figcaption></figure>
10. Review the details and click **Save** to confirm the configuration. You'll see the newly created dashboard in the **Dashboards** list, from where you can view and edit the details.

## Edit a Dashboard

1. Navigate to ***INSIGHT > Dashboard***.
2. Click **Configure Dashboards**.
3. Search for the dashboard you want to edit and click **Edit** in the **ACTIONS** column.<br>

   <figure><img src="https://3625419753-files.gitbook.io/~/files/v0/b/gitbook-x-prod.appspot.com/o/spaces%2FrbF1elaBmiAnq9oEPmNP%2Fuploads%2FiGizqyytojvDFIbfdrvs%2FEdit%20a%20dashboard.png?alt=media&amp;token=ff3d18fb-7db9-4663-beda-84be6cffa1d3" alt=""><figcaption></figcaption></figure>
4. Update the details and click **Review and Save**.

## Delete a Dashboard

1. Navigate to ***INSIGHT > Dashboard***.
2. Click **Configure Dashboards**.
3. Search for the dashboard you want to delete and click the **Delete** icon in the **ACTIONS** column.<br>

   <figure><img src="https://3625419753-files.gitbook.io/~/files/v0/b/gitbook-x-prod.appspot.com/o/spaces%2FrbF1elaBmiAnq9oEPmNP%2Fuploads%2FOqnMmDMRr4wzfkEyKihv%2FDelete%20a%20dashboard.png?alt=media&amp;token=c912a79b-99a4-4e9b-9492-1a6047ad16cf" alt=""><figcaption></figcaption></figure>
4. In the confirmation alert, click **Yes, Delete it!** to confirm.

## View a Dashboard's Details

1. Navigate to ***INSIGHT > Dashboard***.
2. Click **Configure Dashboards**.<br>

   <figure><img src="https://3625419753-files.gitbook.io/~/files/v0/b/gitbook-x-prod.appspot.com/o/spaces%2FrbF1elaBmiAnq9oEPmNP%2Fuploads%2F06yipk20IGWPr2tiECMQ%2FView%20dashboard's%20details.png?alt=media&amp;token=c74502ca-46fd-4ded-8800-bcb2057997e0" alt=""><figcaption></figcaption></figure>
3. Search for the dashboard you want to view and click **View Details** in the **ACTIONS** column.\
   \
   You can review the selected dashboard's configuration, including the dashboard name, description, duration, and active status, along with the selected devices, users, data types, risks, and widgets. This helps you verify the dashboard setup before making changes.

## Set a Dashboard as Active

1. Navigate to ***INSIGHT > Dashboard***.
2. Click **Configure Dashboards**.
3. Search for the dashboard you want to set as active and enable the **SET AS ACTIVE** toggle.<br>

   <figure><img src="https://3625419753-files.gitbook.io/~/files/v0/b/gitbook-x-prod.appspot.com/o/spaces%2FrbF1elaBmiAnq9oEPmNP%2Fuploads%2FlZagk8Gegp95AmpHAnE1%2FSet%20as%20active.png?alt=media&amp;token=a3884c19-8262-4e40-9012-20bfce528f03" alt=""><figcaption></figcaption></figure>

<br>


# INSIGHT Status Monitor

The INSIGHT Status Monitor is a local diagnostic utility installed on devices that have GuardWare INSIGHT installed. It provides administrators with a direct view of the configurations and settings applied to the endpoint from the management console, and includes tools to generate logs and restart components.

The INSIGHT Status Monitor runs locally and monitors only the device on which it is installed. Typical use cases include:

* Verifying that a configuration or command sent from the management console has been applied to the endpoint.
* Generating logs to investigate unexpected behaviour.
* Restarting an INSIGHT component that is not functioning correctly.

## Launching the INSIGHT Status Monitor

1. Open **File Explorer** and navigate to `C:\Program Files (x86)\Guardware\INSIGHT`.<br>
2. Right-click `GWConsole.exe` and select **Run as administrator**.<br>

   <div align="left"><figure><img src="https://3625419753-files.gitbook.io/~/files/v0/b/gitbook-x-prod.appspot.com/o/spaces%2FrbF1elaBmiAnq9oEPmNP%2Fuploads%2FvtfDqQhEu7mkqpg66gRm%2Fimage.png?alt=media&amp;token=c64fa954-41a0-4d27-b3ca-8197aefea00a" alt="" width="390"><figcaption></figcaption></figure></div>

## Dashboard

The Dashboard displays a summary of the endpoint's current configuration and connectivity status. All values are read-only and reflect the settings applied from the management console.

<figure><img src="https://3625419753-files.gitbook.io/~/files/v0/b/gitbook-x-prod.appspot.com/o/spaces%2FrbF1elaBmiAnq9oEPmNP%2Fuploads%2FWsEJzHXYNV1VzqR0JBRl%2Fimage.png?alt=media&amp;token=d82443c7-88a5-4f12-b341-f1fbcc031907" alt="" width="563"><figcaption></figcaption></figure>

If a configuration does not reflect what was sent from the management console, resend the command from the console and verify again.

<table><thead><tr><th width="190">Field</th><th>Description</th></tr></thead><tbody><tr><td>Username</td><td>The username associated with this endpoint.</td></tr><tr><td>Client Version</td><td>Shows the installed INSIGHT client's version.</td></tr><tr><td>Settings Updated Time</td><td>The date and time the endpoint's configuration was last updated.</td></tr><tr><td>Client Server Interval</td><td>The interval at which the client communicates with the server, as configured in the management console.</td></tr><tr><td>Report Interval</td><td>The interval at which the endpoint sends reports to the server, as configured in the management console.</td></tr><tr><td>Report Bandwidth</td><td>The bandwidth allocated for reporting, as configured in the management console.</td></tr><tr><td>Last Active Time</td><td>The date and time the endpoint was last active.</td></tr><tr><td>Server IP</td><td>The IP address of the server the endpoint is connected to.</td></tr><tr><td>Server Name</td><td>The name of the connected server.</td></tr><tr><td>Next Report Generation</td><td>Displays the next report generation date and time.</td></tr><tr><td>Location</td><td>Management console organisation that the device is associated with.</td></tr><tr><td>Bulk Report Time</td><td>Displays the bulk report time.</td></tr><tr><td>Report Packet Size</td><td>Displays the maximum packet size or reports.</td></tr><tr><td>Common Timeout</td><td>Displays the Common timeout duration.</td></tr><tr><td>Settings Timeout</td><td>Displays the Settings timeout duration.</td></tr><tr><td>Globals Timeout</td><td>Displays the Global timeout duration.</td></tr><tr><td>Client Timeout</td><td>Displays the client timeout duration.</td></tr><tr><td>Profile Name</td><td>Displays the Profile Name.</td></tr></tbody></table>

### View Logs Archive Logs

Archive Logs packages the endpoint's log files into a ZIP archive and saves it to the desktop. The log types included in the archive are determined by the selections made in [**Log Handling**](#log-handling).

1. Click **Download Logs**.<br>

   <div align="left"><figure><img src="https://3625419753-files.gitbook.io/~/files/v0/b/gitbook-x-prod.appspot.com/o/spaces%2FrbF1elaBmiAnq9oEPmNP%2Fuploads%2FU5cfqYg0ncJbF7iQNHYO%2Fimage.png?alt=media&amp;token=73a92e0e-0273-4526-87a6-2f2597790d77" alt="" width="563"><figcaption></figcaption></figure></div>
2. Navigate to your device's desktop and extract the contents of the ZIP file.
3. Open the log files in a text editor.

## Log Handling

Log Handling controls which log types are enabled for generation and included when logs are archived via Archive Logs. Toggle on the log types relevant to the issue being investigated before archiving.

<figure><img src="https://3625419753-files.gitbook.io/~/files/v0/b/gitbook-x-prod.appspot.com/o/spaces%2FrbF1elaBmiAnq9oEPmNP%2Fuploads%2FD9jrwMPaipsww9b0jAqz%2Fimage.png?alt=media&amp;token=3460b02e-3ab2-43d5-917f-4819433b6e0f" alt="" width="563"><figcaption></figcaption></figure>

<table><thead><tr><th width="326">Log Type</th><th>Description</th></tr></thead><tbody><tr><td>Debug Engine</td><td>Logs related to engine debugging.</td></tr><tr><td>Debug Engine Activity</td><td>Logs related to engine activity.</td></tr><tr><td>Debug Watcher</td><td>Logs related to watcher monitoring.</td></tr><tr><td>Debug Flag Client Activity</td><td>Logs related to flag client monitoring.</td></tr></tbody></table>

## App Showdown

App Showdown displays the processes and drivers associated with INSIGHT on the endpoint. Use this section to verify the current state of INSIGHT components and restart any that are not functioning correctly.

### Processes

The following processes are listed in App Showdown. Selecting **Kill Process** next to a process stops it immediately and triggers an automatic restart. This is the recommended approach when a component is behaving unexpectedly or has stopped functioning, and is the equivalent of managing INSIGHT processes via the command line without requiring CLI access.

<table><thead><tr><th width="237">Process</th><th>Description</th></tr></thead><tbody><tr><td>GWClient.exe</td><td>The main communication layer between the endpoint and the INSIGHT server.</td></tr><tr><td>GWProxy.exe</td><td>Monitors network-level activity on the endpoint.</td></tr><tr><td>GWWatcher.exe</td><td>Monitors user activity and forwards events for processing.</td></tr><tr><td>GWSyncMonitor</td><td>[Placeholder]</td></tr></tbody></table>

### Drivers

The Drivers section lists the drivers associated with INSIGHT on the endpoint and their current enabled or disabled status. Driver availability and state are controlled from the management console via **Devices** > **Assign Command** > **Driver Options**.

If a driver's status does not reflect the configuration set in the management console, resend the command from **Devices** > **Assign Command** and verify again.

<table><thead><tr><th width="181">Driver</th><th>Description</th></tr></thead><tbody><tr><td>gwpg</td><td>Monitors and manages process-level activity related to device interactions. Enforces policy-controlled execution.</td></tr><tr><td>gwdogfile</td><td>Protects INSIGHT client files and components from unauthorised renaming, modification, or deletion.</td></tr><tr><td>gwscanner</td><td>Monitors USB activity, detects connected USB devices, captures serial numbers, and tracks usage.</td></tr><tr><td>gwusbmon</td><td>Monitors file transfers to and from USB devices and captures transferred files for further processing.</td></tr><tr><td>gwchatdocmon</td><td>Monitors activity in supported chat applications and captures files shared through chat for inspection against configured policies.</td></tr></tbody></table>

Drivers cannot be managed from the INSIGHT Status Monitor. To enable or disable a driver, navigate to **Devices** > **Assign Command** > **Driver Options** in the management console and check or uncheck the box next to the relevant driver name. The updated status is reflected in the INSIGHT Status Monitor once the configuration has been applied to the endpoint.

## System Info

System Info displays the endpoint's details and the current status of INSIGHT engine features as applied from the management console. All values are read-only.

If a value does not reflect the expected configuration, resend the relevant command from the management console and verify again.

<table><thead><tr><th width="171">Field</th><th>Description</th></tr></thead><tbody><tr><td>Browsers.bin</td><td>Contains the list of browsers recognised and monitored by INSIGHT. Entries correspond to browser executable names, for example <code>librewolf.exe</code>.</td></tr><tr><td>File Upload.ext</td><td>Contains the list of file extensions subject to file upload monitoring. Entries define the scope of what is included in upload monitoring, for example <code>INCLUDE</code>.</td></tr></tbody></table>

### Engine Settings

Engine Settings displays the current status of INSIGHT engine features on the endpoint. Each value reflects the status as applied from the management console. To modify an engine setting, update the relevant configuration in the management console.\
\[path to be confirmed.]

<table><thead><tr><th width="233">Setting</th><th>Description</th></tr></thead><tbody><tr><td>Productivity Mode</td><td>Indicates whether Productivity Mode is currently active on the endpoint. Possible values: ON, OFF.</td></tr><tr><td>Bad App Mode</td><td>Indicates whether Bad App Mode is currently active on the endpoint. Possible values: ON, OFF.</td></tr><tr><td>Web Productivity Monitor</td><td>Indicates the current Web Productivity Monitor value applied to the endpoint.</td></tr><tr><td>Browser Mode</td><td>Indicates whether Browser Mode is currently active on the endpoint. Possible values: ON, OFF.</td></tr><tr><td>USB Monitor</td><td>Indicates the current USB monitoring mode applied to the endpoint. Possible values: ON, OFF, PASSIVE.</td></tr><tr><td>Outgoing Zip File Mode</td><td>[tbc]</td></tr><tr><td>Bad App List</td><td>[tbc]</td></tr></tbody></table>

## Advanced Settings

Advanced Settings displays the list-based configurations applied to the endpoint from the management console. These lists control how INSIGHT monitors and responds to activity across categories, including network traffic, file system activity, and application behaviour. All values are read-only.

[**To create an Advanced Setting**](/documentation/insight/policies/advanced-settings#create-an-advanced-setting)**:**

1. In the management console, go to **INSIGHT > Advanced Settings**.
2. Select **New Advanced Setting**.

[**To assign an Advanced Setting to an endpoint**](/documentation/insight/users-and-devices/insight-devices#assign-an-advanced-setting)**:**

1. In the management console, go to **Devices > INSIGHT**.
2. Select the device from the list.
3. Select **Assign Advanced Setting**.

The table below provides an overview of every Advanced Setting and what it does.

<table><thead><tr><th width="269">Section</th><th>What it does</th></tr></thead><tbody><tr><td><a href="/documentation/insight/policies/advanced-settings#environment-settings">Environment Settings</a></td><td>Controls the intervals, durations, timeouts, and bandwidth settings for uploading reports and downloading policies and commands.</td></tr><tr><td><a href="/documentation/insight/policies/advanced-settings#applications-monitored-at-network-level">Applications Monitored at Network Level</a></td><td>Lists applications monitored for sensitive data uploads at the network level.</td></tr><tr><td><a href="/documentation/insight/policies/advanced-settings#ip-addresses-not-monitored-at-network-level">IP Addresses Not Monitored at Network Level</a></td><td>Lists IP addresses that are not monitored for sensitive data.</td></tr><tr><td><a href="/documentation/insight/policies/advanced-settings#websites-monitored-at-network-level">Websites Monitored at Network Level</a></td><td>Lists certificate common names for which SSL traffic is, or is not, monitored.</td></tr><tr><td><a href="/documentation/insight/policies/advanced-settings#websites-monitored-by-chromium-extensions">Websites Monitored by Chromium Extensions</a></td><td>Lists URLs for which traffic is, or is not, monitored by Chromium Extensions.</td></tr><tr><td><a href="/documentation/insight/policies/advanced-settings#applications-monitored-at-file-system-level">Applications Monitored at File System Level</a></td><td>Lists applications monitored for sensitive data uploads at the file system level.</td></tr><tr><td><a href="/documentation/insight/policies/advanced-settings#applications-excluded-from-keystroke-monitoring">Applications Excluded from Keystroke Monitoring</a></td><td>Lists applications where keystrokes are not monitored for sensitive data.</td></tr><tr><td><a href="/documentation/insight/policies/advanced-settings#websites-excluded-from-keystroke-monitoring">Websites Excluded from Keystroke Monitoring</a></td><td>Lists websites where keystrokes are not monitored for sensitive data.</td></tr><tr><td><a href="/documentation/insight/policies/advanced-settings#applications-excluded-from-copypaste-monitoring">Applications Excluded from Copy/Paste Monitoring</a></td><td>Lists applications where copy/paste activity is not monitored for sensitive data.</td></tr><tr><td><a href="/documentation/insight/policies/advanced-settings#websites-excluded-from-copypaste-monitoring">Websites Excluded from Copy/Paste Monitoring</a></td><td>Lists websites where copy/paste activity is not monitored for sensitive data.</td></tr><tr><td><a href="/documentation/insight/policies/advanced-settings#file-extensions-monitored-at-file-system-level">File Extensions Monitored at File System Level</a></td><td>Lists file extensions that are, or are not, monitored at the file system level.</td></tr><tr><td><a href="/documentation/insight/policies/advanced-settings#websites-with-end-to-end-encryption">Websites with End-to-End Encryption</a></td><td>Lists websites with end-to-end encryption.</td></tr></tbody></table>


# INSIGHT Users

You can view the user accounts detected by GuardWare INSIGHT in the End Users section. Administrators can view user details and assign user policies to the users listed here. Each user account has details such as last login time, assigned security group, device used, and currently assigned policy.

Use this page to confirm which accounts are active, review assigned groups, and verify which INSIGHT User Policy applies to each user.

{% hint style="info" %}
Some user details depend on directory data. If a value is not available in Active Directory, the account still appears, but that field may be blank.
{% endhint %}

#### Search and Filter

1. Navigate to **END USERS**.
2. Click the search field at the top of the page to locate a user by name. The list can also be filtered by:
   1. **Security Group** filters users by their assigned security group. For details about Security Groups, visit [here](/documentation/protect/users-and-devices/security-groups).
   2. **Policy** filters users by their currently assigned INSIGHT User Policy.

### User Details

Review directory information, the associated device, group membership, and the currently assigned policy from the **User Details** panel.

1. Navigate to **END USERS**.
2. From the available list of users, click the **View icon** (<i class="fa-eye">:eye:</i>) in the **Action** column.

   <div align="left"><figure><img src="https://3625419753-files.gitbook.io/~/files/v0/b/gitbook-x-prod.appspot.com/o/spaces%2FrbF1elaBmiAnq9oEPmNP%2Fuploads%2F7vu0x8NgxS5ACei1zE1M%2Fimage.png?alt=media&amp;token=0ca8bea8-1ed1-4215-a2d4-c2aab52b4eb4" alt="" width="563"><figcaption></figcaption></figure></div>
3. This opens the **User Details panel**, which is organised into four sections:

* **Basic Info** shows the user's full name, email address, phone number, job title, department, and assigned manager. This information is pulled from the directory and is read-only.
* **Device & Network** shows the PC name associated with the user, the domain the device is joined to, and the user's location.
* **Access & Groups** shows the user group the account belongs to, as well as any security groups assigned to the user.
* **Policy** shows the INSIGHT User Policy currently assigned to the user and the date and time the assignment was last updated.

### Assign Policy to a User

INSIGHT User Policies define the monitoring and security behaviour applied to end-user accounts. Each user can hold one policy assignment at a time.

A **Base Policy** is available by default and acts as a fallback. If a policy is deleted and users were assigned to it, those users are automatically reassigned to the base policy to ensure no account is left unmanaged. The base policy can be assigned to or removed from users, but cannot be edited or deleted.

All other policies can be created, edited, and deleted as needed.

{% hint style="info" %}
For information on creating and configuring INSIGHT User Policies, see [**User Policies**](/documentation/insight/policies/user-policies)**.**
{% endhint %}

Policies can be assigned to one or more users at a time. To assign a policy:

1. Navigate to **END USERS**.
2. Select the users you want to assign a policy to and click **Assign Policies**.<br>

   <div align="left"><figure><img src="https://3625419753-files.gitbook.io/~/files/v0/b/gitbook-x-prod.appspot.com/o/spaces%2FrbF1elaBmiAnq9oEPmNP%2Fuploads%2FXa52aW5tCxokhNFuwhCK%2Fimage.png?alt=media&amp;token=5fd99f27-39d9-4ec0-9f29-408b5d22e8bc" alt="" width="563"><figcaption></figcaption></figure></div>
3. Select the policy to assign.

   <div align="left"><figure><img src="https://3625419753-files.gitbook.io/~/files/v0/b/gitbook-x-prod.appspot.com/o/spaces%2FrbF1elaBmiAnq9oEPmNP%2Fuploads%2FE0LC16tRAtCDryFzyg19%2Fimage.png?alt=media&amp;token=6578042a-0edb-46f0-bb2e-887c7e80d011" alt="" width="505"><figcaption></figcaption></figure></div>
4. Click **Confirm** to apply the policy.

{% hint style="info" %}
A user can only hold one policy at a time. Assigning a new policy replaces the existing one. Multiple users can be assigned the same policy at once.
{% endhint %}


# INSIGHT Devices

You can view the devices that have INSIGHT Agent installed in the **Devices > INSIGHT** section. It provides a centralised view of devices registered with the GuardWare server across licensed products. Administrators can monitor device status, manage assignments, and send commands directly from this section.

{% hint style="info" %}
Devices are displayed according to the products licensed for the organisation. If a product is not licensed, its associated device data will not appear.
{% endhint %}

### View Devices

The device list shows devices that register with the server when the relevant GuardWare agent is installed. Use this view to monitor agent status, verify assigned settings, and identify devices that need attention, such as devices that have not been online recently or are running an outdated agent version.<br>

<figure><img src="https://3625419753-files.gitbook.io/~/files/v0/b/gitbook-x-prod.appspot.com/o/spaces%2FrbF1elaBmiAnq9oEPmNP%2Fuploads%2FUIlvZ6WYaD1Jx0wV27UV%2Fimage.png?alt=media&amp;token=48d3c2f7-ebbf-4b61-b393-8235f43dc3e9" alt=""><figcaption></figcaption></figure>

<table><thead><tr><th width="236">Column</th><th>Description</th></tr></thead><tbody><tr><td><strong>Device Name</strong></td><td>The hostname of the device.</td></tr><tr><td><strong>User Name</strong></td><td>The user currently or last logged in to the device.</td></tr><tr><td><strong>Serial Number</strong></td><td>The device serial number.</td></tr><tr><td><strong>IP</strong></td><td>The device IP address.</td></tr><tr><td><strong>Setting Assigned</strong></td><td>The Advanced Setting currently assigned to the device.</td></tr><tr><td><strong>Location</strong></td><td>The physical or network location of the device.</td></tr><tr><td><strong>OS</strong></td><td>The operating system installed on the device.</td></tr><tr><td><strong>Last Online Time</strong></td><td>The date and time the device last communicated with the server.</td></tr><tr><td><strong>Hardware</strong></td><td>Hardware specification reported by the device.</td></tr><tr><td><strong>Software</strong></td><td>Applications reported as installed on the device.</td></tr><tr><td><strong>Agent Installation</strong></td><td>The installation status of the INSIGHT agent.</td></tr><tr><td><strong>Agent Version</strong></td><td>The version of the INSIGHT agent installed on the device.</td></tr></tbody></table>

{% hint style="info" %}
Report packet size, client status interval, settings interval, and command interval are configured under **INSIGHT** > **Advanced Settings** > **Report Upload and Communication Settings**.
{% endhint %}

#### Export Devices List

You can export the device list in PDF or CSV format.

1. Navigate to **DEVICES**.
2. On the top-right,
   1. Click the **Excel icon** <i class="fa-file-excel">:file-excel:</i> to download the files in an `.csv` format.
   2. Click the **PDF icon** <i class="fa-file-pdf">:file-pdf:</i> to download the files in a `.pdf` format.

<figure><img src="https://3625419753-files.gitbook.io/~/files/v0/b/gitbook-x-prod.appspot.com/o/spaces%2FrbF1elaBmiAnq9oEPmNP%2Fuploads%2FetYmEhLwCZZKkyQe6wVX%2Fimage.png?alt=media&amp;token=950e806b-8a38-40f0-9590-7d10daf69add" alt="" width="563"><figcaption></figcaption></figure>

### Assign an Advanced Setting

An Advanced Setting defines the monitoring policy and configuration applied to a device. Assigning the correct setting ensures each device is monitored in line with organisational requirements, whether that means applying stricter policies to high-risk user groups or adjusting communication intervals to suit specific network conditions.

Each device can hold one Advanced Setting at a time. A single setting can be assigned to multiple devices. When a new setting is assigned to a device, the existing setting is automatically removed and replaced.

1. Navigate to **INSIGHT** > **Devices**.
2. Select one or more devices from the list.
3. Click **Assign Advanced Setting**.<br>

   <div align="left"><figure><img src="https://3625419753-files.gitbook.io/~/files/v0/b/gitbook-x-prod.appspot.com/o/spaces%2FrbF1elaBmiAnq9oEPmNP%2Fuploads%2Fm4fCU6KcPLIB4CrhtSaW%2Fimage.png?alt=media&amp;token=e27b6430-158f-4b51-b9da-7b2820be5bbb" alt="" width="519"><figcaption></figcaption></figure></div>
4. In the side drawer, select an Advanced Setting from the list to assign to the selected devices.<br>

   <div align="left"><figure><img src="https://3625419753-files.gitbook.io/~/files/v0/b/gitbook-x-prod.appspot.com/o/spaces%2FrbF1elaBmiAnq9oEPmNP%2Fuploads%2FjppUhRE7XvG6crfeswcl%2Fimage.png?alt=media&amp;token=0e28f814-124f-4f4a-a6a0-ac536100ea50" alt="" width="491"><figcaption></figcaption></figure></div>
5. Click **Confirm**.

{% hint style="info" %}
If no Advanced Settings have been created yet, create an [**Advanced Setting**](/documentation/insight/policies/advanced-settings#create-an-advanced-setting) first. After creating, assign the setting here, or from the [**Assign Devices**](/documentation/insight/policies/advanced-settings#assign-devices) action in Advanced Settings.
{% endhint %}

### Assign a Command

Commands allow administrators to act on devices immediately, outside of normal scheduled intervals. This is useful when a change needs to take effect without waiting for the next settings sync, when troubleshooting a specific device, or when preparing a device for decommissioning.

Commands trigger one-off actions on selected devices without changing the assigned Advanced Setting. Use them to troubleshoot a device, force an update, collect current device data, or apply a temporary device action.

Assigned commands are picked up by the device agent during its next communication with the server. Only one command can be assigned per operation; however, multiple devices can be selected and assigned.

{% hint style="warning" %}
Review the effect of each command before assigning it broadly. Commands such as **Uninstall Client**, **Driver Options**, and **Network Monitoring Approach** can affect monitoring coverage, user experience, or device connectivity.
{% endhint %}

#### Before you assign a command

* Confirm the device has checked in recently.
* Select only the devices that need the action.
* Check whether the command is diagnostic, temporary, or permanent.
* Consider whether the command may interrupt the user or require follow-up.

<figure><img src="https://3625419753-files.gitbook.io/~/files/v0/b/gitbook-x-prod.appspot.com/o/spaces%2FrbF1elaBmiAnq9oEPmNP%2Fuploads%2FbPHS5AmqL019GyBvPikU%2Fimage.png?alt=media&amp;token=728b5ec7-83e2-4492-abd3-519913a587f3" alt="" width="521"><figcaption></figcaption></figure>

1. Navigate to **INSIGHT** > **Devices**.
2. Select one or more devices, and click **Assign Command**.

<details>

<summary>Enable Test Communication Settings</summary>

Switches the device Communication Settings to a configuration optimised for fast settings downloads and report uploads. This is intended for testing and diagnostic purposes only.

Use this when validating connectivity, testing server communication, or checking whether a device can receive updates promptly.

{% hint style="info" %}
Applying this command to all devices simultaneously will overload the server. Use selectively on individual or small groups of devices.
{% endhint %}

1. Navigate to **INSIGHT** > **Devices**.
2. Select one or more devices from the list and click **Assign Command**.
3. Select **Enable Test Communication Settings**.
4. Click **Confirm** to assign the command.

</details>

<details>

<summary>Disable Test Communication Settings</summary>

Reverts the device Communication Settings to their default values, undoing any changes made by the [Enable Test Communication](#enable-test-communication-settings) Settings command.

Use this after testing is complete so the device returns to its standard communication behaviour.

1. Navigate to **INSIGHT** > **Devices**.
2. Select one or more devices from the list and click **Assign Command**.
3. Select **Disable Test Communication Settings**.
4. Click **Confirm** to assign the command.

</details>

<details>

<summary>Application Scan</summary>

Instructs the agent to report all applications currently installed on the device. Use this command to retrieve an up-to-date software inventory outside of the normal reporting schedule, for example, after a suspected unauthorised installation.

Use this when software inventory needs to be refreshed after an installation, removal, or other application change on the device.

1. Navigate to **INSIGHT** > **Devices**.
2. Select one or more devices from the list and click **Assign Command**.
3. Select **Application Scan**.
4. Click **Confirm** to assign the command.

</details>

<details>

<summary>Hardware Scan</summary>

Instructs the agent to report the device hardware specifications, installed peripherals, and available disk space. Use this command to get a current hardware snapshot when auditing or troubleshooting a device.

Use this when auditing device specifications or confirming changes to storage, peripherals, or other hardware components.

1. Navigate to **INSIGHT** > **Devices**.
2. Select one or more devices from the list and click **Assign Command**.
3. Select **Hardware Scan**.
4. Click **Confirm** to assign the command.

</details>

<details>

<summary>Force Reload Settings</summary>

Assigns a new unique identifier to the device. Send this command when a device has been provisioned from an image that had INSIGHT pre-installed. Without it, cloned devices may share the same identifier and conflict when communicating with the server.

Use this after imaging or cloning a machine if multiple devices appear to be reporting as the same endpoint.

1. Navigate to **INSIGHT** > **Devices**.
2. Select one or more devices from the list and click **Assign Command**.
3. Select **Force Reload Settings**.
4. Click **Confirm** to assign the command.

</details>

<details>

<summary>Network Monitoring Approach</summary>

The Network Monitoring Approach command specifies the method INSIGHT uses to monitor network traffic. The default approach is Windows Filtering Platform (WFP). If a conflict exists with another network monitoring application on the device, an alternative approach can be selected to maintain compatibility.

Change this only when troubleshooting compatibility issues with another networking product or when instructed to do so during support.

1. Navigate to **INSIGHT** > **Devices**.
2. Select one or more devices from the list and click **Assign Command**.
3. Select **Network Monitoring Approach** and select the monitoring approach (only one).
   1. **WFP** - Windows Filtering Platform. The default approach.
   2. **LSP** - Layered Service Provider. Use if WFP conflicts with another application.
   3. **OFF** - Disables network monitoring entirely.
4. Click **Confirm** to assign the command.

</details>

<details>

<summary>Driver Options</summary>

Allows individual INSIGHT drivers to be disabled. Use this command to resolve driver conflicts or compatibility issues without affecting other components.

Disable individual drivers only for troubleshooting or compatibility testing. Disabling drivers may reduce monitoring visibility on the device.

1. Navigate to **INSIGHT** > **Devices**.
2. Select one or more devices from the list and click **Assign Command**.
3. Select **Driver Options** and uncheck the box next to the driver to be disabled.
   1. Process Guardian- **GWPG**
   2. USB Monitoring- **GWScanner**
   3. USB File Transfers- **GWUSBMon**
   4. File Guardian- **GWDogFile**
   5. File System Monitoring- **GWChatDocMon**
4. Click **Confirm** to assign the command.

</details>

<details>

<summary>Refresh SSL Certificate</summary>

Renews the SSL certificate INSIGHT uses to monitor SSL traffic. Certificates are valid for **two years** and renew automatically on restart when close to expiry. This command allows renewal without restarting the agent, avoiding any interruption to the user.

Use this when SSL traffic monitoring needs to continue without restarting the agent or interrupting the user session.

1. Navigate to **INSIGHT** > **Devices**.
2. Select one or more devices from the list and click **Assign Command**.
3. Select **Refresh SSL Certificate**.
4. Click **Confirm** to assign the command.

</details>

<details>

<summary>Enable SSL Cache</summary>

Re-enables SSL encryption key caching if it has previously been disabled. Use this command to restore the default SSL monitoring behaviour after a [Disable SSL Cache](#disable-ssl-cache) command has been applied.

Use this after troubleshooting is complete and normal SSL cache behaviour should be restored.

1. Navigate to **INSIGHT** > **Devices**.
2. Select one or more devices from the list and click **Assign Command**.
3. Select **Enable SSL Cache**.
4. Click **Confirm** to assign the command.

</details>

<details>

<summary>Clear SSL Cache</summary>

The Clear SSL Cache command clears the SSL encryption keys cached by INSIGHT to speed up SSL traffic monitoring. If webpages are becoming corrupted for a user, clearing the cache will resolve the issue in most cases.

Use this as a first troubleshooting step when monitored web sessions become corrupted or pages do not render correctly.

1. Navigate to **INSIGHT** > **Devices**.
2. Select one or more devices from the list and click **Assign Command**.
3. Select **Clear SSL Cache**.
4. Click **Confirm** to assign the command.

</details>

<details>

<summary>Disable SSL Cache</summary>

Disables SSL encryption key caching entirely. If webpage corruption is occurring on a regular basis and clearing the cache has not resolved the issue, disabling the cache will prevent it from contributing to the problem.

Use this only if repeated web corruption continues after clearing the SSL cache.

1. Navigate to **INSIGHT** > **Devices**.
2. Select one or more devices from the list and click **Assign Command**.
3. Select **Disable SSL Cache**.
4. Click **Confirm** to assign the command.

</details>

<details>

<summary>Enable CLOSE_WAIT Management</summary>

Enables management of `CLOSE_WAIT` TCP connection states. `CLOSE_WAIT` occurs when the remote side of a connection initiates a close, but the browser fails to close the socket. This typically manifests as blank pages appearing in the browser. Enabling this command addresses the issue.

Use this when users report blank browser pages or symptoms that point to sockets remaining in a `CLOSE_WAIT` state.

1. Navigate to **INSIGHT** > **Devices**.
2. Select one or more devices from the list and click **Assign Command**.
3. Select **Enable CLOSE\_WAIT Management**.
4. Click **Confirm** to assign the command.

</details>

<details>

<summary>Disable CLOSE_WAIT Management</summary>

Disables the management of `CLOSE_WAIT` TCP connection states.

Use this only if `CLOSE_WAIT` management was enabled for troubleshooting and is no longer required.

1. Navigate to **INSIGHT** > **Devices**.
2. Select one or more devices from the list and click **Assign Command**.
3. Select **Disable CLOSE\_WAIT Management**.
4. Click **Confirm** to assign the command.

</details>

<details open>

<summary>Uninstall Client</summary>

The Uninstall Client command removes the INSIGHT agent from the selected devices.

Use this when permanently removing INSIGHT from a device, during device decommissioning, or before a clean reinstall.

1. Navigate to **INSIGHT** > **Devices**.
2. Select one or more devices from the list and click **Assign Command**.
3. Select **Uninstall Client**.
4. Select either **Immediate** or **Silent**.
   1. Selecting **Immediate** uninstalls the agent straight away. The user's session is interrupted and `explorer.exe` is restarted.
   2. Selecting **Silent** uninstalls the agent in the background. Cleanup completes on the next device restart with no user interruption.
5. Click **Confirm** to assign the command.

</details>

After assigning a command, verify the result from the device record. Check the last online time, reported hardware or software data, assigned settings, agent version, or the expected change in endpoint behaviour.


# Organisation Settings

**Organisation Settings** lets you manage key organisation-wide settings. You can define working days and hours, classify applications, websites, printers, email domains, and USB devices as *organisational* and *non-organisational*, manage trusted email addresses, configure monitored OneDrive folders, identify AI tools, and mark SharePoint libraries as sensitive.&#x20;

These settings improve monitoring accuracy and reduce false positives. Policies can be applied differently to organisational and non-organisational resources, and sensitive data can be restricted from being shared with untrusted websites, applications, printers, or email domains.

## Working Days

The Working Days section shows your organisation’s official working days and hours. These settings help INSIGHT distinguish between working and non-working time, ensuring that productivity and activity tracking are accurate.

To configure your working days and hours:

1. Navigate to ***INSIGHT > Organisation Settings***.
2. Click **Working Days**.
3. Select the days and working hours during which your organisation operates.
4. Click **Save.**

<figure><img src="https://3625419753-files.gitbook.io/~/files/v0/b/gitbook-x-prod.appspot.com/o/spaces%2FrbF1elaBmiAnq9oEPmNP%2Fuploads%2FMIwSQT0XleovzPVDYw25%2FWorking%20Days.png?alt=media&amp;token=79c1702a-9b73-44c4-9245-38fee2ded27f" alt=""><figcaption></figcaption></figure>

## Printers

The Printers section lists all printers accessed by users within your organisation, along with usage details such as the number of users who accessed each printer and the number of files printed through it.

Classify each printer as **organisational** or **non-organisational.** This helps monitor and control which printers are considered trusted and which may pose a risk of data leakage.

To classify printers:

1. Navigate to ***INSIGHT > Organisation Settings***.
2. Click **Printers.**
3. Select the printers, click the dropdown in the top-right of the section, and select **Organisational** or **Non-organisational.**<br>

   <figure><img src="https://3625419753-files.gitbook.io/~/files/v0/b/gitbook-x-prod.appspot.com/o/spaces%2FrbF1elaBmiAnq9oEPmNP%2Fuploads%2FxxFyBmFz9p9AFyzmnVM9%2FPrinters.png?alt=media&amp;token=f1eeaae3-ccea-47f8-be1c-a01beb91bb86" alt=""><figcaption></figcaption></figure>
4. Click **Save.**
5. Click **Yes, update** in the confirmation box.

## Websites

The Websites section lists all websites accessed by users within your organisation, along with usage details such as the number of users who visited each website and the total time spent on it.

Classify the websites as **organisational** or **non-organisational.** This helps distinguish work-related browsing from non-work activity, enabling better productivity analysis and enforcement of web usage policies.

To classify websites:

1. Navigate to ***INSIGHT > Organisation Settings***.
2. Click **Websites.**
3. Select the websites, click the dropdown in the top-right of the section, and select **Organisational** or **Non-organisational.**<br>

   <figure><img src="https://3625419753-files.gitbook.io/~/files/v0/b/gitbook-x-prod.appspot.com/o/spaces%2FrbF1elaBmiAnq9oEPmNP%2Fuploads%2F2CPFmf4F5hg8XG6w39Bn%2Fwebistes.png?alt=media&amp;token=03aba365-6774-4e97-b08b-fbaaa404c7bf" alt=""><figcaption></figcaption></figure>
4. Click **Save.**
5. Click **Yes, update** in the confirmation box.

## Applications

The Applications section lists all applications accessed by users within your organisation, along with usage details such as the number of users who used each application and the total time spent on it. You can classify applications as **organisational** or **non-organisational.** This helps identify which applications contribute to work and which may impact productivity, allowing you to apply appropriate controls and policies.

To classify applications:

1. Navigate to ***INSIGHT > Organisation Settings***.
2. Click **Applications.**
3. Select the applications, click the dropdown in the top-right of the section, and select **Organisational** or **Non-organisational.**<br>

   <figure><img src="https://3625419753-files.gitbook.io/~/files/v0/b/gitbook-x-prod.appspot.com/o/spaces%2FrbF1elaBmiAnq9oEPmNP%2Fuploads%2FHE0a4BDvhEW7pcmNtdgS%2FApplications.png?alt=media&amp;token=8d41308f-3cf7-4f5d-80bd-36589575b789" alt=""><figcaption></figcaption></figure>
4. Click **Save.**
5. Click **Yes, update** in the confirmation box.

## Email Domains

The Email Domains section lists all domains used in email communication by users within your organisation, along with the total number of emails sent through each domain.

Classify the email domains as **organisational, insecure** or **undefined.** This helps monitor external communication and reduce the risk of sensitive data being shared with untrusted domains.

To classify email domains:

1. Navigate to ***INSIGHT > Organisation Settings***.
2. Click **Email Domains.**
3. Select the email domains, click the dropdown in the top-right of the section, and select **Organisational, Insecure** or **Undefined.**<br>

   <figure><img src="https://3625419753-files.gitbook.io/~/files/v0/b/gitbook-x-prod.appspot.com/o/spaces%2FrbF1elaBmiAnq9oEPmNP%2Fuploads%2F7dGNRDIjxK1bqu2wtLV2%2FEmail%20domains.png?alt=media&amp;token=38785f23-650e-4180-91d3-2c7a447276d7" alt=""><figcaption></figcaption></figure>
4. Click **Save.**
5. Click **Yes, update** in the confirmation box.

## Trusted Emails

The Trusted Emails section lists email addresses considered safe and excluded from certain monitoring or policy actions.

Add or remove specific email addresses to a trusted list to minimise false positives.

To add a trusted email:

1. Navigate to ***INSIGHT > Organisation Settings***.
2. Click **Trusted Emails**.
3. In the **Add trusted email** text box, enter the email address and click **Add.**<br>

   <figure><img src="https://3625419753-files.gitbook.io/~/files/v0/b/gitbook-x-prod.appspot.com/o/spaces%2FrbF1elaBmiAnq9oEPmNP%2Fuploads%2FkNZRNanbIorp29KLpLU6%2FTrusted%20emails.png?alt=media&amp;token=dd0e79fe-495b-49cf-8302-d4d707134358" alt="" width="375"><figcaption></figcaption></figure>
4. Click **Yes, add** in the confirmation box.

To remove an email from the trusted email list:

1. Navigate to ***INSIGHT > Organisation Settings***.
2. Click **Trusted Emails**.
3. Find the email address you want to remove and click the Remove icon in the **ACTIONS** column.<br>

   <figure><img src="https://3625419753-files.gitbook.io/~/files/v0/b/gitbook-x-prod.appspot.com/o/spaces%2FrbF1elaBmiAnq9oEPmNP%2Fuploads%2FSHkZpjD4Nljujcqvanfd%2FRemove%20trusted%20email.png?alt=media&amp;token=22a3fe48-f403-47c0-b96b-bc9d3a4e8599" alt="" width="375"><figcaption></figcaption></figure>
4. Click **Yes, delete** in the confirmation box.

## USBs

The USBs section lists all removable storage devices accessed by users within your organisation, along with usage details such as the number of users who accessed each USB device and the number of files transferred.&#x20;

Classify the USBs as **organisational** or **non-organisational.** This helps prevent unauthorised data transfers and protects sensitive information from being copied outside the organisation.

To classify a USB:

1. Navigate to ***INSIGHT > Organisation Settings***.
2. Click **USBs.**
3. Select the USBs, click the dropdown in the top-right of the section, and select **Organisational** or **Non-organisational.**<br>

   <figure><img src="https://3625419753-files.gitbook.io/~/files/v0/b/gitbook-x-prod.appspot.com/o/spaces%2FrbF1elaBmiAnq9oEPmNP%2Fuploads%2F4228rQUnUbAXLG9vJZxu%2FUSB.png?alt=media&amp;token=6dcfccbc-e081-433f-bc09-7e229751da90" alt=""><figcaption></figcaption></figure>
4. Click **Save.**
5. Click **Yes, update** in the confirmation box.

## OneDrive Folder

The OneDrive Folder section displays your organisation’s OneDrive folders that are monitored for file activities.

Add or remove OneDrive folders to control which files and locations are included in monitoring and policy enforcement. This allows you to focus on relevant data while avoiding unnecessary monitoring.

To add a OneDrive folder:

1. Navigate to ***INSIGHT > Organisation Settings***.
2. Click **OneDrive Folder**.
3. In the **Add OneDrive Folder** textbox, enter the folder path that should be monitored and click **Add**. This is typically the root folder or a specific subfolder path within your organisation’s OneDrive.<br>

   <figure><img src="https://3625419753-files.gitbook.io/~/files/v0/b/gitbook-x-prod.appspot.com/o/spaces%2FrbF1elaBmiAnq9oEPmNP%2Fuploads%2FJy9JXhtMSFjmUQilEDoh%2FAdd%20OneDrive%20folder.png?alt=media&amp;token=16a82c7f-75b1-4557-b126-72f1c33a82d0" alt=""><figcaption></figcaption></figure>
4. Click **Yes, add** in the confirmation box.

To remove a OneDrive folder:

1. Navigate to ***INSIGHT > Organisation Settings***.
2. Find the OneDrive Folder you want to remove and click the **Remove** icon in the **ACTIONS** column.<br>

   <figure><img src="https://3625419753-files.gitbook.io/~/files/v0/b/gitbook-x-prod.appspot.com/o/spaces%2FrbF1elaBmiAnq9oEPmNP%2Fuploads%2FAjWtXwaqU3weMj92HhOu%2FRemove%20OneDrive%20folder.png?alt=media&amp;token=324d3e86-b3fb-4f78-b251-23d73c88e634" alt=""><figcaption></figcaption></figure>

## AI Usages

The AI Usages section lists all websites and applications accessed by users within your organisation, along with usage details such as the number of users who used each website or application and the total time spent on each.

Classify websites and applications as **AI** or **Undefined** to ensure accurate tracking and reporting of AI tools across your organisation, since there is no automatic detection to identify AI tools correctly.

To classify AI tools:

1. Navigate to ***INSIGHT > Organisation Settings***.
2. Click **AI Usages.**
3. Click the **AI Websites** tab.
4. Select the websites, click the dropdown in the top-right of the section, and select **AI** or **Undefined**.<br>

   <figure><img src="https://3625419753-files.gitbook.io/~/files/v0/b/gitbook-x-prod.appspot.com/o/spaces%2FrbF1elaBmiAnq9oEPmNP%2Fuploads%2F9V4EwP0itCXTYpu7yH7a%2FAI%20Usage%20-%20AI%20Websites.png?alt=media&amp;token=cb0cf629-bb2e-43df-840c-3a7ff623024b" alt=""><figcaption></figcaption></figure>
5. Click the **AI Applications** tab.
6. Select the applications, click the dropdown in the top-right of the section, and select **AI** or **Undefined**.<br>

   <figure><img src="https://3625419753-files.gitbook.io/~/files/v0/b/gitbook-x-prod.appspot.com/o/spaces%2FrbF1elaBmiAnq9oEPmNP%2Fuploads%2FfMaRH9oIZPeGkgHdFMof%2FAI%20Usage%20-%20AI%20Applications.png?alt=media&amp;token=8455ef18-27dc-41ce-b2e4-3652735f787a" alt=""><figcaption></figcaption></figure>
7. Click **Save.**
8. Click **Yes, update** in the confirmation box.

## SharePoint

The SharePoint section lists all SharePoint libraries accessed by users within your organisation. Mark libraries as sensitive where required. This helps protect shared data by identifying sensitive libraries and ensuring appropriate monitoring and compliance controls are applied.

To classify SharePoint libraries:

1. Navigate to ***INSIGHT > Organisation Settings***.
2. Click **SharePoint.**
3. Select the SharePoint libraries, click the dropdown in the top-right of the section, and select **Sensitive** or **Undefined**.<br>

   <figure><img src="https://3625419753-files.gitbook.io/~/files/v0/b/gitbook-x-prod.appspot.com/o/spaces%2FrbF1elaBmiAnq9oEPmNP%2Fuploads%2FKUv1pkumizTcnu91OnLE%2FSharePoint.png?alt=media&amp;token=d56b087c-7995-4a95-a99c-2e2f966062cd" alt=""><figcaption></figcaption></figure>
4. Click **Save.**
5. Click **Yes, update** in the confirmation box.


# Cloud Monitoring

Cloud Monitoring monitors user activities within your organisation's Microsoft 365 and Google Workspace environments. These data are then analysed within GuardWare INSIGHT to provide dashboards, alerts, and reports on cloud usage and potential security incidents.

It monitors key cloud events such as:

* Files accessed or downloaded from sensitive libraries
* Access and download actions by anonymous, invited, or external users
* Files accessed via shared links
* Creation of anonymous links and external file access activities
* Cloud storage file access, download, and link creation activities
* Outgoing emails

## Set up Integrations

Microsoft 365 and Google Workspace must each be connected to the Management Console before Cloud Monitoring can be set up for that service. Only once a service is connected can its monitoring be enabled or disabled.

### Connect Microsoft 365

{% hint style="info" %}
Requires an Azure Global Administrator account.
{% endhint %}

1. Navigate to **ORGANISATION** > **Integrations** or from within **Cloud Monitoring** by clicking **Configure Integrations**.
2. Click **Connect Microsoft 365**. You'll be redirected to Microsoft's sign-in page.<br>

   <div align="left"><figure><img src="https://3625419753-files.gitbook.io/~/files/v0/b/gitbook-x-prod.appspot.com/o/spaces%2FrbF1elaBmiAnq9oEPmNP%2Fuploads%2Fcgxi8yQfsYfLZGolvPYP%2Fimage.png?alt=media&amp;token=68dfac64-d8e7-4d2f-814b-a35e09b9de9e" alt="" width="563"><figcaption></figcaption></figure></div>
3. Select your Global Administrator account or click **Use another account** if it is not listed.<br>

   <div align="left"><figure><img src="https://3625419753-files.gitbook.io/~/files/v0/b/gitbook-x-prod.appspot.com/o/spaces%2FrbF1elaBmiAnq9oEPmNP%2Fuploads%2FIbZOIqhR4RTYns4K5WsL%2Fimage.png?alt=media&amp;token=90426c29-c0b9-4aa9-a7d3-60a895eefd96" alt="" width="480"><figcaption></figcaption></figure></div>
4. Enter your Global Administrator email address and password. Click **Next** and sign in.
5. If your account is protected by multi-factor authentication (MFA), you'll need to approve the sign-in request. This might involve:
   1. Approving a notification in the Microsoft Authenticator app.
   2. Entering the code from your authenticator app.
   3. Responding to a text message or phone call, depending on your MFA settings.<br>

      <div align="left"><figure><img src="https://3625419753-files.gitbook.io/~/files/v0/b/gitbook-x-prod.appspot.com/o/spaces%2FrbF1elaBmiAnq9oEPmNP%2Fuploads%2F8G6i4hL3UJnsIHeWeuti%2Fimage.png?alt=media&amp;token=dc1e1437-260f-46ec-b722-a63c9939f5cc" alt="" width="480"><figcaption></figcaption></figure></div>
6. After authenticating, you'll see a permissions consent screen listing what DISCOVER is requesting access to. Select **Consent on behalf of your organisation** and click **Accept**.<br>

   <div align="left"><figure><img src="https://3625419753-files.gitbook.io/~/files/v0/b/gitbook-x-prod.appspot.com/o/spaces%2FrbF1elaBmiAnq9oEPmNP%2Fuploads%2FPk79dI4MWjy6kxhRaEGG%2Fimage.png?alt=media&amp;token=79c27547-a221-48ce-a141-8c4e80f9ebf1" alt="" width="563"><figcaption></figcaption></figure></div>
7. You'll be redirected back to the GuardWare Management Console, saying that the configuration was completed successfully.

### Connect Google Workspace

{% hint style="info" %}
Requires a Google Workspace administrator account, a security group with monitored users, and Google Service Account JSON credentials.
{% endhint %}

1. Navigate to **ORGANISATION** > **Google Workspace** or **INSIGHT >** **Cloud Monitoring** and click  **Add Google Workspace**.\
   ![](https://3625419753-files.gitbook.io/~/files/v0/b/gitbook-x-prod.appspot.com/o/spaces%2FrbF1elaBmiAnq9oEPmNP%2Fuploads%2Fps1KbSIOlRbZZZnkBcJK%2Fimage.png?alt=media\&token=2f81a166-489a-44e8-bee1-f425eca0a564)
2. In **Admin Email,** enter the Google Workspace admin email address that is used to create the JSON Key.
3. Enter the **Security Group**.
4. Enable **Gmail Monitoring** and **Google Drive Monitoring.**
5. Upload the [Google Service Account JSON](/documentation/management-console/integrations/google-workspace) credentials you generated while [setting up the Google Cloud Service Account](/documentation/management-console/integrations/google-workspace#set-up-a-google-cloud-service-account).
6. Click **Submit**.

<div align="left"><figure><img src="https://3625419753-files.gitbook.io/~/files/v0/b/gitbook-x-prod.appspot.com/o/spaces%2FrbF1elaBmiAnq9oEPmNP%2Fuploads%2FJj9jT7F4O3xzy9qMuSVN%2Fimage.png?alt=media&amp;token=a27e7c89-81de-4b08-9704-8ca2a524579c" alt="" width="563"><figcaption></figcaption></figure></div>

## Configure Cloud Monitoring

Cloud Monitoring Settings controls monitoring for Microsoft 365 and Google Workspace services. Enable or disable monitoring per service, manage which users' activities are monitored and sync cloud data here.

### Configure Exchange Monitoring

Use this option to enable or disable monitoring of Microsoft Exchange activities.

1. Navigate to **INSIGHT > Cloud Monitoring**.
2. Toggle **Exchange Monitoring** to enable or disable Exchange monitoring.<br>

   <div align="left"><figure><img src="https://3625419753-files.gitbook.io/~/files/v0/b/gitbook-x-prod.appspot.com/o/spaces%2FrbF1elaBmiAnq9oEPmNP%2Fuploads%2F2ustGUleELxQWg26Ubqi%2Fimage.png?alt=media&amp;token=4c56f963-2e7a-40cf-a60b-4920ee07910a" alt=""><figcaption></figcaption></figure></div>
3. Click **Save** to apply the configuration.

#### Add Users to Security Group

The Security Group identifies the Microsoft 365 security group used for Exchange monitoring and is displayed when Exchange Monitoring is enabled.

1. Click **Assign Users**.<br>

   <div align="left"><figure><img src="https://3625419753-files.gitbook.io/~/files/v0/b/gitbook-x-prod.appspot.com/o/spaces%2FrbF1elaBmiAnq9oEPmNP%2Fuploads%2FICDCrIk3kY8icMONJ40p%2Fimage.png?alt=media&amp;token=2c746e0c-d1da-4b43-92ea-15424996f02a" alt=""><figcaption></figcaption></figure></div>
2. Select the users to be included in the monitoring group.<br>

   <div align="left"><figure><img src="https://3625419753-files.gitbook.io/~/files/v0/b/gitbook-x-prod.appspot.com/o/spaces%2FrbF1elaBmiAnq9oEPmNP%2Fuploads%2Fvd4ogmCZQcKwtCAq7gId%2Fimage.png?alt=media&amp;token=465785a4-8039-438f-b25b-aa4b124f92ae" alt="" width="563"><figcaption></figcaption></figure></div>
3. Click **Save** to assign the selected users, or click **Assign All Users** to assign all the listed users.

### Configure SharePoint Monitoring

Use this option to enable or disable monitoring of SharePoint activities.

1. Navigate to **INSIGHT > Cloud Monitoring**.
2. Toggle **SharePoint Monitoring** to enable or disable SharePoint monitoring.<br>

   <div align="left"><figure><img src="https://3625419753-files.gitbook.io/~/files/v0/b/gitbook-x-prod.appspot.com/o/spaces%2FrbF1elaBmiAnq9oEPmNP%2Fuploads%2FlL5PuMJiiLX1kWWu2oTB%2Fimage.png?alt=media&amp;token=66ffb6a7-cdbb-4f18-b6ee-3cee72d8f1d1" alt=""><figcaption></figcaption></figure></div>
3. Click **Save** to apply the configuration.

### Configure Gmail Monitoring

Use this option to enable or disable monitoring of Gmail activities.

1. Navigate to **INSIGHT > Cloud Monitoring**.
2. Toggle **Gmail Monitoring** to enable or disable Gmail monitoring.<br>

   <figure><img src="https://3625419753-files.gitbook.io/~/files/v0/b/gitbook-x-prod.appspot.com/o/spaces%2FrbF1elaBmiAnq9oEPmNP%2Fuploads%2FxIEYDWDvJUgoM1LlhbNO%2Fimage.png?alt=media&amp;token=231e7d3b-1ea5-4bc8-9e67-39d191a369f1" alt=""><figcaption></figcaption></figure>
3. Click **Save** to apply the configuration.

#### Assign Users to Security Group

Use this option to assign the users whose Gmail activities are monitored.

1. Click **Assign Users**.<br>

   <div align="left"><figure><img src="https://3625419753-files.gitbook.io/~/files/v0/b/gitbook-x-prod.appspot.com/o/spaces%2FrbF1elaBmiAnq9oEPmNP%2Fuploads%2F0PpNv5eVhIswnuSBt9P3%2Fimage.png?alt=media&amp;token=ef9bb496-bffc-4bb1-8a53-5e872bc1db19" alt=""><figcaption></figcaption></figure></div>
2. Select the users to be included in the monitoring group.<br>

   <div align="left"><figure><img src="https://3625419753-files.gitbook.io/~/files/v0/b/gitbook-x-prod.appspot.com/o/spaces%2FrbF1elaBmiAnq9oEPmNP%2Fuploads%2Fvd4ogmCZQcKwtCAq7gId%2Fimage.png?alt=media&amp;token=465785a4-8039-438f-b25b-aa4b124f92ae" alt="" width="563"><figcaption></figcaption></figure></div>
3. Click **Save** to assign the selected users, or click **Assign All Users** to assign all the listed users.

### Configure Google Drive Monitoring

Use this option to enable or disable monitoring of Google Drive activities.

1. Navigate to **INSIGHT > Cloud Monitoring**.
2. Toggle **Google Drive Monitoring** to enable or disable Google Drive monitoring.<br>

   <div align="left"><figure><img src="https://3625419753-files.gitbook.io/~/files/v0/b/gitbook-x-prod.appspot.com/o/spaces%2FrbF1elaBmiAnq9oEPmNP%2Fuploads%2FPYpfHa6cX8UWE2cev1LZ%2Fimage.png?alt=media&amp;token=7a7d1689-dfc6-4206-9dc7-8b224a57685d" alt=""><figcaption></figcaption></figure></div>
3. Click **Save** to apply the configuration.

## Sync Cloud Monitoring

Manually refresh configuration and user information rather than waiting for the next scheduled sync.

1. Navigate to **INSIGHT** > **Cloud Monitoring.**
2. Click the **Sync** button to synchronise the latest configuration and user information from Microsoft 365.

   <div align="left"><figure><img src="https://3625419753-files.gitbook.io/~/files/v0/b/gitbook-x-prod.appspot.com/o/spaces%2FrbF1elaBmiAnq9oEPmNP%2Fuploads%2FwT31sdxkGtHXzWbSZLw9%2Fimage.png?alt=media&amp;token=2036403d-5ae0-4c11-a44f-92b736f2b61a" alt=""><figcaption></figcaption></figure></div>

The **Last Synced** field displays the date and time of the most recent successful synchronisation.

## Assign Data Type

Control which sensitive data types Cloud Monitoring monitors.

1. Click **+ Assign Data Type**.
2. Select the data types to monitor.<br>

   <div align="left"><figure><img src="https://3625419753-files.gitbook.io/~/files/v0/b/gitbook-x-prod.appspot.com/o/spaces%2FrbF1elaBmiAnq9oEPmNP%2Fuploads%2FIxi1p6ukbWuOOOxGLqMf%2Fimage.png?alt=media&amp;token=70575e09-e01a-48d6-b653-b923f759ed5d" alt="" width="563"><figcaption></figcaption></figure></div>
3. Filter data types by category, including **PCI**, **PII**, **SPI**, and **PHI**, if required.<br>

   <div align="left"><figure><img src="https://3625419753-files.gitbook.io/~/files/v0/b/gitbook-x-prod.appspot.com/o/spaces%2FrbF1elaBmiAnq9oEPmNP%2Fuploads%2FcWw8RwA4zcPI5O9m45yO%2Fimage.png?alt=media&amp;token=97a467c0-5dd1-40e2-a219-6a71d015f10b" alt="" width="563"><figcaption></figcaption></figure></div>
4. Click **Save** to apply the changes.


# Risk Definitions

**Risk Definitions** allow you to assign risk levels for different user activities across applications, email, file sharing, and data transfers. This setting gives your organisation the flexibility to define which activities are considered high or low risk based on your own security needs. By configuring these risk levels, your organisation can prioritise alerts and incidents based on severity, strengthen data protection by applying stricter controls where needed, and gain better visibility into user behaviour across systems.

The assigned risk levels are reflected in the Incident Risks dashboard, helping you quickly identify and respond to potential threats.

Each activity is assigned the following risk levels:

* **No Risk:** Considered safe and does not require monitoring.
* **Low:** Considered as having minimal impact and monitored with low priority.
* **Medium:** Considered as having a moderate impact and requires attention.
* **High:** Considered as having a critical impact and requires immediate action or a strict policy.
* **Highest**: Considered to have the most severe impact and poses a significant risk to the organisation. Requires immediate intervention, escalation, and the strictest policy enforcement.
* **Undefined**: No risk level is assigned to the activity.

## Configure Risk Levels

1. Navigate to ***INSIGHT > Risk Definition.***
2. Select the risk levels for each activity and click **Save**.<br>

   <figure><img src="https://3625419753-files.gitbook.io/~/files/v0/b/gitbook-x-prod.appspot.com/o/spaces%2FrbF1elaBmiAnq9oEPmNP%2Fuploads%2FZNttTm2NZWdZ5Fa70qUI%2FRisk%20Definitions.png?alt=media&amp;token=c4b5b538-7345-4e4e-8104-ce7c87a564b6" alt=""><figcaption></figcaption></figure>

## Risk Categories

User activities are classified according to category:

1. **SharePoint External**: External users accessing organisational data increases the risk of data leakage. Assigning risk levels helps monitor sensitive and uncontrolled access.&#x20;
2. **SharePoint Internal**: Internal users can unintentionally expose or misuse sensitive data. Assigning risk levels helps monitor and control internal data handling.&#x20;
3. **Email**: Email is a common channel for data exfiltration. Assigning risk levels helps prevent sensitive data from being shared outside the organisation.&#x20;
4. **Data Transfer using Non-Corporate Websites**: Uploading files to unapproved websites can lead to data exposure. Assigning risk levels helps prevent unauthorised data transfers.&#x20;
5. **File Uploads to Non-Corporate File Sharing Applications**: Third-party file-sharing applications may not meet organisational security standards, increasing the risk of data loss. Assigning risk levels helps prevent unauthorised data transfers.&#x20;
6. **Storage Device Risk:** Removable storage devices can be used to transfer sensitive data outside the organisation, increasing the risk of data leakage. Assigning risk levels helps control and monitor data movement through such devices.
7. **Printing Incidents:** Printing sensitive information can lead to data exposure and unauthorised access. Assigning risk levels helps monitor and restrict the printing of critical data.
8. **Keystroke Capture:** Captured keystrokes can include sensitive information such as passwords or confidential data, increasing security risks. Assigning risk levels helps detect and control potential data exposure.
9. **Copy Paste:** Copying and pasting data between applications can result in unintended data sharing or leakage. Assigning risk levels helps monitor and prevent unauthorised data transfer.
10. **Access of Documents on Local Devices:** Accessing documents on local devices can bypass organisational controls and increase the risk of data misuse. Assigning risk levels helps track and manage local data access.
11. **Usage of AI Tools:** Using AI tools can involve sharing sensitive organisational data with external platforms. Assigning risk levels helps control and monitor potential data exposure.
12. **Usage of Non-Corporate Websites:** Accessing non-corporate websites can expose data to untrusted platforms and increase security risks. Assigning risk levels helps restrict and monitor such usage.
13. **Usage of Non-Corporate Applications:** Non-corporate applications may not comply with organisational security standards, increasing the risk of data loss. Assigning risk levels helps control and monitor their usage.


# User Policies

**User Policies** define how user activities are monitored, governed, and controlled within the organisation. User policies help organisations to monitor and prevent risky actions such as accessing restricted applications, transferring sensitive data, or using unauthorised devices. Policies also help protect sensitive data across applications, websites, devices, and other system activities.&#x20;

By creating user policies, an organisation can enforce governance, security controls and monitoring  according to organisational requirements across multiple areas:

* **Monitor user activity:** Track how users interact with applications, websites, networks, and files.
* **Restrict risky behaviour:** Block access to unauthorised applications, websites, or devices.
* **Protect sensitive data:** Detect and control how sensitive information is shared across different channels, such as email, uploads, printing, or keystrokes.
* **Enforce consistent rules:** Apply the same security configuration to multiple users through a single policy.

{% hint style="info" %}
By default, new users are assigned to INSIGHT's base policy. If a different policy is configured as the default policy, all new users are automatically assigned to that policy.
{% endhint %}

## Add a User Policy

1. Navigate to **INSIGHT > User Policies**.
2. Click **New User Policy.**
3. **Policy Info**:
   1. In **Import Settings**, select an existing policy if you want to import the settings from any existing policy.
   2. Enter the **policy name**.
   3. Enter a **description** for the policy. The description must be at least 10 characters long.
   4. Select **Set as default policy (Only one default policy is allowed)** if you want to set this policy as the default. \
      The **Default Policy** is automatically applied to all newly created users or users who are not assigned to any user policy.
   5. Click **Continue**.<br>

      <figure><img src="https://3625419753-files.gitbook.io/~/files/v0/b/gitbook-x-prod.appspot.com/o/spaces%2FrbF1elaBmiAnq9oEPmNP%2Fuploads%2F4kkGrcTeRdCZMgXpq1RU%2FAdd%20new%20policy%20-%20Screen%201.png?alt=media&amp;token=66a00732-5efb-4fd1-94b5-42cb00e2707a" alt=""><figcaption></figcaption></figure>
4. In **Environment Setting**, configure how user activities are monitored and controlled across applications, websites, devices, and network connections. These settings help administrators enforce acceptable usage policies, detect risky behaviour, and prevent unauthorised actions that could expose sensitive data.\ <img src="https://3625419753-files.gitbook.io/~/files/v0/b/gitbook-x-prod.appspot.com/o/spaces%2FrbF1elaBmiAnq9oEPmNP%2Fuploads%2Fr5fs7jHhw3wcXWK0YHiL%2FEnvironment%20settings%20-%20Screen%202.png?alt=media&amp;token=598c75ec-90f5-4dcb-8a60-7d354990498a" alt="" data-size="original">
   1. **Application Usage**: Enable **Application Usage** to monitor the applications used by users.<br>

      You can also configure application restrictions by enabling:

      1. **Block Application:** Enable **Block Application** to block specific applications from being accessed. You can restrict access to specific applications that are not approved for use within the organisation. \
         Blocking applications can help prevent data leakage, reduce security risks from untrusted software, and enforce organisational security policies.

         For example, you can block file sharing tools, unauthorised cloud storage applications, remote access tools, and peer-to-peer applications.<br>

         To view or configure blocked applications:

         1. In Blocked Applications, click **Detail.**<br>

            <figure><img src="https://3625419753-files.gitbook.io/~/files/v0/b/gitbook-x-prod.appspot.com/o/spaces%2FrbF1elaBmiAnq9oEPmNP%2Fuploads%2F43Axlq4jbIbDbnhhevsL%2FBlock%20application%20-%20Detail%20button.png?alt=media&amp;token=33d7d101-3634-4831-a120-5379b88b332a" alt=""><figcaption></figcaption></figure>
         2. Search for the application that you want to block for users, select it, and click **Confirm**.\
            ![](https://3625419753-files.gitbook.io/~/files/v0/b/gitbook-x-prod.appspot.com/o/spaces%2FrbF1elaBmiAnq9oEPmNP%2Fuploads%2FeIQ6B4nL2brU0ZrRyFh6%2FBlocked%20application%20control.png?alt=media\&token=95bba90c-b2b0-47c6-9453-a0a628eb2a5b)
         3. If you do not find the application you are looking for, enter the application's name and click **Add Application.** We recommend entering the name in uppercase and including the file extension, for example, `WHATSAPP.EXE`.
         4. After the application is added, select it and click **Confirm**.
   2. **Website Usage**: Enable **Website Usage** to monitor websites accessed by users.

      You can also configure website restrictions by enabling:

      1. **Block Website:** Enable **Block Website** to block users from accessing specific websites that may pose security risks or violate organisational policies. This can help reduce exposure to malicious websites, prevent access to unauthorised services, and support compliance requirements.\
         For example, you can block file-sharing websites, unauthorised cloud storage platforms, high-risk domains, and non-work-related websites.\
         To view or configure blocked websites:
         1. In Blocked Websites, click **Detail.**<br>

            <figure><img src="https://3625419753-files.gitbook.io/~/files/v0/b/gitbook-x-prod.appspot.com/o/spaces%2FrbF1elaBmiAnq9oEPmNP%2Fuploads%2FQqujq9CVYwBPmZyvjOqH%2FBlock%20website%20-%20Detail%20button.png?alt=media&amp;token=38f752e1-b28a-45ed-a1fc-6503ce0a7d0a" alt=""><figcaption></figcaption></figure>
         2. Search for the website, select it, and click **Confirm**.\
            ![](https://3625419753-files.gitbook.io/~/files/v0/b/gitbook-x-prod.appspot.com/o/spaces%2FrbF1elaBmiAnq9oEPmNP%2Fuploads%2F57us9q8qmtm4ohjALUBH%2FBlocked%20website%20control.png?alt=media\&token=7e41c518-62d4-4a3e-b4cf-332b91e915ed)
         3. If you do not find the website you are looking for, enter the website's URL and click **Add Website.**
         4. After the website is added, select it and click **Confirm**.
   3. **USB/Storage Device Control:** This setting controls how removable storage devices, such as USB drives and external storage media, are monitored on users' devices. It helps prevent sensitive data from being copied or transferred outside the organisation.
      1. **Off:** No monitoring or restrictions are applied.
      2. **Block:** Prevents users from transferring any files to the USB or other storage devices.
      3. **Monitor:** Monitors the files being transferred to USB or other storage devices, including detecting transferred files, identifying sensitive content, monitoring device insertion, and tracking changes made to files on the USB.
   4. **Archive Files:** Enable **Archive Files** to monitor compressed or archived files such as ZIP or RAR files. Archive monitoring helps detect attempts to conceal sensitive data within compressed files before transferring or sharing them.
      1. **Password-Protected Archives:** Enable **Password-Protected Archives** to monitor archive files that are protected with passwords. INSIGHT cannot read the content or access files inside the password-protected archives, but it can monitor the movement of such archives.
      2. **Password-Protected Document:** Enable **Password-Protected Document** to monitor documents that are protected with passwords. INSIGHT cannot read the content inside the password-protected documents, but it can monitor the movement of such documents.
   5. **Network Access & Connectivity**: Enable **Network Access & Connectivity** to monitor user activities related to network connections and data transfers over the network. When enabled, INSIGHT monitors how users access network resources and interact with external or internal networks.

      INSIGHT tracks activities such as:

      * **Connecting to external networks:** For example, when a user connects their device to a new Wi-Fi network, such as a public hotspot or an unsecured network.
      * **Accessing internal network resources:** For example, when users access shared drives, internal servers, or company network services.
      * **Establishing remote connections:** For example, when users connect to remote systems using tools such as VPN, Remote Desktop, or SSH.
      * **Connecting to unknown or suspicious IP addresses:** For example, connections made to unfamiliar external IP addresses or domains.
      * **Network file transfers:** For example, when files are uploaded or downloaded over network connections.
      * **Changes in network connectivity:** For example, switching between networks (e.g., from a corporate network to public Wi-Fi).
      * **Accessing cloud services over the network:** For example, connections to cloud storage or web services used to transfer or access files.
   6. **Image & Document OCR**: Enable **Image & Document OCR** to monitor images and documents using Optical Character Recognition (OCR) to detect sensitive information embedded within them. When enabled, INSIGHT can analyse images and documents to detect sensitive information that may not be visible through standard text-based inspection. \
      By using OCR, INSIGHT extracts text from images and documents to identify whether they contain sensitive data such as personal information, financial details, identification numbers, or other protected information.
   7. **Display Icon in System Tray**: Enable **Display Icon in System Tray** to display the **INSIGHT agent icon** in the user’s system tray. This allows users to see that their activities on the device are being monitored.
   8. **Classify Office Documents**: Enable **Classify Office Documents** to add GuardWare classification labels in the Microsoft Office Standalone version. Users must apply a classification label before saving Office documents. This helps ensure that sensitive or confidential information is properly identified. Depending on the configured policy, labels can define the sensitivity level of documents and apply visual markings such as headers, footers, or watermarks.
   9. **Classify Emails in Outlook**: Enable **Classify Emails in Outlook** to enforce the classification of emails in Microsoft Outlook. Users must apply a classification label before sending emails, helping ensure that sensitive information is properly categorised and handled according to organisational policies.
5. After enabling the necessary settings, click **Continue**.
6. In **Data Type Selection**, select the types of sensitive data that should be monitored or controlled under the policy. Here, you will see a list of predefined data types that INSIGHT can monitor.\
   \
   You can configure monitoring or enforcement actions for different data types across various activities, such as emails, websites, application uploads, keystrokes, and printed files. This allows administrators to enforce different levels of protection depending on the type of activity and the sensitivity of the data.\
   \
   You can review each data type and configure how it should be handled within the policy. Use the search and filter options at the top of the table to quickly locate specific data types.\
   \
   The table lists all available data types along with their configuration details.

   <table data-header-hidden><thead><tr><th width="211.20001220703125">Column</th><th>Description</th></tr></thead><tbody><tr><td><strong>Column</strong></td><td><strong>Description</strong></td></tr><tr><td><strong>ALL DATA TYPES</strong></td><td>Displays the name of the sensitive data type being monitored.</td></tr><tr><td><strong>NATURE</strong></td><td>Indicates the detection method used to identify the data type.</td></tr><tr><td><strong>CONTROL MODE</strong></td><td>Defines how the system handles the detected data.</td></tr><tr><td><strong>ASSIGNED POLICIES</strong></td><td>Shows the policies currently associated with the data type.</td></tr><tr><td><strong>EMAIL BODY</strong></td><td>Monitors sensitive data within the content of emails.</td></tr><tr><td><strong>EMAIL ATTACHMENT</strong></td><td>Monitors attachments sent through email.</td></tr><tr><td><strong>WEBSITE UPLOAD</strong></td><td>Monitors sensitive data uploaded to websites.</td></tr><tr><td><strong>APPLICATION UPLOAD</strong></td><td>Monitors files uploaded through applications.</td></tr><tr><td><strong>PRINTED FILES</strong></td><td>Monitors sensitive data in files being printed.</td></tr><tr><td><strong>KEYSTROKE</strong></td><td>Monitors typed data that may contain sensitive information.</td></tr><tr><td><strong>WEBSITE TEXTS</strong></td><td>Monitors sensitive data entered into website forms.</td></tr><tr><td><strong>STORAGE MEDIA</strong></td><td>Monitors sensitive data transferred to storage media</td></tr><tr><td><strong>DOCUMENT ACCESS</strong></td><td>Monitors sensitive data in document access</td></tr></tbody></table>

   \
   To configure a data type:

   1. Click **Add data types**.<br>

      <figure><img src="https://3625419753-files.gitbook.io/~/files/v0/b/gitbook-x-prod.appspot.com/o/spaces%2FrbF1elaBmiAnq9oEPmNP%2Fuploads%2FCuxQLhPzUJCy2u44lutj%2FAdd%20data%20types.png?alt=media&amp;token=9a231f4f-687b-4bb2-aac3-fb7141d4a701" alt=""><figcaption></figcaption></figure>
   2. Select the data types you want to monitor or control under this policy and click **Add data types**.<br>

      <figure><img src="https://3625419753-files.gitbook.io/~/files/v0/b/gitbook-x-prod.appspot.com/o/spaces%2FrbF1elaBmiAnq9oEPmNP%2Fuploads%2F4zQdacGTEptvITdfjPri%2FSelect%20data%20types%20and%20add.png?alt=media&amp;token=6ea035d6-5162-441c-a54e-52bb509e2ba7" alt=""><figcaption></figcaption></figure>
   3. Click **Edit** in the **ACTION** column. If you want to configure multiple data types at once, select the data types you want to configure and click **Apply Bulk**.<br>

      <figure><img src="https://3625419753-files.gitbook.io/~/files/v0/b/gitbook-x-prod.appspot.com/o/spaces%2FrbF1elaBmiAnq9oEPmNP%2Fuploads%2FhrRaYKKkRmGC0yri4HJl%2FEdit%20data%20type%20-%20new.png?alt=media&amp;token=b9e9ce88-503a-40d3-a5de-a3eac1c26f7f" alt=""><figcaption></figcaption></figure>
   4. Select the activities where these data types should be monitored.\
      ![](https://3625419753-files.gitbook.io/~/files/v0/b/gitbook-x-prod.appspot.com/o/spaces%2FrbF1elaBmiAnq9oEPmNP%2Fuploads%2FqCzlKJCLt2ilOlKGEMtw%2FData%20type%20monitoring%20action.png?alt=media\&token=73261c15-920d-4a84-983a-1a20368ec049)
   5. Select the action mode:
      1. **Off**: No monitoring or enforcement is applied for the selected data type.
      2. **Block**: INSIGHT blocks any activities that are selected when the specified data type is detected.
      3. **Monitor**: INSIGHT monitors the data type in the selected activities and records related activities.
      4. **Warn**: INSIGHT alerts the user when the specified data type is detected in the selected activities.<br>

         <table><thead><tr><th width="126.20001220703125">Activities</th><th width="171">Block</th><th width="183.4000244140625">Monitor</th><th>Warn</th></tr></thead><tbody><tr><td><strong>Email Body</strong></td><td>Blocks the email from being sent if the specified data type is detected in the email body.</td><td>Monitors the email content and records activities when the specified data type is detected in the email body.</td><td>Displays a warning and records activities when the specified data type is detected in the email body, but allows the email to be sent.</td></tr><tr><td><strong>File Upload to Application</strong></td><td>Blocks users from uploading a file to an application if the specified data type is detected in the file.</td><td>Monitors file uploads and records activities when the specified data type is detected.</td><td>Displays a warning and records activities when the specified data type is detected while uploading a file to an application, but allows the upload.</td></tr><tr><td><strong>Printing of Files</strong></td><td>Monitors print activity and records details when the specified data type is detected, but does not block any activities.</td><td>Monitors print activity and records details when the specified data type is detected.</td><td>Displays a warning and records activities when the specified data type is detected in the file being printed, but allows printing.</td></tr><tr><td><strong>File Uploaded to Website</strong></td><td>Blocks file uploads to websites if the specified data type is detected in the file.</td><td>Monitors file uploads to websites and records activities when the specified data type is detected.</td><td>Displays a warning and records activities when the specified data type is detected in the file being uploaded to a website, but allows the upload.</td></tr><tr><td><strong>Keystroke</strong></td><td>Monitors and records keystrokes when the specified data type is entered, but does not block any activities.</td><td>Monitors and records keystrokes when the specified data type is entered.</td><td>Displays a warning and records activities when the specified data type is entered, but allows users to send the content.</td></tr><tr><td><strong>Website Posts (Texts)</strong></td><td>Blocks text from being posted to the website if the specified data type is detected in the text.</td><td>Monitors posted text and records activities when the specified data type is detected.</td><td>Displays a warning and records activities when the specified data type is detected, but allows the post.</td></tr><tr><td><strong>Transfer to Storage Media</strong></td><td>Blocks file transfers to storage media if the specified data type is detected in the file.</td><td>Monitors file transfers to storage media and records activity when the specified data type is detected.</td><td>Displays a warning and records activities when the specified data type is detected in the files being transferred to storage media, but allows the transfer.</td></tr><tr><td><strong>Document Access</strong></td><td>Blocks access to a document if the specified data type is detected in the document.</td><td>Monitors document access and records activity when the specified data type is detected.</td><td>Displays a warning and records activities when the specified data type is detected in a document, but allows access.</td></tr><tr><td><strong>Email Attachments</strong></td><td>Blocks the email from being sent if the specified data type is detected in the email attachment.</td><td>Monitors the email content and records activities when the specified data type is detected in the email attachment.</td><td>Displays a warning and records activities when the specified data type is detected in the email attachment, but allows the email to be sent.</td></tr></tbody></table>
   6. Click **Apply To This Row.** If you want to remove all selections for a data type, click **Clear This Row**.
7. Click **Continue**.
8. Review the configurations and click **Confirm** if everything is correct.\
   ![](https://3625419753-files.gitbook.io/~/files/v0/b/gitbook-x-prod.appspot.com/o/spaces%2FrbF1elaBmiAnq9oEPmNP%2Fuploads%2Fmi3DzXLJgFZrhhEY8QrY%2FReview%20and%20Confirm.png?alt=media\&token=21738f88-5ac2-45cb-bc74-b201241a0995)

You will see the newly created user policy on the **User Policies** list. Once a policy is created, you can assign it to users, and INSIGHT begins monitoring user activity based on the configured settings.

When a defined condition is met (for example, sensitive data is detected on an application or document, INSIGHT takes the configured action, such as recording the activity, displaying a warning, and blocking the action. This ensures that user activity is continuously monitored and controlled according to organisational security requirements.

## Assign Users to a User Policy

To assign users to a user policy:

1. Navigate to **INSIGHT > User Policies**.
2. Find the policy where you want to assign users and click **Assign Users** in the **ACTIONS** column.<br>

   <figure><img src="https://3625419753-files.gitbook.io/~/files/v0/b/gitbook-x-prod.appspot.com/o/spaces%2FrbF1elaBmiAnq9oEPmNP%2Fuploads%2FAPF7fEEUzk27jlbzI1F2%2FAssign%20users%20to%20policy.png?alt=media&amp;token=6d5cb120-a310-45a5-a755-f6eef927bfae" alt=""><figcaption></figcaption></figure>
3. Filter the users by selecting the Security Group. You can also search for a user using the search bar.
4. Select the users you want to assign the policy to and click **Assign**. <br>

   <figure><img src="https://3625419753-files.gitbook.io/~/files/v0/b/gitbook-x-prod.appspot.com/o/spaces%2FrbF1elaBmiAnq9oEPmNP%2Fuploads%2FDDCD2W8kK9lNm0DahZSc%2FAssign%20users%20-%20select%20users.png?alt=media&amp;token=09bb0e90-3c2a-49c4-9848-db4287a7416c" alt=""><figcaption></figcaption></figure>
5. If the selected users are already assigned to another policy, a confirmation message appears. Click **Yes, Assign** to replace their existing policy with the new policy.

## View User Policy Details

To view the policy details:

1. Navigate to **INSIGHT > User Policies**.
2. Find the policy you want to view, and click **View** in the **ACTIONS** column.

   <figure><img src="https://3625419753-files.gitbook.io/~/files/v0/b/gitbook-x-prod.appspot.com/o/spaces%2FrbF1elaBmiAnq9oEPmNP%2Fuploads%2FqBbOYoGWUGlAxTsQr8tX%2FView%20button.png?alt=media&amp;token=110a1981-6394-4c58-8634-04a92d5ce00c" alt=""><figcaption></figcaption></figure>

   \
   The policy overview page opens, where you can review its configuration, including applied rules, selected activities, and enforcement settings.

## Edit User Policy

To edit a user policy:

1. Navigate to **INSIGHT > User Policies**.
2. Find the policy you want to edit, and click **Edit** in the **ACTIONS** column.<br>

   <figure><img src="https://3625419753-files.gitbook.io/~/files/v0/b/gitbook-x-prod.appspot.com/o/spaces%2FrbF1elaBmiAnq9oEPmNP%2Fuploads%2FqdmSy71Kn2TddZFxW2Zk%2FEdit%20button.png?alt=media&amp;token=99eef6a9-5c77-4c50-ae70-ca799ccef410" alt=""><figcaption></figcaption></figure>
3. Edit the details and click **Confirm**.

## Delete User Policy

To delete a user policy:

1. Navigate to **INSIGHT > User Policies**.
2. Find the policy you want to delete and in the **ACTIONS** column, click the **Delete** icon.<br>

   <figure><img src="https://3625419753-files.gitbook.io/~/files/v0/b/gitbook-x-prod.appspot.com/o/spaces%2FrbF1elaBmiAnq9oEPmNP%2Fuploads%2FUIcAiBE8nbtEUz7Uq76o%2FDelete%20icon.png?alt=media&amp;token=c625a36a-09d3-455e-bb02-d3aca42f5b0c" alt=""><figcaption></figcaption></figure>
3. Click **Yes, delete** in the confirmation alert.

## Update Data Types Assigned to Policy

You can add, edit, and delete the data types assigned to user policies.&#x20;

1. Navigate to **INSIGHT > User Policies**.
2. Find the policy whose data type you want to update and click **Data Types** in the **ACTIONS** column.<br>

   <figure><img src="https://3625419753-files.gitbook.io/~/files/v0/b/gitbook-x-prod.appspot.com/o/spaces%2FrbF1elaBmiAnq9oEPmNP%2Fuploads%2FiDi3iKlMsnkTF0p7bY95%2FData%20types%20button.png?alt=media&amp;token=0a2f486d-c7d8-4ae6-8bf0-007ea4c73296" alt=""><figcaption></figcaption></figure>
3. Find the data type you want to update and click **Edit** in the **ACTION** column.
4. Update the details and click **Apply To This Row**.
5. You can also add or delete any data type.
6. Click **Submit** after applying your changes.&#x20;


# Advanced Settings

Advanced Settings define the global monitoring parameters applied across audit reports and device policies in GuardWare INSIGHT. They function as the central control point for how monitoring is configured and enforced across the organisation.

These settings determine how INSIGHT operates on end-user devices, including the methods used to monitor the movement of sensitive data, the applications, URLs, and file extensions that are included or excluded from monitoring, and the configuration of communication between devices and the server.

## Reference Table

The table below provides an overview of every Advanced Setting and what it does.

<table><thead><tr><th width="292.8887939453125">Section</th><th>What it does</th></tr></thead><tbody><tr><td><a href="#environment-settings">Environment Settings</a></td><td>Controls the intervals, durations, timeouts, and bandwidth settings for uploading reports and downloading policies and commands.</td></tr><tr><td><a href="#applications-monitored-at-network-level">Applications Monitored at Network Level</a></td><td>Lists applications monitored for sensitive data uploads at the network level.</td></tr><tr><td><a href="#ip-addresses-not-monitored-at-network-level">IP Addresses Not Monitored at Network Level</a></td><td>Lists IP addresses that are not monitored for sensitive data.</td></tr><tr><td><a href="#websites-monitored-at-network-level">Websites Monitored at Network Level</a></td><td>Lists certificate common names for which SSL traffic is, or is not, monitored.</td></tr><tr><td><a href="#websites-monitored-by-chromium-extensions">Websites Monitored by Chromium Extensions</a></td><td>Lists URLs for which traffic is, or is not, monitored by Chromium Extensions.</td></tr><tr><td><a href="#applications-monitored-at-file-system-level">Applications Monitored at File System Level</a></td><td>Lists applications monitored for sensitive data uploads at the file system level.</td></tr><tr><td><a href="#applications-excluded-from-keystroke-monitoring">Applications Excluded from Keystroke Monitoring</a></td><td>Lists applications where keystrokes are not monitored for sensitive data.</td></tr><tr><td><a href="#websites-excluded-from-keystroke-monitoring">Websites Excluded from Keystroke Monitoring</a></td><td>Lists websites where keystrokes are not monitored for sensitive data.</td></tr><tr><td><a href="#applications-excluded-from-copypaste-monitoring">Applications Excluded from Copy/Paste Monitoring</a></td><td>Lists applications where copy/paste activity is not monitored for sensitive data.</td></tr><tr><td><a href="#websites-excluded-from-copypaste-monitoring">Websites Excluded from Copy/Paste Monitoring</a></td><td>Lists websites where copy/paste activity is not monitored for sensitive data.</td></tr><tr><td><a href="#file-extensions-monitored-at-file-system-level">File Extensions Monitored at File System Level</a></td><td>Lists file extensions that are, or are not, monitored at the file system level.</td></tr><tr><td><a href="#websites-with-end-to-end-encryption">Websites with End-to-End Encryption</a></td><td>Lists websites with end-to-end encryption.</td></tr></tbody></table>

## Create an Advanced Setting

Before configuring any monitoring parameters, an Advanced Setting policy must be created first. Once created, it starts in an Inactive state and must be configured before it can be activated and applied to devices.

<figure><img src="https://3625419753-files.gitbook.io/~/files/v0/b/gitbook-x-prod.appspot.com/o/spaces%2FrbF1elaBmiAnq9oEPmNP%2Fuploads%2FbOr45zhF5NqoyJY1oC5C%2Fimage.png?alt=media&amp;token=0fb97e0a-89f1-4366-98b8-75df19cae298" alt=""><figcaption></figcaption></figure>

1. Navigate to **INSIGHT** > **Advanced Settings**.
2. Click **+ New Advanced Setting**.

{% stepper %}
{% step %}

### Configure Policy Info

3. In the **Policy Info** tab, fill in the following fields and click **Next**:<br>

   <figure><img src="https://3625419753-files.gitbook.io/~/files/v0/b/gitbook-x-prod.appspot.com/o/spaces%2FrbF1elaBmiAnq9oEPmNP%2Fuploads%2F0UJx4tk8PYen6s6uq7p8%2Fimage.png?alt=media&amp;token=a6b6cb84-5d67-4a61-918c-4e8e5859b70e" alt="" width="563"><figcaption></figcaption></figure>

   1. **Copy Settings From (Optional):** Select an existing Advanced Setting to copy its configuration into this new one. Useful for duplicating a baseline policy instead of starting from scratch.
   2. **Setting Name:** Enter a clear, identifiable name for the setting.
   3. **Description:** Briefly describe what this setting is for, who it applies to, or how it differs from other settings.
   4. **Set as Default Setting (Optional):** Marks this as the organisation-wide default. Only one default setting can be active at a time; it is automatically assigned to all newly created users and can be duplicated to create policy variations from a common baseline.
      {% endstep %}

{% step %}

### Configure Settings

Once created, the **Advanced Setting** starts in an **Inactive** state. Configure the required settings, then activate when ready to apply to devices. Each setting can be enabled or disabled. Disabling a setting reverts it to its default state, disabling the associated functionality.

<figure><img src="https://3625419753-files.gitbook.io/~/files/v0/b/gitbook-x-prod.appspot.com/o/spaces%2FrbF1elaBmiAnq9oEPmNP%2Fuploads%2Fdn5WNR8kmkRc2U51SmpT%2Fimage.png?alt=media&amp;token=a28b3dc1-984a-48fe-b285-bdc79a5a1bf6" alt=""><figcaption></figcaption></figure>

<details open>

<summary><strong>Environment Settings</strong></summary>

Controls the intervals, durations, timeouts, and bandwidth settings for uploading reports and downloading policies and commands.

<table><thead><tr><th width="116">Setting</th><th width="100">Default</th><th width="190">Description</th><th>When to Change</th></tr></thead><tbody><tr><td><strong>Client Responsiveness</strong></td><td>Normal Operation</td><td>Determines how frequently agents download commands and settings and upload reports. Very Responsive, Responsive, and Normal Operation correspond to intervals of 1 minute, 5 minutes, and 15 minutes respectively.</td><td>Increase responsiveness if near-real-time policy enforcement is required. Be aware that shorter intervals increase network and system overhead.</td></tr><tr><td><strong>Enable Chromium Extensions</strong></td><td>Disabled</td><td>An alternative approach to monitoring browsers at the network level.</td><td>Enable if network-level browser monitoring is insufficient or unavailable in the environment.</td></tr><tr><td><strong>Incognito / Private Browsing</strong></td><td>Incognito / In Private mode browsing allowed</td><td>Controls whether users can open private browsing windows. Enable <strong>Enable Chromium Extensions</strong> to access this setting. Chromium Extensions cannot be forced to load in private windows, except in Microsoft Edge.</td><td>Block private browsing to prevent unmonitored activity. Allow it without monitoring only where appropriate. Select the Microsoft Edge option to allow and monitor Edge private windows while blocking private browsing in other browsers. Use network monitoring when users need private browsing in browsers other than Edge.</td></tr><tr><td><strong>File System Level Monitoring</strong></td><td>Enabled</td><td>Uses a file system level driver to monitor uploads through changes in the network information associated with files.</td><td>Disable if file system-level monitoring is not required or conflicts with existing endpoint software.</td></tr><tr><td><strong>Passive Monitoring of File Uploads to Cloud Drives</strong></td><td>Disabled</td><td>An alternative approach to monitoring file uploads to cloud drives at the file system level.</td><td>Enable if file system-level monitoring does not adequately capture cloud drive upload activity.</td></tr><tr><td><strong>Network Level Monitoring</strong></td><td>WFP</td><td>WFP and LSP are Windows networking technologies used to inspect network traffic.</td><td>Switch to LSP if WFP is incompatible with the environment or conflicts with other network drivers.</td></tr><tr><td><strong>USB Monitoring</strong></td><td>Enabled</td><td>Monitors insertions of, and file transfers to, USB devices.</td><td>Disable only if USB monitoring is managed by a separate solution or is not required in the environment.</td></tr><tr><td><strong>GuardWare File Protection</strong></td><td>Enabled</td><td>Prevents end users from editing or deleting files within the GuardWare Program Files and Program Data folders.</td><td>Disable temporarily for maintenance or troubleshooting only.</td></tr><tr><td><strong>GuardWare Process Protection</strong></td><td>Enabled</td><td>Prevents end users from terminating the main GuardWare processes.</td><td>Disable temporarily for maintenance or troubleshooting only.</td></tr></tbody></table>

</details>

<details>

<summary><strong>Applications Monitored at Network Level</strong></summary>

List of applications that are monitored for sensitive data uploads at the network level. The proxy can only monitor applications that are explicitly on this list. If an application is not selected, its traffic will not be captured.

<figure><img src="https://3625419753-files.gitbook.io/~/files/v0/b/gitbook-x-prod.appspot.com/o/spaces%2FrbF1elaBmiAnq9oEPmNP%2Fuploads%2FsE1JDlGQmwlIUbzlWl1a%2Fimage.png?alt=media&amp;token=457de912-f527-41d2-9711-9f3d88326ba1" alt=""><figcaption></figcaption></figure>

1. Click **+ Add Setting** to open the configuration window.
2. A default set of applications is preselected for monitoring. To add more, use the search field to find the application and select the checkbox next to it.
3. If the application does not appear in the list, enter the executable name (e.g., `chrome.exe`) in the **Add Application** field and click **Add Application**.
4. Once added, select the checkbox next to it to include it in monitoring.

</details>

<details>

<summary><strong>IP Addresses Not Monitored at Network Level</strong></summary>

List of IP addresses that are not monitored for sensitive data. The list shows excluded IP addresses used by internal applications that are considered secure and do not need monitoring for the uploading of sensitive data.

<figure><img src="https://3625419753-files.gitbook.io/~/files/v0/b/gitbook-x-prod.appspot.com/o/spaces%2FrbF1elaBmiAnq9oEPmNP%2Fuploads%2FMpvvxzCwG09Mlu9N4xoh%2Fimage.png?alt=media&amp;token=929e3ed9-48fe-4e50-8c52-303cb63246cb" alt=""><figcaption></figcaption></figure>

1. Click **+ Add Setting** to open the configuration window.
2. Enter the IP address in the **Add IP** field and click **Add IP.**
3. Confirm the IP address appears in the list and close the window

</details>

<details>

<summary><strong>Websites Monitored at Network Level</strong></summary>

List of SSL certificate common names included in or excluded from network-level monitoring.

<figure><img src="https://3625419753-files.gitbook.io/~/files/v0/b/gitbook-x-prod.appspot.com/o/spaces%2FrbF1elaBmiAnq9oEPmNP%2Fuploads%2FvPueMKEVJGSEfwDzMljp%2Fimage.png?alt=media&amp;token=e796c75a-e24e-47a8-b787-e9df147a1947" alt="" width="522"><figcaption></figcaption></figure>

1. Click **+ Add Setting** to open the configuration window.
2. Select **Include** to monitor only listed websites. Select **Exclude** to monitor every website except those listed.
3. Search for and select a website, or enter its certificate common name and click **Add Website**.
4. Confirm the website appears in the list.

</details>

<details>

<summary><strong>Websites Monitored by Chromium Extensions</strong></summary>

List of URLs included in or excluded from monitoring by Chromium Extensions.

1. Click **+ Add Setting** to open the configuration window.
2. Select **Include** to monitor only listed URLs. Select **Exclude** to monitor every URL except those listed.
3. Search for and select a website, or enter its URL and click **Add Website**.
4. Confirm the website appears in the list.

</details>

<details>

<summary><strong>Applications Excluded from Keystroke Monitoring</strong></summary>

List of applications where keystrokes are not monitored for sensitive data.

1. Click **+ Add Setting** to open the configuration window.
2. Search for an application and select its checkbox to include it.
3. To remove an application, click **X** beside it in the **Selected Applications** list.

</details>

<details>

<summary><strong>Websites Excluded from Keystroke Monitoring</strong></summary>

List of websites where keystrokes are not monitored for sensitive data.

1. Click **+ Add Setting** to open the configuration window.
2. Search for and select a website. Alternatively, enter its URL and click **Add Website**.
3. To remove a website, click **X** beside it in the **Selected Websites** list.

</details>

<details>

<summary><strong>Applications Excluded from Copy/Paste Monitoring</strong></summary>

List of applications where copy/paste activity is not monitored for sensitive data.

1. Click **+ Add Setting** to open the configuration window.
2. Search for an application and select its checkbox to include it.
3. To remove an application, click **X** beside it in the **Selected Applications** list.

</details>

<details>

<summary><strong>Websites Excluded from Copy/Paste Monitoring</strong></summary>

List of websites where copy/paste activity is not monitored for sensitive data.

1. Click **+ Add Setting** to open the configuration window.
2. Search for and select a website. Alternatively, enter its URL and click **Add Website**.
3. To remove a website, click **X** beside it in **Selected Websites**.

</details>

<details>

<summary><strong>File Extensions Monitored at File System Level</strong></summary>

List of file extensions included in or excluded from file system-level sensitive data upload monitoring.

<figure><img src="https://3625419753-files.gitbook.io/~/files/v0/b/gitbook-x-prod.appspot.com/o/spaces%2FrbF1elaBmiAnq9oEPmNP%2Fuploads%2FUTSkgumObX2v7FQOApkz%2Fimage.png?alt=media&amp;token=55edbe03-d957-483a-85f8-09a158c2f557" alt="" width="523"><figcaption></figcaption></figure>

1. Click **+ Add Setting** to open the configuration window.
2. Select **Include** to monitor only listed extensions. Select **Exclude** to monitor every extension except those listed.
3. Enter the file extension in the **Add Extension** field (e.g., `pdf`, `xlsx`, `zip`) and click **Add**.
4. Confirm the extension appears in the list.

</details>

<details>

<summary><strong>Applications Monitored at File System Level</strong></summary>

List of applications that are monitored for sensitive data uploads at the file system level.

<figure><img src="https://3625419753-files.gitbook.io/~/files/v0/b/gitbook-x-prod.appspot.com/o/spaces%2FrbF1elaBmiAnq9oEPmNP%2Fuploads%2FylpllLAKRQ0VNbeeElth%2Fimage.png?alt=media&amp;token=b7967c86-84df-406b-9c33-4c7357acd092" alt=""><figcaption></figcaption></figure>

1. Click **+ Add Setting** to open the configuration window.
2. A default set of applications is preselected for monitoring. To add more, select the checkbox next to the application in the list.
3. If the application does not appear in the list, enter the executable name (e.g., `chrome.exe`) in the **Add Application** field and click **Add Application**.
4. Once added, select the checkbox next to it to include it in monitoring.

</details>

<details>

<summary><strong>Websites with End-to-End Encryption</strong></summary>

List of websites with end-to-end encryption monitoring. For websites implementing end-to-end encryption, it is not possible to intercept file uploads using network monitoring alone.

Where end-to-end encrypted websites are permitted, and there is a concern that files containing sensitive data may be uploaded, both file system monitoring (file paths and contents) and network monitoring (destinations) are required in order to produce reports containing URL and file path information for the uploaded sensitive data.

<figure><img src="https://3625419753-files.gitbook.io/~/files/v0/b/gitbook-x-prod.appspot.com/o/spaces%2FrbF1elaBmiAnq9oEPmNP%2Fuploads%2F0UlUAXEY17tJk1Sgq6LQ%2Fimage.png?alt=media&amp;token=70bfa573-25d6-4c56-8651-65da822d8189" alt=""><figcaption></figcaption></figure>

1. Click **+ Add Setting** to open the configuration window.
2. A default set of websites is preselected. To add more, enter the website in the input field using the format `URL#Title_Substring` (e.g., `whatsapp.com#whatsapp`) and click **Add**.
3. To remove a website, click **X** next to the entry.
4. Close the window.

</details>
{% endstep %}

{% step %}

### Review & Save

1. Scroll to the top of the page and click **Review & Save**. A summary of all configured settings will appear in the side panel.

   <figure><img src="https://3625419753-files.gitbook.io/~/files/v0/b/gitbook-x-prod.appspot.com/o/spaces%2FrbF1elaBmiAnq9oEPmNP%2Fuploads%2FtTvmfDCOMEvRnOx4WzYH%2Fimage.png?alt=media&amp;token=73bc5db3-65f2-4ae7-bf90-6c6261e13941" alt="" width="563"><figcaption></figcaption></figure>
2. Review the configurations. To make any changes, close the panel, update the relevant settings, and click **Review & Save** again.

   <figure><img src="https://3625419753-files.gitbook.io/~/files/v0/b/gitbook-x-prod.appspot.com/o/spaces%2FrbF1elaBmiAnq9oEPmNP%2Fuploads%2FGqtM6SHIzIpc8s861f0G%2Fimage.png?alt=media&amp;token=0027ec81-e68e-4f52-bdf6-7605c636bf32" alt="" width="563"><figcaption></figcaption></figure>
3. Once satisfied, click **Save** to apply the configuration.
   {% endstep %}
   {% endstepper %}

## Assign Advanced Settings to Devices

After creating an Advanced Setting, it can be assigned to devices from the Advanced Settings list. Devices assigned to a deleted setting automatically revert to the default setting (if it exists), which cannot itself be deleted.

1. Navigate to **INSIGHT** > **Advanced Settings.**
2. Click **Assign Devices** next to the setting you want to assign to a device.

   <figure><img src="https://3625419753-files.gitbook.io/~/files/v0/b/gitbook-x-prod.appspot.com/o/spaces%2FrbF1elaBmiAnq9oEPmNP%2Fuploads%2FTf4zavu7KDcsNHW7lpHZ%2Fimage.png?alt=media&amp;token=544fc66a-f88d-47ce-b9d0-dad2cca2be44" alt="" width="563"><figcaption></figcaption></figure>
3. Select devices to assign the setting to, or deselect them to remove the setting.
4. Click **Add** to apply changes.

{% hint style="info" %}

* A device can have only one advanced setting assigned at a time.
* Multiple devices can be assigned to an advanced setting.
* When a new advanced setting is assigned to a device, the existing advanced setting is automatically removed and replaced.
  {% endhint %}

## Edit an Advanced Setting

1. Navigate to **INSIGHT** > **Advanced Settings.**
2. Click <i class="fa-pen-to-square">:pen-to-square:</i> **Edit** next to the relevant setting.<br>

   <figure><img src="https://3625419753-files.gitbook.io/~/files/v0/b/gitbook-x-prod.appspot.com/o/spaces%2FrbF1elaBmiAnq9oEPmNP%2Fuploads%2FWlDcglZG63kr4RRAAQz7%2Fimage.png?alt=media&amp;token=674fc51a-1ee8-42ee-b061-0ce53d72bd65" alt="" width="563"><figcaption></figcaption></figure>
3. The process follows the same steps as [**creating a new Advanced Setting**](#create-an-advanced-setting). Update the required fields and settings.
4. Click **Review & Save** to review the changes.
5. Click **Update** to confirm changes.

## Delete an Advanced Setting

1. Navigate to **INSIGHT** > **Advanced Settings**.
2. Click **Delete** <i class="fa-trash-can">:trash-can:</i> next to the relevant setting.<br>

   <figure><img src="https://3625419753-files.gitbook.io/~/files/v0/b/gitbook-x-prod.appspot.com/o/spaces%2FrbF1elaBmiAnq9oEPmNP%2Fuploads%2FFpExqeSikOQSkB7mTSLE%2Fimage.png?alt=media&amp;token=d6fb4685-0a47-44bb-9174-fc21f66245fb" alt="" width="563"><figcaption></figcaption></figure>
3. Click **Yes, Delete it!** to confirm.


# Cyber Awareness Report

The **Cyber Awareness Report** provides contextual reports via email directly to end users when a risk associated with their activity is triggered. These personalised reports explain what occurred, why it occurred, and the appropriate next steps.&#x20;

By delivering guidance at the time of the event, Cyber Awareness Reports help reinforce security awareness when it is most relevant. Behaviour change happens at the moment of the event, not six months later in an annual training session nobody remembers. This approach encourages users to become more self-aware, improve their security behaviours, and make better decisions without relying solely on follow-up from IT or security teams.

With the Cyber Awareness Report, organisations can:

* Promote better awareness of data-handling practices
* Encourage responsible use of tools, including AI platforms
* Reduce repetitive IT involvement in minor policy events
* Support internal compliance and HR processes
* Roll out consistent policy messaging across the business

Cyber Awareness Reports are fully configurable, so organisations can customise the messaging, tone, and guidance to suit their policies and communication style.

#### Real-World Example

A Cyber Awareness Report says:

> Repeated access to websites classified as unsafe or non-organisational was detected over multiple days. These platforms, including DeepSeek, Yahoo Mail, WhatsApp Web, WeTransfer, and Telegram, are not approved for organisational use and may expose systems to risks such as data leakage or malware.
>
> Frequent and prolonged browsing sessions, ranging from a few minutes to over an hour, indicate a pattern of non-compliant browsing behaviour.
>
> This occurred due to the use of non-organisational websites and limited awareness of the associated security risks.
>
> **Actions required:**
>
> * Avoid accessing non-approved or unsafe websites on work devices
> * Follow organisational policies on approved tools and platforms
> * Limit browsing strictly to work-related activities
> * Do not share or enter sensitive information on external platforms
> * Report any accidental access to unsafe sites

**Self-Awareness**

After reading the report, a user thinks:

* “I didn’t realise these websites are considered unsafe in my organisation.”
* “I’ve been using these platforms frequently during work hours.”
* “If I enter sensitive information on these sites, it could be exposed.”

This helps the user recognise how routine browsing behaviour may introduce security and compliance risks.

**Self-Improvement**

The user takes concrete steps:

* Stops accessing non-organisational websites on work devices
* Uses only approved tools for work-related tasks
* Avoids entering organisational data into external platforms
* Becomes more mindful of browsing time and purpose
* Reviews organisational policies on safe internet use

**Outcome**

* Reduced exposure to unsafe or unapproved platforms
* Lower risk of data leakage and malware threats
* Improved compliance with organisational security policies
* The user develops more disciplined and security-aware browsing habits

## Configure Cyber Awareness Report

1. Navigate to ***INSIGHT > Cyber Awareness***.
2. Click **Configure Cyber Awareness Report**.<br>

   <figure><img src="https://3625419753-files.gitbook.io/~/files/v0/b/gitbook-x-prod.appspot.com/o/spaces%2FrbF1elaBmiAnq9oEPmNP%2Fuploads%2FRNKVJFdde2iRr7cDb31d%2FConfigure%20Cyber%20Awareness%20Report%20button.png?alt=media&amp;token=94dc2d54-2a71-4eda-80cb-ab2d2fea9a59" alt=""><figcaption></figcaption></figure>
3. In **General**:
   1. Enter the email subject.
   2. In **CC**, add valid email addresses for additional recipients, if needed. Separate multiple email addresses with commas.
   3. In **Email Start Date**, select the date and time when the report will be sent.
   4. In **Status**, select **Enabled** to enable the report schedule and start sending reports automatically.
   5. In **Send to**:
      1. **Send to admin**: Select **Send to admin** to send the Cyber Awareness Report of selected users to administrators.
      2. **Send to users**: Select **Send to users** to send the Cyber Awareness Report to individual users selected in the next step.
   6. In **Duration**, choose how often the report is sent:
      * **Daily:** The report is sent every day after the selected start date.

        *Example:* If the Email Start Date is 10 April at 9:00 AM, the report will be sent daily at 9:00 AM starting on 10 April.
      * **Weekly:** The report is sent once every week on the same day and time as the start date.

        *Example:* If the Email Start Date is Friday, 10 April, at 9:00 AM, the report will be sent every Friday at 9:00 AM.
      * **Monthly:** The report is sent once every month on the same date and time as the start date.

        *Example:* If the Email Start Date is set to 10 April at 9:00 AM, the report will be sent on the 10th of every month at 9:00 AM.<br>

        <figure><img src="https://3625419753-files.gitbook.io/~/files/v0/b/gitbook-x-prod.appspot.com/o/spaces%2FrbF1elaBmiAnq9oEPmNP%2Fuploads%2Ftc2ULC8V9Fum8PFfaX88%2FCreate%20SASI%20-%20General.png?alt=media&amp;token=ba9aedcc-e7ee-4313-a3eb-23de41fb0312" alt=""><figcaption></figcaption></figure>
   7. Click **Continue**.
4. In **Select Users**, select the users whose Cyber Awareness Reports you want to send. Selected users receive only their own report, while administrators receive the reports of all selected users.

   <figure><img src="https://3625419753-files.gitbook.io/~/files/v0/b/gitbook-x-prod.appspot.com/o/spaces%2FrbF1elaBmiAnq9oEPmNP%2Fuploads%2FQlWsMEDx5ShxFOtpVFZd%2FCreate%20SASI%20-%20Select%20usrs.png?alt=media&amp;token=6d4b7379-8d12-4ff2-9a89-2b52247800a1" alt=""><figcaption></figcaption></figure>
5. In **Select Risks**, select and configure the risks to include in the report. To configure a risk:
   1. Select a risk template from the list and click **Configure**.<br>

      <figure><img src="https://3625419753-files.gitbook.io/~/files/v0/b/gitbook-x-prod.appspot.com/o/spaces%2FrbF1elaBmiAnq9oEPmNP%2Fuploads%2Fu2phFLC2SqJKFUFlPtqs%2FCreate%20SASI%20-%20Configure%20Risk.png?alt=media&amp;token=f5e9bc8c-3018-4db5-b2b3-2bb6f9f2aec6" alt=""><figcaption></figcaption></figure>
   2. In the **text editor**, add context and information to help recipients understand the risk. Define the overall alert message displayed at the beginning of the report.<br>

      **Example:** <br>

      ```
      You have uploaded {{count}} file(s) containing sensitive data to {{total_sites}} AI websites(s). The AI websites include: {{sites}}. The files include: {{ files }}
      ```

      \
      In the generated report, this will appear as:

      > You have uploaded 2 file(s) containing sensitive data to 2 AI websites(s). The AI websites include: chatgpt.com and claude.ai. The files include: Test sensitive secret1.docx

      \
      ![](https://3625419753-files.gitbook.io/~/files/v0/b/gitbook-x-prod.appspot.com/o/spaces%2FrbF1elaBmiAnq9oEPmNP%2Fuploads%2FetB39gJJcAFBOQSwOKgW%2FCyber%20Awareness%20report%20-%20select%20data%20type.png?alt=media\&token=8ed0ad8e-e05c-476a-ab20-86947d189c71)
   3. In **Incident Threshold**, define how many times an incident must occur before the Cyber Awareness Report is generated. If escalation is set to **3**, the Cyber Awareness Report is generated only after an incident matching the selected data type occurs **three times**. If it occurs once or twice, it is recorded, but the Cyber Awareness Report is not generated.
   4. In **Data Type Occurrence Threshold**, define how many times the selected data type must appear in a document before it is considered an incident, and the Cyber Awareness Report is triggered.\
      \
      *`Example: For`` `**`Files Uploaded to Generative AI Websites`**`, if the selected data type is`` `**`Visa Card Global`**` ``and the`*` `**`Incident Threshold`**` ``is set to 3 files and`` `**`Data Type Occurrence Threshold`**` ``is set to 5, the report is generated only if the uploaded file contains at least 5`` `*`Visa card matches and at least 3 such files (containing at least`*` ``5`` `*`Visa card matches) are uploaded to the AI website.`*&#x20;
   5. For risks associated with time-based activities, the **Duration Threshold** option is displayed in the configuration. Use this setting to define the minimum duration an activity must last before it is considered an incident.

      \
      *`Example: If the selected risk type is time spent on Generative AI websites and the Duration Threshold is set to 10 minutes or more, a Cyber Awareness Report is generated when a user browses Generative AI websites for 10 minutes or longer.`*
   6. Select the data types to monitor for this risk.
   7. Click **Save Configuration**, then click **Continue**.
6. In **Customise**, customise the appearance and content of the email report.
   1. In **Cover Image**, upload an image in PNG, JPG, or GIF format, up to 5 MB, to personalise the report.
   2. In **Introductory Message**, add or edit the content that will appear at the top of the email.&#x20;
   3. In **Footer Template**, add or edit the footer content displayed at the bottom of the email report.
   4. In **Privacy Template**, add or edit the privacy statement or disclaimer included at the bottom of the email report.<br>

      <figure><img src="https://3625419753-files.gitbook.io/~/files/v0/b/gitbook-x-prod.appspot.com/o/spaces%2FrbF1elaBmiAnq9oEPmNP%2Fuploads%2FEQfgHxRigJ8n6Yod4I9B%2FCyber%20Awareness%20report%20-%20customise.png?alt=media&amp;token=dce8fb18-9f15-4149-a41e-25ac96b4e91d" alt=""><figcaption></figcaption></figure>
7. After completing all steps, click **Create Report**. The report will be generated and sent based on the defined criteria and schedule.
8. You can also send a test email to a specified email address to preview how the report appears to recipients. To send a test email:
   1. In **Email to**, select or add the email address.
   2. Click **Send email**.\
      ![](https://3625419753-files.gitbook.io/~/files/v0/b/gitbook-x-prod.appspot.com/o/spaces%2FrbF1elaBmiAnq9oEPmNP%2Fuploads%2FBnBMBFT2gaek0HN6sYkj%2FCreate%20SASI%20-%20Send%20test%20email.png?alt=media\&token=7f14ae4a-4d41-4b5f-9c33-cf32fff04899)

## View Cyber Awareness Report Details

You can view the Cyber Awareness Report email that was sent to users.

1. Navigate to ***INSIGHT > Cyber Awareness***.
2. Click **View Details** in the **ACTION** column.<br>

   <figure><img src="https://3625419753-files.gitbook.io/~/files/v0/b/gitbook-x-prod.appspot.com/o/spaces%2FrbF1elaBmiAnq9oEPmNP%2Fuploads%2FnDu2nn7BefreG2hnInWH%2FSASI%20REPORT%20-%20view%20details.png?alt=media&amp;token=03a7d049-959c-49b9-bb72-ea1ff7a5128c" alt=""><figcaption></figcaption></figure>
3. In the **ACTION** column, click **View Email**.<br>

   <figure><img src="https://3625419753-files.gitbook.io/~/files/v0/b/gitbook-x-prod.appspot.com/o/spaces%2FrbF1elaBmiAnq9oEPmNP%2Fuploads%2FQ3pO1zMEfbcOXGGCR3iX%2FView%20email.png?alt=media&amp;token=403c985b-8d60-4d71-a3a9-5c3ca434c591" alt=""><figcaption></figcaption></figure>

## Edit Cyber Awareness Report

1. Navigate to ***INSIGHT > Cyber Awareness***.
2. Click **Edit Report** in the **ACTION** column.<br>

   <figure><img src="https://3625419753-files.gitbook.io/~/files/v0/b/gitbook-x-prod.appspot.com/o/spaces%2FrbF1elaBmiAnq9oEPmNP%2Fuploads%2F0a7Sd6hoQFfa0FoZFi7c%2FEdit%20SASI%20REPORT.png?alt=media&amp;token=339d57db-c984-4066-a8a2-866d703da820" alt=""><figcaption></figcaption></figure>
3. Update the necessary information and click **Update Report**.

## Delete Cyber Awareness Report

1. Navigate to ***INSIGHT > Cyber Awareness***.
2. Click the **Delete** icon in the **ACTION** column.<br>

   <figure><img src="https://3625419753-files.gitbook.io/~/files/v0/b/gitbook-x-prod.appspot.com/o/spaces%2FrbF1elaBmiAnq9oEPmNP%2Fuploads%2FpniAJaVNeSspGY5cQ3cn%2FDelete%20SASI%20REPORT.png?alt=media&amp;token=2fe362fd-ba86-4b5e-9f3b-8ca2bebf7648" alt=""><figcaption></figcaption></figure>
3. Click **Yes, delete** in the confirmation box.


# User-Based Risk Report

The **User-Based Risk Report** provides a focused view of user-specific incidents, highlighting individuals who may be bypassing policies or engaging in risky behaviour. It helps security teams identify high-risk users, understand their activities and incident patterns, and take timely actions to reduce potential threats across the organisation.

Clicking on an item in the report takes you to the INSIGHT dashboard for deeper investigation. You need to log in to the GuardWare Management Console to access the dashboard. You can customise the report to suit your requirements by choosing what data and users to include, how it is displayed, and how frequently it is sent.&#x20;

## Configure User-Based Risk Report

1. Navigate to ***INSIGHT > User-Based Risk***.
2. ​Click **Configure User-Based Risk Report**.<br>

   <figure><img src="https://3625419753-files.gitbook.io/~/files/v0/b/gitbook-x-prod.appspot.com/o/spaces%2FrbF1elaBmiAnq9oEPmNP%2Fuploads%2FQmYmNjL2oGvX4IITHpsr%2FConfigure%20User-based%20report%20button.png?alt=media&amp;token=65143b45-bb3f-477e-b052-d0cebe84921d" alt=""><figcaption></figcaption></figure>
3. ​In **General**:
   1. ​Enter the email subject.
   2. In **CC**, add valid email addresses for additional recipients, if needed. Separate multiple email addresses with commas.
   3. ​In **Email Start Date**, select the date when the first report will be sent.
   4. ​Enable the **Status.** The report will only be generated if the status is enabled.
   5. ​In **Frequency**, choose how often the report is sent.

      <figure><img src="https://3625419753-files.gitbook.io/~/files/v0/b/gitbook-x-prod.appspot.com/o/spaces%2FrbF1elaBmiAnq9oEPmNP%2Fuploads%2FE5491Q0H2ZvNpejo23oP%2FCreate%20User-based%20-%20General.png?alt=media&amp;token=708d9dc4-9ea7-4f15-83a7-2a99ed9043b0" alt=""><figcaption></figcaption></figure>
   6. ​Click **Next**.
4. ​In **Select Users**, search and select the users whose risk activities you want to track in the report and click **Continue**. Only activities related to selected users will be included.<br>

   <figure><img src="https://3625419753-files.gitbook.io/~/files/v0/b/gitbook-x-prod.appspot.com/o/spaces%2FrbF1elaBmiAnq9oEPmNP%2Fuploads%2F5oOgnqoHGS5FPorc3eCc%2FCreate%20User-based%20-%20Select%20users.png?alt=media&amp;token=1ba9e729-a134-4afa-b794-5e4a3168d7e9" alt=""><figcaption></figcaption></figure>
5. In Select data types, click **Add data types** and select the data types to monitor for this report
6. Click **Continue.**
7. In **Select Risks**, select and configure the risks to include in the report. To configure a risk:
   1. Select a risk from the list and select the **Incident Threshold** and **Data Type Occurrence** **Threshold**.
      1. In **Incident Threshold**, define how many times an incident must occur before the User-based risk report is generated. If the threshold is set to **3**, the report is generated only after an incident matching the selected data type occurs **three times**. If it occurs once or twice, it is recorded, but the report is not generated.
      2. In **Data Type Occurrence** **Threshold**, define how many times the selected data type must appear in a document before it is considered an incident, and the report is triggered.\
         \
         *`Example: For`` `**`Sensitive Files Uploaded to Generative AI Applications`**`, if the selected data type is`` `**`Visa Card Global`**` ``and the`*` `**`Incident Threshold`**` ``is set to 3 files and`` `**`Data Type Occurrence Threshold`**` ``is set to 5, the report is generated only if the uploaded file contains at least 5`` `*`Visa card matches and at least 3 such files (containing at least`*` ``5`` `*`Visa card matches) are uploaded to the AI application.`*&#x20;
      3. For risks associated with time-based activities, the **Duration Threshold** option is displayed in the configuration. Use this setting to define the minimum duration an activity must last before it is considered an incident.

         \
         *`Example: If the selected risk type is Time spent on Generative AI websites and the Duration Threshold is set to 10 minutes or more, a report is generated when a user browses Generative AI websites for 10 minutes or longer.`* \ <br>

         <figure><img src="https://3625419753-files.gitbook.io/~/files/v0/b/gitbook-x-prod.appspot.com/o/spaces%2FrbF1elaBmiAnq9oEPmNP%2Fuploads%2FaFvmsMsS2B1frToeNItC%2Fimage.png?alt=media&amp;token=e628486a-2741-4d37-838b-931099279493" alt=""><figcaption></figcaption></figure>

   2. Click **Edit** to customise further.&#x20;

   3. In the **first text editor**, add context and information to help recipients understand the risk. Define the overall alert message displayed at the beginning of the report.<br>

      **Example:** <br>

      ```
      {{numUsers}} user(s) uploaded {{count}} file(s) containing sensitive data to AI applications.
      ```

      \
      In the generated report, this will appear as:

      > 1 user(s) uploaded 21 file(s) containing sensitive data to AI applications.

   4. In the **second text editor (User-level template)**, add the detailed information displayed for each affected user. It can include the user name, number of files, AI applications involved, and the names of uploaded files.<br>

      **Example:**<br>

      ```
      {{user}} - {{count}} file(s).
      AI applications include: {{apps}}.
      Files include: {{files}}
      ```

      \
      In the generated report, this will appear as:<br>

      > JOHNDOE - 21 file(s).\
      > AI applications include: CHATGPT.EXE and CLAUDE.EXE.\
      > Files include: codex.json, icon.png, browser.png, and 16 more.

      \
      ![](https://3625419753-files.gitbook.io/~/files/v0/b/gitbook-x-prod.appspot.com/o/spaces%2FrbF1elaBmiAnq9oEPmNP%2Fuploads%2FpUwSQLoj2Jy2ZksJeFAp%2Fimage.png?alt=media\&token=8b86abc2-6311-46d1-aafa-c42f69a64ec2)<br>

   5. Click **Save Configuration**, then click **Continue**.
8. In **Customise**, customise the appearance and content of the email report.
   1. In **Cover Image**, upload an image in PNG, JPG, or GIF format, up to 5 MB, to personalise the report.
   2. In **Introductory Message**, add or edit the content that will appear at the top of the email.&#x20;
   3. In **Footer Template**, add or edit the footer content displayed at the bottom of the email report.
   4. In **Privacy Template**, add or edit the privacy statement or disclaimer included at the bottom of the email report.<br>

      <figure><img src="https://3625419753-files.gitbook.io/~/files/v0/b/gitbook-x-prod.appspot.com/o/spaces%2FrbF1elaBmiAnq9oEPmNP%2Fuploads%2FVy4ZJ9iXDTdTOLcJC4G7%2FCreate%20User-based%20-%20Customise.png?alt=media&amp;token=dcfd6775-a3f3-4fb9-917f-7be0701dfb85" alt=""><figcaption></figcaption></figure>
9. After completing all steps, click **Save**. The report will be generated and sent based on the defined criteria and schedule.
10. You can also send a test email to a specified email address to preview how the report appears to recipients. To send a test email:
    1. In **Email to**, select or add the email address.
    2. Click **Send Test Email**.<br>

       <figure><img src="https://3625419753-files.gitbook.io/~/files/v0/b/gitbook-x-prod.appspot.com/o/spaces%2FrbF1elaBmiAnq9oEPmNP%2Fuploads%2FBnBMBFT2gaek0HN6sYkj%2FCreate%20SASI%20-%20Send%20test%20email.png?alt=media&amp;token=7f14ae4a-4d41-4b5f-9c33-cf32fff04899" alt=""><figcaption></figcaption></figure>

## View User-Based Risk Report Details

You can view the User-Based Risk Report email that was sent to users.

1. Navigate to ***INSIGHT > User-Based Risk***.
2. Click **View Details** in the **ACTION** column.<br>

   <figure><img src="https://3625419753-files.gitbook.io/~/files/v0/b/gitbook-x-prod.appspot.com/o/spaces%2FrbF1elaBmiAnq9oEPmNP%2Fuploads%2FYqf3SETX3iVyai46VgmQ%2FView%20User-based%20report.png?alt=media&amp;token=e00f42bf-c43b-49fe-a377-a4986d00a131" alt=""><figcaption></figcaption></figure>
3. In the **ACTION** column, click **View Email**.<br>

   <figure><img src="https://3625419753-files.gitbook.io/~/files/v0/b/gitbook-x-prod.appspot.com/o/spaces%2FrbF1elaBmiAnq9oEPmNP%2Fuploads%2FdrFKijP6CDy8KowxjT1p%2FView%20email%20User-based%20report.png?alt=media&amp;token=e1415db7-1a39-4880-b8b8-bfa6f825a0f1" alt=""><figcaption></figcaption></figure>

## Edit User-Based Risk Report

1. Navigate to ***INSIGHT > User-Based Risk***.
2. Click **Edit Report** in the **ACTION** column.<br>

   <figure><img src="https://3625419753-files.gitbook.io/~/files/v0/b/gitbook-x-prod.appspot.com/o/spaces%2FrbF1elaBmiAnq9oEPmNP%2Fuploads%2FIW3W0uhoNBBuzaAckBAC%2FEdit%20User-based%20report.png?alt=media&amp;token=e8cd2a2a-89f5-4f41-bc75-930e45e1776d" alt=""><figcaption></figcaption></figure>
3. Update the necessary information and click **Update Report**.

## Delete User-Based Risk Report

1. Navigate to ***INSIGHT > User-Based Risk***.
2. Click the **Delete** icon in the **ACTION** column.<br>

   <figure><img src="https://3625419753-files.gitbook.io/~/files/v0/b/gitbook-x-prod.appspot.com/o/spaces%2FrbF1elaBmiAnq9oEPmNP%2Fuploads%2FHJMBYoR9cEJfIFeCvGHU%2FDelete%20User-based%20report.png?alt=media&amp;token=b871f893-d7cb-4c8b-8ba8-a9e94afa0c78" alt=""><figcaption></figcaption></figure>
3. Click **Yes, delete** in the confirmation box.


# Risk Summary Report

The **Risk Summary Report** provides a consolidated, high-level overview of risky activities and user behaviour of your organisation in a single email, helping you quickly understand your organisation’s overall risk posture. It gives you visibility into what kinds of incidents are happening in your organisation and which users are showing risky behaviour, so your security teams can take necessary actions on time. &#x20;

Clicking on an item in the report takes you to the INSIGHT Dashboard for deeper investigation. You need to log in to GuardWare Management Console to access the Dashboard. You can customise the report to suit your requirements by choosing what data to include, how it is displayed, and how frequently it is sent.&#x20;

## Configure Risk Summary Report

1. Navigate to ***INSIGHT > Risk Summary***.
2. ​Click **+ New Risk Summary**.<br>

   <figure><img src="https://3625419753-files.gitbook.io/~/files/v0/b/gitbook-x-prod.appspot.com/o/spaces%2FrbF1elaBmiAnq9oEPmNP%2Fuploads%2FtRjSeSsEn48yHyR4frVm%2FNew%20Risk%20Summary%20button.png?alt=media&amp;token=97530c36-66e5-4853-b08d-ab8906a2a6be" alt=""><figcaption></figcaption></figure>
3. ​In **General**:
   1. ​Enter the email subject.
   2. ​In **Email On**, select the date when the first report will be sent.
   3. ​In **Email To**, enter or select the email addresses of users who will receive the report.
   4. ​In **Duration**, choose how often the report is sent:
      * ​**Daily:** The report is sent every day after the selected start date.
      * ​**Weekly:** The report is sent once every week on the same day of the week as the start date.
      * ​**Monthly:** The report is sent once every month on the same day as the start date.<br>

        <figure><img src="https://3625419753-files.gitbook.io/~/files/v0/b/gitbook-x-prod.appspot.com/o/spaces%2FrbF1elaBmiAnq9oEPmNP%2Fuploads%2FDGFfFASsPMSqFQRN5yeh%2FStep%201-%20General.png?alt=media&amp;token=33719866-19d8-43e0-9f77-057745427691" alt=""><figcaption></figcaption></figure>
   5. ​Click **Next**.
4. ​In **Select Widget,** select the [widgets](#widgets) to include in your report and click **Next**. These widgets determine what types of risk activities are analysed. <br>

   <figure><img src="https://3625419753-files.gitbook.io/~/files/v0/b/gitbook-x-prod.appspot.com/o/spaces%2FrbF1elaBmiAnq9oEPmNP%2Fuploads%2FBnDZ2sUwqGOLx36hjhci%2FStep%202%20-%20Select%20widgets.png?alt=media&amp;token=de194858-00b3-4f65-bfe8-a23c615acf1b" alt=""><figcaption></figcaption></figure>
5. The **Filter Options** let you narrow down SharePoint-related information in the report so you only see the information you're interested in.&#x20;
   1. ​In **File Name**, enter the file name to filter results related to a specific SharePoint document. The report will include data only for files that match this name.\
      For example: if you add Salary Review\.xlsx and AI\_Strategy.pdf, only incidents involving these files will appear in the report.
   2. ​In **SharePoint File Path**, enter the file or folder path within the SharePoint site to further narrow down the results. This limits the results to a particular file or folder within your SharePoint environment.
   3. ​In **SharePoint Site URL**, search and select the URL to limit results to activities associated with a specific SharePoint site.
   4. Click **Next**.
6. In **Select Users**, search and select the users whose risk activities you want to track in the report and click **Next**. Only activities related to selected users will be included.<br>

   <figure><img src="https://3625419753-files.gitbook.io/~/files/v0/b/gitbook-x-prod.appspot.com/o/spaces%2FrbF1elaBmiAnq9oEPmNP%2Fuploads%2FJoQjqi7wKZDUqzqEH5Bw%2Fimage.png?alt=media&amp;token=b69e71c1-583b-4901-919d-13a258819289" alt=""><figcaption></figcaption></figure>
7. In **Data Types**, select relevant data types to include in the report and click **Next**.\
   ![](https://3625419753-files.gitbook.io/~/files/v0/b/gitbook-x-prod.appspot.com/o/spaces%2FrbF1elaBmiAnq9oEPmNP%2Fuploads%2FDHExaC5LHKVRwZ9YKXlj%2FStep%205%20-%20Data%20types.png?alt=media\&token=1176989b-40e8-4221-b4e1-aa1e7b72d56d)
8. In **Customisation**, customise the appearance and content of the report.
   1. In **Banner Image**, upload an image in PNG, JPG, or GIF format, up to 5 MB, to personalise the report.
   2. In the text box, add the content that will appear in the report. This can include an introductory message, risk summaries, additional instructions, notes, and more.&#x20;
   3. Click **Next**.<br>

      <figure><img src="https://3625419753-files.gitbook.io/~/files/v0/b/gitbook-x-prod.appspot.com/o/spaces%2FrbF1elaBmiAnq9oEPmNP%2Fuploads%2Ful0hID5JfHQYtpXIZefE%2FStep%206%20-%20Customisation.png?alt=media&amp;token=cb91d945-45bb-44ed-a2da-dcef0122edcb" alt=""><figcaption></figcaption></figure>
9. In **Send Test Email**,&#x20;
   1. In **Date Range,** select the time period for which the Risk Summary report data should be generated.
   2. In **Email to**, enter the recipient's email address.
   3. Click **Send Email**.
10. After completing all steps, click **Save**. The report will be generated and sent based on the defined criteria and schedule.

### Widgets

#### **SharePoint External**

1. **External Access:** Shows when and how files stored in SharePoint are being accessed by users outside the organisation’s domain. This helps identify potential exposure of organisational data outside trusted boundaries.
2. **External Downloads:** Shows which files are being downloaded by external users and how often. This helps highlight potential data exfiltration, especially when large volumes or sensitive files are involved.
3. **Anonymous Downloads:** Shows downloads performed using anonymous links that do not require authentication. Since user identity is not verified, this represents a higher risk of uncontrolled data distribution.
4. **Anonymous Access:** Shows access to SharePoint content through anonymous links. This helps identify content that is accessible without authentication, increasing the risk of unauthorised access.
5. **Platform Downloads External Mobile:** Shows file downloads by external users on mobile devices. This provides visibility into access from potentially unmanaged or less secure environments.
6. **Platform Access External Mobile:** Shows access to SharePoint content by external users from mobile devices, helping identify activity from untrusted or non-corporate devices.
7. **Links Shared to External Users using Teams:** Shows files or links shared with external users through Microsoft Teams, providing visibility into collaboration-based sharing activities.
8. **Use of Sensitive Libraries by External Users:** Shows external user activity within libraries marked as sensitive, helping identify access to critical or confidential data.
9. **Downloads using Sensitive Libraries by External Users:** Shows downloads of files from sensitive libraries by external users, indicating potential data leakage risks.

#### **SharePoint Internal**

1. **Creation of Links for Anonymous Users:** Shows when internal users create anonymous access links, which may introduce risks by allowing access without authentication.
2. **Internal Access:** Shows access to SharePoint files, folders, or sites by internal users, helping identify unusual or unexpected access behaviour.
3. **Internal Downloads:** Shows files downloaded by internal users. High-volume or unusual downloads may indicate potential misuse or insider risk.
4. **Platform Downloads Internal (Mobile Devices):** Shows downloads performed by internal users on mobile devices, providing visibility into activity outside controlled environments.
5. **Platform Access Internal (Mobile Devices):** Shows SharePoint access by internal users from mobile devices, helping track access from non-corporate or unmanaged devices.
6. **Links Shared to Internal Users using Teams:** Shows files or links shared internally through Microsoft Teams, helping track internal collaboration and data distribution.
7. **Use of Sensitive Libraries by Internal Users:** Shows internal user activity within sensitive libraries, helping ensure appropriate access to critical data.
8. **Downloads using Sensitive Libraries by Internal Users:** Shows downloads of sensitive files by internal users, indicating potential insider risk or policy violations.
9. **Internal File Deletions:** Shows file deletion activity by internal users, helping identify accidental or intentional data removal.
10. **Internal File Uploads:** Shows files uploaded by internal users to SharePoint, providing visibility into new data being introduced.
11. **Internal File Deletions from Sensitive Libraries:** Shows deletion of files from sensitive libraries by internal users, highlighting potential loss of critical data.
12. **Internal File Uploads to Sensitive Libraries:** Shows uploads of files to sensitive libraries by internal users, helping track what data is being stored in controlled locations.

#### **Email**

1. **Emailing of attachments from Corporate Email to Non-Corporate:** Shows attachments sent from corporate email accounts to external (non-corporate) recipients, helping identify potential data sharing outside the organisation.
2. **Emailing of attachments from Corporate Email Address to Unsecure Email Address:** Shows attachments sent to email addresses that are considered insecure or untrusted, highlighting increased risk of data exposure.
3. **Emailing of attachments from Corporate Email Address to Personal Email Address:** Shows attachments sent from corporate accounts to personal email accounts (e.g. Gmail, Yahoo), indicating potential data leakage.
4. **Emailing of attachments from Corporate Email Address to Potential Personal Email Address:** Shows attachments sent to email addresses that may be personal but are not explicitly verified, helping detect possible policy violations.
5. **Emailing of attachments from Corporate Email Address to Own Corporate Email Address:** Shows attachments sent within the organisation using corporate email accounts. While internal, unusual patterns may still indicate misuse.
6. **Emailing of attachments from Non-Corporate Email Address:** Shows attachments sent using non-corporate email accounts on organisational devices, indicating potential bypass of corporate controls.

#### **Data Transfer using Non-Corporate Websites**

1. **File Uploads to Non-Corporate Websites:** Shows files uploaded to external or non-corporate websites, helping identify potential data exfiltration through web platforms.

**File Uploads to Non-Corporate File Sharing Applications**

1. **File Uploads via Non-Corporate Sharing Applications:** Shows files uploaded using non-corporate file sharing applications, indicating potential unauthorised data transfer.
2. **File Uploads to Non-Corporate OneDrive Folders:** Shows files uploaded to personal or non-corporate OneDrive accounts, highlighting the risk of data leaving the organisation’s control.

#### **Storage Device Risk**

1. **Files Transferred to Non-Corporate External Storage:** Shows files copied or transferred to external storage devices (e.g. USB drives, external hard disks) that are not managed by the organisation.
2. **Insertion of Non-Corporate Storage Devices:** Shows when external storage devices are connected to organisational systems, providing visibility into potential data transfer points.

#### **Printing Incidents**

1. **Files Printed using Non-Corporate Printers:** Shows files printed using printers that are not managed or approved by the organisation, increasing the risk of data leakage.

#### **Key Stroke Capture**

1. **Key Stroke Capture of Monitored Phrases in Non-Corporate Applications:** Shows instances where monitored or sensitive phrases are typed into non-corporate applications, indicating possible exposure of sensitive information.

#### **Copy Paste**

1. **Copy Paste of Monitored Phrases into Non-Corporate Applications:** Shows when sensitive or monitored content is copied and pasted into non-corporate applications, highlighting potential data leakage.

#### **Access of Documents on Local Devices**

1. **Viewing of Office Documents:** Shows when Office documents are accessed locally on user devices. This provides baseline visibility, though typically considered lower risk.

#### **Usage Of AI Tools**

1. **Files Uploaded to Generative AI Applications:** Shows files uploaded to installed or integrated generative AI applications, indicating potential exposure of organisational data.
2. **Files Uploaded to Generative AI Websites:** Shows files uploaded to web-based generative AI platforms, which may pose higher risks due to external processing of data.
3. **Sensitive Prompts Used in AI Websites:** Shows instances where sensitive or monitored information is entered as prompts in AI websites.
4. **Time Spent on Generative AI Applications:** Shows the duration of usage of generative AI applications, helping assess behavioural patterns and potential productivity or data risks.
5. **Time Spent on Generative AI Websites:** Shows time spent on web-based AI tools, providing insight into external AI usage trends.

#### **Usage of Non-Corporate Websites and Applications**

1. **Time Spent on Non-Corporate Websites:** Shows the amount of time users spend on non-corporate websites, helping identify potential productivity concerns or risky browsing behaviour.
2. **Time Spent on Non-Corporate Applications:** Shows time spent on non-corporate applications, providing visibility into usage of unapproved software.

## Enable/Disable Risk Summary Report

You can enable or disable the Risk Summary Report. When enabled, the system sends the report based on the configured settings and schedule; when disabled, the report is not sent.

To enable or disable the Risk Summary Report:

1. Navigate to ***INSIGHT > Risk Summary***.
2. In the **STATUS** column, use the toggle to turn the report on or off.

<figure><img src="https://3625419753-files.gitbook.io/~/files/v0/b/gitbook-x-prod.appspot.com/o/spaces%2FrbF1elaBmiAnq9oEPmNP%2Fuploads%2FpaUPzikDnej76xXgDejs%2FEnable%20Disable%20Risk%20summary%20report.png?alt=media&amp;token=3c8ee334-cea5-4d9d-baf7-8fe5b0064c05" alt=""><figcaption></figcaption></figure>

## Update a Risk Summary Report

1. Navigate to ***INSIGHT > Risk Summary***.
2. Click **Edit** under the **ACTIONS** column.<br>

   <figure><img src="https://3625419753-files.gitbook.io/~/files/v0/b/gitbook-x-prod.appspot.com/o/spaces%2FrbF1elaBmiAnq9oEPmNP%2Fuploads%2FuvJPN2aQ8VhHzC5Mk6oL%2FEdit%20Risk%20Summary.png?alt=media&amp;token=81147990-b3b7-4a3f-8e7e-f7c75b8d172e" alt=""><figcaption></figcaption></figure>
3. Edit the information in each section, then click **Update** at the end.

## Delete a Risk Summary Report

1. Navigate to ***INSIGHT > Risk Summary***.
2. Click the **Delete** icon under the **ACTIONS** column.<br>

   <figure><img src="https://3625419753-files.gitbook.io/~/files/v0/b/gitbook-x-prod.appspot.com/o/spaces%2FrbF1elaBmiAnq9oEPmNP%2Fuploads%2FNcE5pRRgzEX0GkjWccBS%2FDelete%20Risk%20Summary.png?alt=media&amp;token=b9319a6c-496e-4c9f-8ab3-d74cba446ff1" alt=""><figcaption></figcaption></figure>
3. Click **Yes, Delete it!** to confirm.


# Single User Report

The **Single User Report** provides a detailed overview of an individual user's activities and risk events in a consolidated Excel file. You can select one or more users and specify an email recipient to receive the generated reports.

Each selected user receives a personalised report containing separate worksheets for different activity and risk categories, providing a comprehensive view of the user's behaviour and security-related activities.

The report can include worksheets such as Risk Summary, Productivity Overview, Storage Transfer, Application Transfer, Website Uploads, Copy Paste Incidents, Printing Incidents, and so on. Each worksheet provides activity-level information to help you understand the user's behaviour, identify potential risks, and investigate security incidents.

The generated Excel file is delivered to the specified recipient by email, making it suitable for reviewing an individual user's activity without requiring access to the INSIGHT console.

## Configure Single User Report

1. Navigate to ***INSIGHT > Single User Report***.
2. Click **Configure Single User Risk Report** and enter the following details.<br>

   <figure><img src="https://3625419753-files.gitbook.io/~/files/v0/b/gitbook-x-prod.appspot.com/o/spaces%2FrbF1elaBmiAnq9oEPmNP%2Fuploads%2FfAaUqwMPNNf6LDLawpL0%2Fimage.png?alt=media&amp;token=adadae1e-4a03-419c-9b07-4ec49345e6d9" alt=""><figcaption></figcaption></figure>
3. **Send To Email:** Enter the email address to which the report should be sent.
4. **CC Emails:** Add one or more email addresses to receive a copy of the report.
5. **From Date:** Select the start date for the report.
6. **To Date:** Select the end date for the report.
7. **Selected Users:** Select the users whose activities you want to include in the report.
8. **Email Message:** Enter a message to include in the report email. Select **Reset to Default** to restore the default message.
9. **Password** *(optional):* Enter a password to protect the generated Excel file.
10. Click **Create Report** to generate and email the report.\ <br>

    <figure><img src="https://3625419753-files.gitbook.io/~/files/v0/b/gitbook-x-prod.appspot.com/o/spaces%2FrbF1elaBmiAnq9oEPmNP%2Fuploads%2FoIeReDZS8CAdjIKrOXSF%2Fimage.png?alt=media&amp;token=a332a7f0-9d44-4fc0-8db6-35c5de8dd8ff" alt="" width="533"><figcaption></figcaption></figure>

## View Generated Reports

1. Navigate to ***INSIGHT > Single User Report***.
2. Locate the report you want to view.
3. Click **Generated Reports** under the **ACTION** column.<br>

   <figure><img src="https://3625419753-files.gitbook.io/~/files/v0/b/gitbook-x-prod.appspot.com/o/spaces%2FrbF1elaBmiAnq9oEPmNP%2Fuploads%2Fwv0Iy4my8qIZdv7czTGz%2Fimage.png?alt=media&amp;token=102cd105-af4e-45c1-9b74-d5e77c18e3d8" alt=""><figcaption></figcaption></figure>
4. Click the **Download** icon under the **FILE PATH** column to download the generated Excel file.<br>

   <figure><img src="https://3625419753-files.gitbook.io/~/files/v0/b/gitbook-x-prod.appspot.com/o/spaces%2FrbF1elaBmiAnq9oEPmNP%2Fuploads%2FQ5Fbhp5EI3ZaDSNIUR5W%2Fimage.png?alt=media&amp;token=63cfce60-c5d9-4494-952d-a386131f925c" alt=""><figcaption></figcaption></figure>

## View Report Logs

1. Navigate to ***INSIGHT > Single User Report***.
2. Locate the report you want to review.
3. Click **Logs** under the **ACTION** column.<br>

   <figure><img src="https://3625419753-files.gitbook.io/~/files/v0/b/gitbook-x-prod.appspot.com/o/spaces%2FrbF1elaBmiAnq9oEPmNP%2Fuploads%2FgqkMkLT7euWJhnRiCTam%2Fimage.png?alt=media&amp;token=d97e6a18-3935-4420-b73c-bd5298fb78d2" alt=""><figcaption></figcaption></figure>
4. Review the logs to check the report generation details and status.

## Edit a Single User Report

1. Navigate to ***INSIGHT > Single User Report***.
2. Locate the report you want to modify.
3. Click **Edit** under the **ACTION** column.<br>

   <figure><img src="https://3625419753-files.gitbook.io/~/files/v0/b/gitbook-x-prod.appspot.com/o/spaces%2FrbF1elaBmiAnq9oEPmNP%2Fuploads%2FeqBQkoBszmYB4gJLlyiW%2Fimage.png?alt=media&amp;token=1c88b67d-e7ff-47bc-b0d3-167e6f1ccdaf" alt=""><figcaption></figcaption></figure>
4. Edit the required information, then click **Update** **Report** to save the changes.

## Regenerate a Single User Report

1. Navigate to ***INSIGHT > Single User Report***.
2. Locate the report you want to generate again.
3. Click **Regenerate** under the **ACTION** column.<br>

   <figure><img src="https://3625419753-files.gitbook.io/~/files/v0/b/gitbook-x-prod.appspot.com/o/spaces%2FrbF1elaBmiAnq9oEPmNP%2Fuploads%2FZ0UTdD4FTutS0b77tooO%2Fimage.png?alt=media&amp;token=e2bc5fe3-2fce-4184-a35d-8c02f4266ed4" alt=""><figcaption></figcaption></figure>

The report is regenerated using the existing report configuration and sent to the specified recipient.


# Uninstall INSIGHT Agent

You can uninstall the INSIGHT Agent using either the Management Console or the uninstaller file.

## Uninstall via Management Console

The **Uninstall Client** command under **Devices > INSIGHT** removes the INSIGHT agent from the selected devices.

Use this method to remotely uninstall the INSIGHT agent from a device.

1. Navigate to **Devices > INSIGHT**.
2. Select one or more devices from the list and click **Assign Command**.<br>

   <figure><img src="https://3625419753-files.gitbook.io/~/files/v0/b/gitbook-x-prod.appspot.com/o/spaces%2FrbF1elaBmiAnq9oEPmNP%2Fuploads%2FNa6gOkDCHHnhaOl1S1nJ%2FAssign%20Command%20-%20Uninstall.png?alt=media&amp;token=7d329234-0440-46a1-8ced-74ce3802dbe8" alt=""><figcaption></figcaption></figure>
3. Select **Uninstall Client**.<br>

   <figure><img src="https://3625419753-files.gitbook.io/~/files/v0/b/gitbook-x-prod.appspot.com/o/spaces%2FrbF1elaBmiAnq9oEPmNP%2Fuploads%2FfrdkAtVQB7o45nGDHmSK%2FUninstall%20INSIGHT%20Agent.png?alt=media&amp;token=bcb6e2d2-b42c-49e3-9fd9-cdd1319239f2" alt=""><figcaption></figcaption></figure>
4. Select either **Immediate** or **Silent**.
   1. **Immediate:** Uninstalls the agent straight away. The user's session is interrupted and `explorer.exe` is restarted.
   2. **Silent:** Uninstalls the agent in the background. Cleanup completes on the next device restart with no user interruption.
5. Click **Confirm** to assign the command.

## Uninstall via Uninstaller File

Use this method to uninstall the agent directly from a PC.

1. Right-click the uninstaller file and select **Run as administrator**.
2. Click **Yes** in the confirmation pop-up.\
   ![](https://3625419753-files.gitbook.io/~/files/v0/b/gitbook-x-prod.appspot.com/o/spaces%2FrbF1elaBmiAnq9oEPmNP%2Fuploads%2FGO0RUC60v19JI2YISdf2%2FUninstall%20Agent%201.png?alt=media\&token=f7b5f15a-4477-4c70-b7c0-1c5033e985a9)
3. If there are any open applications that should be closed before continuing to uninstall, a pop-up appears, select **Automatically close applications and attempt to restart them after setup is complete** and click **Ok**.\
   ![](https://3625419753-files.gitbook.io/~/files/v0/b/gitbook-x-prod.appspot.com/o/spaces%2FrbF1elaBmiAnq9oEPmNP%2Fuploads%2FBA3nDIZ43wswCo8arRVX%2FUninstall%20Agent%202.png?alt=media\&token=b75c30c6-c3de-48c7-bbbf-9ccdea46eed5)
4. &#x20;The uninstallation process will complete.


# Introduction to INSIGHT

GuardWare INSIGHT is a data visibility and monitoring solution that helps your organisation understand how data is being accessed, shared, and used across both internal and external environments. It provides a unified view of user activity and file movement, allowing you to detect unusual behaviour, potential data leaks, and policy violations in real time. By analysing user behaviour patterns and access trends, INSIGHT highlights anomalies and potential insider threats before they escalate.

INSIGHT continuously tracks activities such as data uploads, downloads, copies, email transfers, and print actions across corporate and non-corporate channels. This visibility helps your organisation identify where sensitive data resides, how it moves, and who interacts with it, enabling proactive data-loss prevention and compliance management.

INSIGHT works across desktops, servers, and cloud environments. Once installed, it begins collecting and displaying activity data in the GuardWare INSIGHT Management Console, where you can view dashboards, run reports, and manage alert configurations.

## GuardWare INSIGHT Architecture

![](https://content.gitbook.com/content/SrTJQs663dZ9Te4UU3O8/blobs/DLQaGZVicsSKcmARfBxU/INSIGHT_architecture.png)

GuardWare INSIGHT consists of three main components: the **Web Management Console**, **Windows Endpoint Devices (Agents)**, and **Exchange & SharePoint** **Cloud Services**, which communicate securely using HTTPS and Microsoft Graph API.

#### 1. Windows Endpoint Devices (Agents)

The **GuardWare INSIGHT Agent** is installed on each endpoint device, such as desktops, laptops, and servers, within your organisation. It continuously monitors user activities and file interactions, such as file uploads, downloads, and copies, email attachments, and print actions, access to non-corporate websites and applications, and so on.

The agent securely transmits all collected activity data to the Web Management Console using HTTPS (TLS-encrypted communication).

#### 2. Web Management Console

The Web Management Console is the central monitoring and reporting component of GuardWare INSIGHT. It can be deployed on-premises or hosted in the cloud, depending on your organisation’s infrastructure.

Key functions include:

* Receiving and processing data sent by endpoint agents.
* Communicating with Microsoft 365 services (Exchange and SharePoint Online) using the Microsoft Graph API.
* Applying policy rules, detecting risk levels, and correlating endpoint and cloud events.
* Displaying information through predefined and custom dashboards such as *Risk Summary*, *General*, *Risks*, and *SharePoint*.
* Managing alerts, reports, user permissions, and configurations.

#### 3. Exchange & SharePoint Cloud Services

GuardWare INSIGHT integrates directly with Microsoft 365 cloud services, specifically Exchange Online and SharePoint Online, to extend visibility to cloud-based activities. The Management Console communicates with these services through the Microsoft Graph API. This allows the collection of audit and activity logs, such as file access, sharing, downloads, email attachments, and external user activities.

GuardWare INSIGHT unifies endpoint and cloud data visibility, ensuring that every user action, whether on-premises or in the cloud, is tracked, analysed, and reported through a single management interface.

## Next Steps

Once you’ve reviewed the overview, architecture, and system requirements, see the following guides:

* [**GuardWare INSIGHT Agent Installation**](/documentation/insight-v4/getting-started/install-insight-agent): Explains how to install the INSIGHT Agent on endpoint devices using different deployment methods, such as manual setup, Active Directory, Intune, or PDQDEPLOY.
* [**GuardWare INSIGHT Microsoft 365 Setup**](/documentation/insight-v4/getting-started/set-up-microsoft-365-cloud-monitor): Details the configuration steps required in Azure and Microsoft 365 to enable cloud monitoring for Exchange and SharePoint.
* [**GuardWare INSIGHT Dashboard Guide**](/documentation/insight-v4/dashboard/insight-dashboard): Describes the dashboards and widgets available in INSIGHT for monitoring user activity and system performance.


# System Requirements (On-Premises Deployment)

Before deploying the GuardWare INSIGHT Server and Client components (Agent), ensure that the following system requirements are met. These specifications are recommended for on-premises installations and may vary based on organisational size and usage.

| **Organisation Size**             | **Operating System**                   | **CPU Cores**              | **Memory (RAM)** | **Disk Space** |
| --------------------------------- | -------------------------------------- | -------------------------- | ---------------- | -------------- |
| Small to Medium (1–1,000 clients) | Microsoft Windows Server 2019 or later | 8 cores                    | 16 GB            | 500 GB–1 TB    |
| Large (1,001–5,000 clients)       | Microsoft Windows Server 2019 or later | 12 cores                   | 32 GB            | 2 TB           |
| Enterprise (5,000+ clients)       | Microsoft Windows Server 2019 or later | Contact GuardWare Support. |                  |                |

### Virtualisation Platform Support <a href="#virtualisation-platform-support" id="virtualisation-platform-support"></a>

GuardWare INSIGHT supports deployment on the following virtualisation platforms:

* Microsoft Azure
* Amazon Web Services (AWS)
* Microsoft Hyper-V
* VMware vSphere 4.0 and later
* VMware ESX/ESXi Server 6.0 and later

### Database Requirements <a href="#database-requirements" id="database-requirements"></a>

GuardWare INSIGHT requires the following database server to be installed:

* MySQL 8.0 or later

### Supported Operating Systems <a href="#supported-operating-systems" id="supported-operating-systems"></a>

The GuardWare INSIGHT Agent supports the following operating systems:

* Windows 10 or later


# Download INSIGHT Agent

The **GuardWare INSIGHT Agent** is installed on endpoint devices, such as desktops, laptops, and servers, within your organisation. It continuously monitors user activities and file interactions, such as file uploads, downloads, and copies, email attachments, and print actions, access to non-corporate websites and applications, and so on.

The Agent securely transmits all collected activity data to the Web Management Console using HTTPS (TLS-encrypted communication).

You can **download** the INSIGHT Agent directly **from the Management Console**. The downloaded agent includes the MSI configuration defined for your organisation, so no additional setup is required during installation.

## Prerequisite

To download the agent, you must first set up the MSI Config Settings for the organisation.

MSI Config Settings allow administrators to configure installation parameters for the GuardWare INSIGHT Agent MSI installer.

### Set up MSI Config Settings

1. Log in to the Management Console.
2. Navigate to **Settings Panel >** **General Settings**, click **MSI Config**, and enter the required details.<br>

   <figure><img src="https://1102323068-files.gitbook.io/~/files/v0/b/gitbook-x-prod.appspot.com/o/spaces%2FSrTJQs663dZ9Te4UU3O8%2Fuploads%2F4lvhWhD5MazE2rjh09cr%2FMSI%20Config%20set%20up.png?alt=media&amp;token=d099182d-b7f0-444e-954d-93896793d2b4" alt=""><figcaption></figcaption></figure>
3. **Organization:** Select the organisation for which the MSI configuration is created. The downloaded agent will be linked to this organisation and will register endpoints under it.
4. **Client Location:** Specify the location or site of the endpoint.
5. **Server Name**: Enter the hostname or domain of the INSIGHT server.
6. **Server IP**: Enter the IP address of the INSIGHT server. This is used by the agent to establish communication with the server.
7. **Server Port**: Enter the port used for communication between the agent and the server. Ensure the port is allowed in the firewall when required. The standard HTTPS port is 443.
8. **Is Proxy Server**: Enable this option if endpoints connect to the server through a proxy.
9. **Proxy Server IP**: Enter the IP address or hostname of the proxy server.
10. **Proxy Server Port**: Enter the port used by the proxy server.
11. **Proxy Override Path**: Specify addresses or domains that should bypass the proxy. Traffic to these destinations is sent directly.
12. **Is Proxy Authentication**: Enable this option if the proxy requires authentication.
13. **Proxy Username**: Enter the username used to authenticate with the proxy server.
14. **Proxy Password**: Enter the password used to authenticate with the proxy server.
15. **Update Link**: Specify the URL of the client update control file if it is hosted on a different server than the default. By default, agents look for this file on the connected Windows Server; however, you can use this field to point to a different server or location from which the agent retrieves update information.
16. **Uninstall Client Before Execute**: Enable this option to remove any existing agent before installing a new one. Use this when upgrading or redeploying the agent.&#x20;
17. **Advanced Options**
    1. **Retain Advanced Options**: Enable this option to preserve selected advanced settings during updates or reinstallation.
    2. **Option Use WFP**: Enable this option to use Windows Filtering Platform (WFP) for network-level monitoring and control.
    3. **Option Kill Browsers During Uninstall**: Enable this option to close running browsers during uninstallation to avoid conflicts.
    4. **Option Server Installer**: Enable this option to allow the agent to be installed on a Windows Server. By default, installation is blocked on server operating systems; enabling this option overrides that restriction.
    5. **Option Check Close Wait**: Enable this option to ensure required applications are closed before installation continues.
18. **Driver Options**
    1. **Retain Driver Option**: Enable this option to preserve selected driver settings during updates.
    2. **Enable** the required drivers. For a fresh installation, we recommend enabling all the following  drivers:
       1\.       GWDogFile: Prevents renaming and deletion of INSIGHT client system files.
       2\. GWScanner: Monitors USB file transfers with respect to productivity functionality.
       3\. ChatDocMon: Monitors chat and cloud applications.
       4\.       USBMon: Monitors USB file transfers for DLP functionality.
       5\. GWProcessGuardian: Prevents termination of INSIGHT client processes.
       6\. GWProxy: Monitors higher-level network traffic.
19. Click **Submit**.

## Download the Agent

Once the MSI configuration is complete for an organisation, the **Download Agent** link becomes available in the top-right menu. Click it to download the agent with the configured MSI settings.

<figure><img src="https://1102323068-files.gitbook.io/~/files/v0/b/gitbook-x-prod.appspot.com/o/spaces%2FSrTJQs663dZ9Te4UU3O8%2Fuploads%2FomauyHfrMK0yNSrozdoV%2FDownload%20Agent.png?alt=media&amp;token=f60b3f4c-d596-4432-b327-1d87f2d42adc" alt=""><figcaption></figcaption></figure>

{% hint style="info" %}
Update the MSI configuration whenever required and download a new agent to apply the changes.
{% endhint %}


# Install INSIGHT Agent

## System Requirements

Before installing the GuardWare INSIGHT Agent, ensure your system meets the minimum specifications. Meeting these prerequisites ensures smooth installation, stable performance, and proper communication with the INSIGHT Management Console.

<table><thead><tr><th width="255">Component</th><th>Minimum Requirement</th></tr></thead><tbody><tr><td>Processor</td><td>Dual-core processor or higher</td></tr><tr><td>Memory (RAM)</td><td>8 GB</td></tr><tr><td>Disk Space</td><td>500 MB free space</td></tr><tr><td>Operating System</td><td>Microsoft Windows 8.x, Windows 10 or later</td></tr></tbody></table>

## Whitelist GuardWare INSIGHT

To ensure the GuardWare INSIGHT Agent installs and functions correctly, you need to configure antivirus exclusions. For details, see [Whitelist GuardWare INSIGHT](/documentation/insight-v4/getting-started/whitelist-guardware-insight).

## Install GuardWare INSIGHT Agent Manually

The GuardWare INSIGHT Agent can be installed manually on individual endpoint devices. This process involves running the GuardWare INSIGHT Agent installer directly on each device and completing a simple setup wizard.

{% hint style="info" %}
The Agent installer file size is approximately 60 MB.
{% endhint %}

To install GuardWare INSIGHT Agent manually:

1. Double-click the GuardWare INSIGHT Agent installer file to begin the installation.
2. In the **Setup Wizard**, click **Next** to continue.

<div align="left"><img src="https://content.gitbook.com/content/SrTJQs663dZ9Te4UU3O8/blobs/bEAEqu55N9j3ZUs44iOj/INSIGHT_Agent_Installation_1.png" alt="" width="563"></div>

3. Choose the folder where you want to install the GuardWare INSIGHT agent and click **Next**. By default, the agent will be installed in: `C:\Program Files\`.

<div align="left"><img src="https://content.gitbook.com/content/SrTJQs663dZ9Te4UU3O8/blobs/T8aFD57FzgK9rDeDVJz8/INSIGHT_Agent_Installation_2.png" alt="" width="563"></div>

4. Click **Install** to begin the installation. The installation may take a few minutes to complete.

<div align="left"><img src="https://content.gitbook.com/content/SrTJQs663dZ9Te4UU3O8/blobs/g1JJRgDUGj0TBPAoGpfm/INSIGHT_Agent_Installation_3_new.png" alt="" width="563"></div>

During installation, a User Account Control (UAC) dialog box may appear. This is a standard Windows security feature that verifies whether you want to allow the installer to make changes to your computer. When this dialog appears:

1. Verify that the publisher is GuardWare Australia Pty Ltd.
2. Click **Yes** to allow the installation to proceed. Clicking **No** cancels the installation.
3. Once the installation is complete, click **Finish** to exit the wizard.

## Install GuardWare INSIGHT Agent Using Active Directory

You can deploy GuardWare INSIGHT Agent to multiple computers simultaneously using **Active Directory (AD)** Group Policy. This method automates installation across all devices within the selected organisational units (OUs), ensuring consistent configuration and minimal manual effort.

To install GuardWare INSIGHT Agent using AD:

1. On the **Active Directory Server**, click **Start** > **Run**.

<div align="left"><img src="https://content.gitbook.com/content/SrTJQs663dZ9Te4UU3O8/blobs/mdt8wWaLGkJEqdkcAuFO/image%2020251017%20053437.png" alt=""></div>

2. In **Active Directory Users and Computers**, create a new **Organisational Unit (OU)** and give it a name, for example, *Install GW INSIGHT Agent*. Creating a separate OU ensures the deployment policy does not conflict with existing group policies.
3. In the **Group Policy Management Console**, right-click the new OU and select **Create and Link a GPO Here**.
4. Enter a descriptive name for the policy, such as *GW INSIGHT Agent* *Installation*, and click **OK**. Once created, the same GPO can also be linked to other OUs if required.

<div align="left"><img src="https://content.gitbook.com/content/SrTJQs663dZ9Te4UU3O8/blobs/hC3mmNst3EEeOj8eeJ6H/image%2020251017%20053637.png" alt="" width="375"></div>

5. Right-click the new GPO and select **Edit** to open the **Group Policy Object Editor**.

<div align="left"><img src="https://content.gitbook.com/content/SrTJQs663dZ9Te4UU3O8/blobs/nOudPXEi8x7950mWnYXs/image%2020251017%20053815.png" alt="" width="563"></div>

6. In the editor, expand **Computer Configuration > Software Settings > Software Installation**.
7. Right-click **Software Installation**, select **New > Package**, and browse to the MSI file for the GuardWare INSIGHT Agent.

<div align="left"><img src="https://content.gitbook.com/content/SrTJQs663dZ9Te4UU3O8/blobs/SPqesYnAtJiYk04yhIco/image%2020251017%20053853.png" alt="" width="375"></div>

8. Enter the package path using the **FQDN (Fully Qualified Domain Name)** format, for example, `\\DC01\client\client.msi`, where `DC01` is your domain controller name and `client` is the shared folder containing the MSI installer.
9. Select the package and click **Open** to add it to the policy.
10. Close the **Group Policy Object Editor** once the package has been added.
11. In the **Group Policy Management Console**, confirm that the new GPO is listed under **Linked Group Policy Objects** for the selected OU.
12. Close the **Group Policy Management** window.
13. Click **Start > Run**, type `gpupdate /force`, and click **Ok** to refresh the Group Policy settings and apply the new configuration.

Once the Group Policy is updated, the GuardWare INSIGHT Agent will automatically install on all computers within the selected Organisational Unit the next time they start or update their policies.

## Install GuardWare INSIGHT Agent Using Microsoft Intune

You can deploy GuardWare INSIGHT Agent across multiple endpoint devices using Microsoft Intune. This method enables centralised and automated installation of the client on enrolled Windows devices, ensuring consistent deployment across your organisation.

To install GuardWare INSIGHT Agent using Microsoft INTUNE:

1. Sign in to the [**Microsoft Intune Admin Center**](https://intune.microsoft.com/) using your administrator account.
2. From the left navigation menu, navigate to **Apps > All apps**.

<div align="left"><img src="https://content.gitbook.com/content/SrTJQs663dZ9Te4UU3O8/blobs/KHDgzWN8J3nKuKT1ZpCN/step1_App_All%20app.png" alt="" width="375"></div>

3. Click **+ Create** to create a new application.

<div align="left"><img src="https://content.gitbook.com/content/SrTJQs663dZ9Te4UU3O8/blobs/vBxC4lhINmo0twt3TRzq/2_create_new_app.png" alt="" width="563"></div>

4. Under **Select app type**, choose **Line-of-business app**, and click **Select**.

<div align="left"><img src="https://content.gitbook.com/content/SrTJQs663dZ9Te4UU3O8/blobs/Y9Rlr0Fq8kBYu6f7run0/3%20lineofbusiness.png" alt="" width="375"></div>

5. In the **App information** section, click **Select app package file**, then browse and upload the GuardWare INSIGHT Agent installer file.

<div align="left"><img src="https://content.gitbook.com/content/SrTJQs663dZ9Te4UU3O8/blobs/K1KirXEHjoGJaq4nDl33/App%20package%20file.png" alt="" width="375"></div>

6. After the file is uploaded, review the app details and click **OK**.
7. Configure the following information in the **App information** section and click **Next**.
   * **Name:** Enter a display name of the application that appears in Intune and on endpoint devices during installation.
   * **Description:** Enter a description for the application.
   * **Publisher:** Enter the publisher’s name.

     <div align="left"><img src="https://content.gitbook.com/content/SrTJQs663dZ9Te4UU3O8/blobs/KZXTT2LL0hxqo21av5wl/Add%20app.png" alt="" width="563"></div>
8. In the **Assignments** tab, specify which devices or user groups should receive the application.
   * Under **Required**, click **Add group** and select the **Azure AD device groups** or **user groups** where the GuardWare INSIGHT Agent should be installed automatically.

     <div align="left"><img src="https://content.gitbook.com/content/SrTJQs663dZ9Te4UU3O8/blobs/WS6AReAoGko173XI0wxe/add%20device%20groups.png" alt="" width="563"></div>
9. Click **Next**, review the configuration summary, and click **Create** to publish the deployment.

<div align="left"><img src="https://content.gitbook.com/content/SrTJQs663dZ9Te4UU3O8/blobs/16M0ChYTKHtnT3hC5aVO/Review%20and%20create.png" alt="" width="563"></div>

Once deployed, the **GuardWare INSIGHT Agent** will automatically install on all assigned devices the next time they check in with Intune. You can monitor the installation progress under *Apps > Monitor > Installation* status in the Intune Admin Center.

## Install GuardWare INSIGHT Agent Using PDQ Deploy

You can deploy the **GuardWare INSIGHT Agent** to multiple endpoint devices simultaneously using **PDQ Deploy**, a software deployment tool designed for centralised and silent installations. PDQ Deploy enables IT administrators to automate agent installation across the network without requiring any pre-installed agent on target machines.

#### Create a New Deployment Package

1. Open **PDQ Deploy**.
2. Click the **New Package** (📦) icon to create a new deployment package.
3. In **Package Properties**, fill in the following details:
   * **Name:** GuardWare INSIGHT Agent
   * **Version:** (enter the current agent version, e.g. 1.0.0)
   * **Run As:** Local System
   * **Description:** Installs the GuardWare INSIGHT Agent on endpoint devices.

     <div align="left"><img src="https://content.gitbook.com/content/SrTJQs663dZ9Te4UU3O8/blobs/uJHYwdKihPAViQE4w4jM/create%20new%20package.png" alt="" width="563"></div>
4. Click **Step 1** to define the installation command.
5. In **Install File**, select the GuardWare INSIGHT Agent installer file.
6. In **MSI Options**, configure the following:
   * **Operation:** Install
   * **Restart:** Never
   * **Quiet:** Yes (this ensures a silent installation with no user prompts).

     <div align="left"><img src="https://content.gitbook.com/content/SrTJQs663dZ9Te4UU3O8/blobs/qsVlByUNke6hlCttwna7/create%20new%20package%20step%202.png" alt="" width="563"></div>
7. Click the **Save** icon (💾) to save the package configuration.

#### Deploy the Agent

1. In PDQ Deploy, click **Deploy > Deploy Once**.
2. Click **Edit Credentials** > **Add Credentials** to set or edit the administrator credentials for deployment.

<div align="left"><img src="https://content.gitbook.com/content/SrTJQs663dZ9Te4UU3O8/blobs/h6e3yyWKcoZbSsklNCFN/Deploy%20the%20agent%20step%202.png" alt="" width="563"></div>

3. Enter the **Domain, User Name** (administrator account), **Password,** and click **Test Credentials** to verify access, then click **OK**.

<div align="left"><img src="https://content.gitbook.com/content/SrTJQs663dZ9Te4UU3O8/blobs/KR0npcgNSx675wIJd4TV/Deploy%20the%20agent%20step%203.png" alt="" width="563"></div>

4. Add the target computers for deployment:
   1. You can specify devices using either their **PC Name** or **IP Address**.
   2. Click **Add Computer** after entering each one.<br>

      <div align="left"><img src="https://content.gitbook.com/content/SrTJQs663dZ9Te4UU3O8/blobs/zUUVQdlV0wMxeXqtnQSK/Deploy%20the%20agent%20step%204.png" alt="" width="563"></div>
5. Select the appropriate **Credentials** and ensure **Run as Local System** is set to **Yes**.
6. Click **Deploy Now** to start the installation.

<div align="left"><img src="https://content.gitbook.com/content/SrTJQs663dZ9Te4UU3O8/blobs/SqV6Fz7thjDhq15er0SV/Deploy%20the%20agent%20step%205.png" alt="" width="563"></div>

PDQ Deploy will perform the following actions automatically:

* Copy the GuardWare INSIGHT Agent installer file to each target machine.
* Run the installation silently in the background.
* Display real-time status updates for each target device.

Once deployment is complete, the status will display as **Successful** for each device where the installation finished.

<div align="left"><img src="https://content.gitbook.com/content/SrTJQs663dZ9Te4UU3O8/blobs/CDjridp4omSB9TX41Uqy/Deploy%20the%20agent%20step%206.png" alt="" width="563"></div>


# Whitelist GuardWare INSIGHT

To ensure optimal performance and prevent interference with INSIGHT, configure your security tools as described below.

## Antivirus / Endpoint Protection Whitelisting

The GuardWare INSIGHT agent installs multiple components, including background services, monitoring agents, executables, and system drivers. These components may be incorrectly flagged or blocked by Anti-Virus, EDR, or XDR solutions. To prevent this, add the INSIGHT components to your security software’s whitelist or trusted applications list.

Whitelist the entire installation directory and the following components individually:

```
C:\Program Files (x86)\Guardware
C:\ProgramData\Guardware
```

**Executable Applications (.exe)**

<table><thead><tr><th width="178.79998779296875">Component</th><th>Path</th></tr></thead><tbody><tr><td>GWClient.exe</td><td>C:\Program Files (x86)\Guardware\Integrity Management\GWClient.exe</td></tr><tr><td>GWProxy.exe</td><td>C:\Program Files (x86)\Guardware\Integrity Management\GWProxy.exe</td></tr><tr><td>GWW.exe</td><td>C:\Program Files (x86)\Guardware\Integrity Management\GWW.exe</td></tr><tr><td>GWSyncMonitor.exe</td><td>C:\Program Files (x86)\Guardware\Integrity Management\GWSyncMonitor.exe</td></tr><tr><td>GWWarn.exe</td><td>C:\Program Files (x86)\Guardware\Integrity Management\GWWarn.exe</td></tr><tr><td>GWFileScan.exe</td><td>C:\Program Files (x86)\Guardware\Integrity Management\GWFileScan.exe</td></tr><tr><td>GWDrive.exe</td><td>C:\Program Files (x86)\Guardware\Integrity Management\GWDrive.exe</td></tr><tr><td>GWHardware.exe</td><td>C:\Program Files (x86)\Guardware\Integrity Management\GWHardware.exe</td></tr><tr><td>GWApplication.exe</td><td>C:\Program Files (x86)\Guardware\Integrity Management\GWApplication.exe</td></tr><tr><td>GWProxyEncrypt.exe</td><td>C:\Program Files (x86)\Guardware\Integrity Management\GWProxyEncrypt.exe</td></tr><tr><td>GWToast.exe</td><td>C:\Program Files (x86)\Guardware\Integrity Management\GWToast.exe</td></tr><tr><td>GWFPInstaller.exe</td><td>C:\Program Files (x86)\Guardware\Integrity Management\GWFPInstaller.exe</td></tr><tr><td>GWInstallSecurity.exe</td><td>C:\Program Files (x86)\Guardware\Integrity Management\GWInstallSecurity.exe</td></tr><tr><td>Install_driver.exe</td><td>C:\Program Files (x86)\Guardware\Integrity Management\Install_driver.exe</td></tr><tr><td>ManageExplorers.exe</td><td>C:\Program Files (x86)\Guardware\Integrity Management\ManageExplorers.exe</td></tr><tr><td>RegisterLSP32.exe</td><td>C:\Program Files (x86)\Guardware\Integrity Management\RegisterLSP32.exe</td></tr><tr><td>RegisterLSP64.exe</td><td>C:\Program Files (x86)\Guardware\Integrity Management\RegisterLSP64.exe</td></tr><tr><td>ScreenDPI.exe</td><td>C:\Program Files (x86)\Guardware\Integrity Management\ScreenDPI.exe</td></tr><tr><td>SSExplorerLauncher.exe</td><td>C:\Program Files (x86)\Guardware\Integrity Management\SSExplorerLauncher.exe</td></tr><tr><td>SSHelperProcess64.exe</td><td>C:\Program Files (x86)\Guardware\Integrity Management\SSHelperProcess64.exe</td></tr><tr><td>Updater.exe</td><td>C:\Program Files (x86)\Guardware\Integrity Management\Updater.exe</td></tr><tr><td>MSMInstallerNet35.exe</td><td>C:\Program Files (x86)\Guardware\Integrity Management\MSMInstallerNet35.exe</td></tr><tr><td>MSMInstallerNet40.exe</td><td>C:\Program Files (x86)\Guardware\Integrity Management\MSMInstallerNet40.exe</td></tr></tbody></table>

**Driver Files**

<table><thead><tr><th width="186.79998779296875">Component</th><th>Path</th></tr></thead><tbody><tr><td>GWChatDocMon.sys</td><td>C:\Program Files (x86)\Guardware\Integrity Management\GWChatDocMon.sys</td></tr><tr><td>GWDogfile.sys</td><td>C:\Program Files (x86)\Guardware\Integrity Management\GWDogfile.sys</td></tr><tr><td>GWPG.sys</td><td>C:\Program Files (x86)\Guardware\Integrity Management\GWPG.sys</td></tr><tr><td>GWScanner.sys</td><td>C:\Program Files (x86)\Guardware\Integrity Management\GWScanner.sys</td></tr><tr><td>GWUSBMon.sys</td><td>C:\Program Files (x86)\Guardware\Integrity Management\GWUSBMon.sys</td></tr><tr><td>GWChatDocMon.sys</td><td>C:\Windows\System32\drivers\GWChatDocMon.sys</td></tr><tr><td>GWDogfile.sys</td><td>C:\Windows\System32\drivers\GWDogfile.sys</td></tr><tr><td>GWPG.sys</td><td>C:\Windows\System32\drivers\GWPG.sys</td></tr><tr><td>GWScanner.sys</td><td>C:\Windows\System32\drivers\GWScanner.sys</td></tr><tr><td>GWUSBMon.sys</td><td>C:\Windows\System32\drivers\GWUSBMon.sys</td></tr></tbody></table>

## Firewall Configuration (If Required)

Firewall configuration is only required in environments where SSL inspection (HTTPS inspection) or strict outbound filtering is enabled.

In such cases, we recommend allowing and excluding INSIGHT-related traffic to ensure uninterrupted communication between the INSIGHT agent and the server.

#### Whitelist Guardware Server Domains

Add the following domain to your firewall’s allowlist or SSL inspection bypass list:

* `*.guardware.com.au`
* Example: `live07.guardware.com.au`

This ensures that traffic between the agent and server is not intercepted or modified.

#### Allow HTTPS Communication (Port 443)

Allow:

* Outbound HTTPS (TCP port 443)
* Inbound HTTPS (if required by your network policies)

#### Application-Based Firewall (If Applicable)

If your firewall uses application-level filtering, allow the following executable:

* `GWClient.exe`

This ensures that the INSIGHT agent can communicate with the server without restriction.


# Set Up Microsoft 365/Cloud Monitor

GuardWare INSIGHT integrates directly with Microsoft 365 cloud services, specifically Exchange Online and SharePoint Online, to monitor and analyse cloud-based activities. To enable this integration, several configurations must be completed in the Azure portal. Because the registration process relies on your organisation’s Azure configuration and credentials, it must be performed using the company’s Azure portal account by an authorised administrator.

The configurations involve registering an application in Azure, creating a certificate, and granting the required permissions and roles, which are explained below. These steps allow GuardWare INSIGHT to securely access monitoring data from Exchange and SharePoint. Once the configuration is complete, the generated information, such as application ID, certificates, and domain details, must be sent to GuardWare Support to complete the setup. See [Information to Be Sent to GuardWare](#information-to-be-sent-to-guardware) for the full list.

<table data-header-hidden><thead><tr><th width="262"></th><th></th></tr></thead><tbody><tr><td><strong>Requirement</strong></td><td><strong>Description</strong></td></tr><tr><td><strong>Application (Client) ID</strong></td><td>Identifies the GuardWare M365 Monitor Azure application. This ID is generated automatically when registering the application in Azure.</td></tr><tr><td><strong>Directory (Tenant) ID</strong></td><td>Identifies your organisation in Azure for email monitoring. This ID is also generated during Azure application registration.</td></tr><tr><td><strong>Organisation Primary Domain</strong></td><td>Identifies your organisation for SharePoint monitoring. This is your organisation’s primary <strong>.onmicrosoft.com</strong> domain.</td></tr><tr><td><strong>Application Permissions</strong></td><td><p>The following permissions are required in Azure for GuardWare Cloud Monitor to access Microsoft 365 data:</p><ul><li><code>Group.Read.All</code></li><li><code>GroupMember.Read.All</code></li><li><code>User.Read.All</code></li><li><code>Mail.Read</code></li><li><code>Mail.ReadBasic.All</code></li><li><code>Exchange.ManageAsApp</code></li><li><code>ActivityFeed.Read</code></li><li><code>ServiceHealth.Read</code></li></ul></td></tr><tr><td><strong>M365 Security Group</strong></td><td>Created in the Microsoft 365 Admin Center, this group defines the users whose emails are to be monitored.</td></tr><tr><td><strong>On-Premises Domain Name</strong></td><td>Maps GuardWare INSIGHT endpoint users to their corresponding Microsoft 365 email addresses within the GuardWare Server.</td></tr><tr><td><strong>Certificate and Password</strong></td><td>Used for secure communication between Microsoft 365 and GuardWare Cloud Monitor. The certificate is generated locally using Microsoft PowerShell.</td></tr></tbody></table>

### Register an Application on Azure Portal

To enable GuardWare INSIGHT to access and monitor Microsoft 365 data, you must first register a new application in the Azure portal. This application acts as a secure bridge between Microsoft 365 and GuardWare, allowing authorised access through assigned permissions and roles.

To register an application on the Azure Portal:

1. Go to the [Azure Portal](https://portal.azure.com/auth/login/) and sign in with your Microsoft 365 administrator account.
2. Navigate to **Microsoft Entra ID.**

   <div align="left"><img src="https://content.gitbook.com/content/SrTJQs663dZ9Te4UU3O8/blobs/pVIUwKuXumHv39e3BrMy/Microsoft_Entra_ID.png" alt="" width="563"></div>
3. Click **+Add**, and select **App registration**.

<div align="left"><img src="https://content.gitbook.com/content/SrTJQs663dZ9Te4UU3O8/blobs/i3RAiNSr22aYdVobZsa3/PROTECT%20%20%20Add%20App%20registration.png" alt="" width="563"></div>

4. Configure:
   1. **Name:** Enter a user-facing descriptive display name (e.g., `GuardWare M365 Monitor`).
   2. **Supported account types:** Select **Accounts in this organizational directory only (Single tenant)**.
   3. **Redirect URI:** Leave empty for service-to-service authentication.

      <div align="left"><img src="https://content.gitbook.com/content/SrTJQs663dZ9Te4UU3O8/blobs/hfjB3qdep5l7nFNWc74j/Register%20an%20application%20step%201.png" alt="" width="563"></div>
5. Click **Register**.

After registration is complete, you will get the **Application (client) ID** and **Directory (tenant) ID** in the Overview page. Copy and store them in a secure place. You’ll need it later to complete the setup.

![](https://content.gitbook.com/content/SrTJQs663dZ9Te4UU3O8/blobs/duxn6KWmmaVcvrmQO7YD/Application%20and%20Directory%20ID.png)

### Create a Self-Signed Certificate

You can create a self-signed certificate using Windows PowerShell with the following script to establish a secure connection between GuardWare INSIGHT and Microsoft 365. The certificate remains valid for three years.

Before running the script:

* Replace `<companydomain>` and `<password>` with your own values.
* The company domain is used as a descriptor and does not need to be accurate.
* Copy and store the password securely. You’ll need it later to complete the setup.
* The script generates two files:
  * A **.cer file**: Used to register the certificate with the Azure application.
  * A **.pfx file**: Used by `GWCloudMonitor.exe` to identify itself to Azure.
* Both `.cer` and `.pfx` are saved in `C:\Temp` (You can change the path as needed).

**PowerShell Script**

{% code overflow="wrap" %}

```powershell
# Create certificate
$mycert = New-SelfSignedCertificate -DnsName "<companydomain>" -CertStoreLocation "cert:\CurrentUser\My" -NotAfter (Get-Date).AddYears(3) -KeySpec KeyExchange

# Export certificate to .pfx file
$mycert | Export-PfxCertificate -FilePath mycert.pfx -Password (ConvertTo-SecureString -String "<password>" -AsPlainText -Force)

# Export certificate to .cer file
$mycert | Export-Certificate -FilePath mycert.cer
```

{% endcode %}

### Register the Self-Signed Certificate

The next step is to upload the certificate to the Azure application.

1. In the left navigation menu of the GuardWare M365 Monitor application page, click **Certificates & secrets**.

<div align="left"><img src="https://content.gitbook.com/content/SrTJQs663dZ9Te4UU3O8/blobs/RygQHyDG02RjWbJcPgdb/Certificates%20&amp;%20Secrets%20button.png" alt="" width="563"></div>

2. Under **Certificates,** click **Upload certificate**.

<div align="left"><img src="https://content.gitbook.com/content/SrTJQs663dZ9Te4UU3O8/blobs/N9iY7i4Xxw7qlGDRpGhP/Upload%20certificate%20button.png" alt="" width="563"></div>

3. Select the `mycert.cer` file to upload and enter a description.
4. Click **Add**.

   <div align="left"><img src="https://content.gitbook.com/content/SrTJQs663dZ9Te4UU3O8/blobs/OIjRylfsxnXtoX5aOntD/uploading%20certificate%20new.png" alt="" width="375"></div>

Once successfully uploaded, the certificate will appear in the list of certificates associated with the application.

### Grant Permissions to the Application

Microsoft Graph API permissions and Exchange Online API permissions are needed for GuardWare INSIGHT to access user, group, and mailbox information for monitoring and analysis.

#### **Grant Microsoft Graph API Permissions**

To grant Microsoft Graph API Permissions:

1. In the left navigation menu of the **GuardWare M365 Monitor** page, click **API Permissions**.

<div align="left"><img src="https://content.gitbook.com/content/SrTJQs663dZ9Te4UU3O8/blobs/PknfACgrk5AdldeoQrzJ/API%20Permission%20button.png" alt="" width="188"></div>

1. Click **+ Add a permission**. The *Request API permissions* panel opens on the right-hand side

<div align="left"><img src="https://content.gitbook.com/content/SrTJQs663dZ9Te4UU3O8/blobs/J8Xy4SMXXhmF4kJ5VZ94/API%20Permission%20%20%20Add%20permission%20button.png" alt="" width="563"></div>

3. Under the **Microsoft APIs** tab, click **Microsoft Graph**.

<div align="left"><img src="https://content.gitbook.com/content/SrTJQs663dZ9Te4UU3O8/blobs/Kcngv8R54FBxwHp2pEEn/API%20Permission%20Microsoft%20Graph%20button.png" alt="" width="375"></div>

4. Click **Application permissions**.

<div align="left"><img src="https://content.gitbook.com/content/SrTJQs663dZ9Te4UU3O8/blobs/DDis4BWXHskWuS4FwQUq/API%20Permission_Application%20permissions.png" alt="" width="375"></div>

5. From the list of permissions, expand the categories or search and select the following permissions:
   1. `Group.Read.All`
   2. `GroupMember.Read.All`
   3. `User.Read.All`
   4. `Mail.Read`
   5. `Mail.ReadBasic.All`
6. Click **Add permissions**.
7. Once added, click **Grant admin consent for \<your organisation>** to approve the permissions. You must be signed in to the Azure Portal using an administrator account to grant admin consent.

<div align="left"><img src="https://content.gitbook.com/content/SrTJQs663dZ9Te4UU3O8/blobs/Q5jcfVXPajQdvE7DEGVB/grant%20admin%20consent.png" alt="" width="563"></div>

#### Grant Exchange Online API Permission

To grant Exchange Online API permission:

1. In the **API Permissions** page, click **+ Add a permission**. The *Request API permissions* panel opens on the right-hand side.

<div align="left"><figure><img src="https://1102323068-files.gitbook.io/~/files/v0/b/gitbook-x-prod.appspot.com/o/spaces%2FSrTJQs663dZ9Te4UU3O8%2Fuploads%2FLmvWA0y0eVgQIOOUQz7b%2Fimage.png?alt=media&amp;token=364aa8d2-ee62-421d-a410-dd9dba1a1159" alt="" width="563"><figcaption></figcaption></figure></div>

2. In the *Request API permissions* panel, select the **APIs my organisation uses** tab.
3. Search for **Office 365 Exchange Online**.
4. Click **Office 365 Exchange Online** from the search results to view its available permissions.

<div align="left"><img src="https://content.gitbook.com/content/SrTJQs663dZ9Te4UU3O8/blobs/8WqVcDpPp7LY9WXj4iro/Office%20365%20Exchange%20Online.png" alt="" width="563"></div>

5. Under **Exchange**, select the `Exchange.ManageAsApp` permission.

<div align="left"><img src="https://content.gitbook.com/content/SrTJQs663dZ9Te4UU3O8/blobs/PkVAtQTjl9U774K8XHHx/Exchange.ManageAsApp.png" alt="" width="563"></div>

6. Click **Add permissions** to complete the process.

#### Grant Office 365 Management API Permissions (Required for SharePoint)

SharePoint log collection requires permissions from the **Office 365 Management APIs**.

To grant these permissions:

1. In the left navigation menu of the **GuardWare M365 Monitor** page, click **API Permissions**.
2. Click **+ Add a permission**. The *Request API permissions* panel opens on the right-hand side.

<div align="left"><figure><img src="https://1102323068-files.gitbook.io/~/files/v0/b/gitbook-x-prod.appspot.com/o/spaces%2FSrTJQs663dZ9Te4UU3O8%2Fuploads%2F1hqxQ1ofQRKlxyfDB9nH%2Fimage.png?alt=media&amp;token=5ec361b1-c144-4969-91c5-e6392b268c0b" alt="" width="563"><figcaption></figcaption></figure></div>

3. Under the **Microsoft APIs** tab, click **Office 365 Management APIs**.

<div align="left"><figure><img src="https://1102323068-files.gitbook.io/~/files/v0/b/gitbook-x-prod.appspot.com/o/spaces%2FSrTJQs663dZ9Te4UU3O8%2Fuploads%2FQsce7WGQQBZ9B507JjLO%2Fimage.png?alt=media&amp;token=96b4f43b-655e-435c-988a-3daeed96b5a9" alt="" width="375"><figcaption></figcaption></figure></div>

4. In *Request API permissions*, click **Application permissions**.

<div align="left"><figure><img src="https://1102323068-files.gitbook.io/~/files/v0/b/gitbook-x-prod.appspot.com/o/spaces%2FSrTJQs663dZ9Te4UU3O8%2Fuploads%2FUonBmtydrv7uEfuY8Wfs%2Fimage.png?alt=media&amp;token=3451c6c9-6cb8-4331-a458-2e7cdbff121d" alt="" width="328"><figcaption></figcaption></figure></div>

5. From the list of available permissions, select the following:
   1. `ActivityFeed.Read`
   2. `ServiceHealth.Read`
6. Click **Add permissions**.

<div align="left"><figure><img src="https://1102323068-files.gitbook.io/~/files/v0/b/gitbook-x-prod.appspot.com/o/spaces%2FSrTJQs663dZ9Te4UU3O8%2Fuploads%2FugYDtrpugMrkt8ypUZ6g%2Fimage.png?alt=media&amp;token=6e9b6009-4ca0-4808-a57b-a81b941a56ba" alt="" width="480"><figcaption></figcaption></figure></div>

7. Once added, click **Grant admin consent for \<your organisation>** to approve the permissions. You must be signed in to the Azure Portal using an administrator account to grant admin consent.

<div align="left"><figure><img src="https://1102323068-files.gitbook.io/~/files/v0/b/gitbook-x-prod.appspot.com/o/spaces%2FSrTJQs663dZ9Te4UU3O8%2Fuploads%2FhpWcH73XOPMXeb5lHbId%2Fimage.png?alt=media&amp;token=a5ad2cbf-027e-4512-bd04-b36b2f2a69f8" alt="" width="563"><figcaption></figcaption></figure></div>

### Assign Role to the Application

After configuring permissions, assign the necessary **Microsoft Entra roles** to the GuardWare M365 Monitor application. To ensure GuardWare INSIGHT can access the required Microsoft 365 data, specific administrative roles must be assigned to the registered application.

To assign roles to the application:

1. In the **Azure portal**, navigate to **Microsoft Entra ID** and click **Roles and administrators or** use the search bar to find and select **Microsoft Entra Roles and Administrators**.
2. To assign the Exchange Administrator Role:
   1. On the **All roles** page, search for **Exchange Administrator** and click the role name.\
      **Do not select the checkbox** next to the role. If the role is selected, you will not be able to add assignments.

      <div align="left"><img src="https://1102323068-files.gitbook.io/~/files/v0/b/gitbook-x-prod.appspot.com/o/spaces%2FSrTJQs663dZ9Te4UU3O8%2Fuploads%2FoKZb3ZuWNRIjQA66Ebq6%2FExchange%20Administrator.png?alt=media&amp;token=d55eb7df-5bbd-4cf9-a638-06f36a47f31a" alt=""></div>
   2. Click **Add assignments**.
   3. In the search field, enter the name of the application created earlier (for example, *GuardWare M365 Monitor*).
   4. Select the application and click **Add** to assign the role.
3. To assign the Compliance Administrator Role:
   1. Return to the **All Roles** page. Search and click **Compliance Administrator**.\
      **Do not select the checkbox** next to the role. If the role is selected, you will not be able to add assignments.
   2. Click **Add assignments**.
   3. Search for the same application name (for example, *GuardWare M365 Monitor*).
   4. Select the application and click **Add** to complete the role assignment.

### Create a Security Group of Emails to Be Monitored

A dedicated security group helps define which user mailboxes will be monitored by GuardWare INSIGHT.

To create a security group that includes the email accounts to be monitored:

1. Log in to the [Microsoft 365 admin center](https://admin.microsoft.com/) as an administrator.
2. Navigate to **Teams & Groups > Active Teams & Groups**, and select the **Security groups** tab.
3. Click **+ Add a security group**.

![](https://content.gitbook.com/content/SrTJQs663dZ9Te4UU3O8/blobs/TMbHZemYp6VhTytU5g3L/image%2020251016%20083819.png)

4. Enter the **Name** and **Description** for the security group and click **Next**.
5. Click **Create group**, and once the group is created, click **Close**. The new security group may take a few seconds to appear in the list.
6. Click the newly created security group to open it.
7. Click **Members > View all and manage members > Add members**.
8. Add the users (email accounts) you want to include in the monitored group.

### Getting the Organisation’s Primary Domain

The organisation’s primary domain is required for integration with GuardWare INSIGHT.

To find your organisation’s primary domain in Azure:

1. Log in to the [**Azure Portal**](https://portal.azure.com/).
2. Search for **Domain names**, and select **Domain Names** from the results.

<div align="left"><img src="https://content.gitbook.com/content/SrTJQs663dZ9Te4UU3O8/blobs/tZDA6AU7tRtSSv28IXEe/Domain%20names.png" alt="" width="563"></div>

3. Locate the domain that ends with `.onmicrosoft.com`.

<div align="left"><img src="https://content.gitbook.com/content/SrTJQs663dZ9Te4UU3O8/blobs/1pCgEzm39ts8zxKNXdVj/custom%20domain%20name.png" alt="" width="563"></div>

4. Copy the domain name; this is your organisation’s **primary domain**.

### Information to Be Sent to GuardWare

After completing all configuration steps, send the following details to **GuardWare Support** to complete the Microsoft 365 setup:

1. **Application (Client) ID**
2. **Directory (Tenant) ID**
3. **On-Premises Domain Name**
4. **Certificate (.pfx file)** and its **Password**
5. **Monitored Security Group**
6. **Organisation Primary Domain**

{% hint style="info" %}
Ensure that the certificate password is shared securely and only with authorised GuardWare representatives.
{% endhint %}


# Set Up Cloud Monitor (Automated)

Cloud Monitor monitors user activities, such as sharing or downloading files and links, on your organisation’s Microsoft 365 environment, including Exchange Online and SharePoint Online.

An **Azure Global Administrator** account is required to set up Cloud Monitor.

Cloud Monitor uses a registered Azure application and certificate-based authentication to securely access activity data from Microsoft 365. These data are then analysed within GuardWare INSIGHT to provide dashboards, alerts, and reports on cloud usage and potential security incidents.

It monitors key cloud events such as:

* Files accessed or downloaded from sensitive libraries
* Access and download actions by anonymous, invited, or mobile users
* Files accessed via links shared on Teams
* Creation of anonymous links and external file access activities
* SharePoint file access, download, and link creation activities
* Outgoing Microsoft 365 emails

**To set up Cloud Monitor:**

1. Log in to the GuardWare INSIGHT Management Console.
2. Click **Open Management Console**.

<div align="left"><figure><img src="https://content.gitbook.com/content/SrTJQs663dZ9Te4UU3O8/blobs/Xb2ZpAPFNUY16Es7CIui/Unknown%20image" alt="" width="563"><figcaption></figcaption></figure></div>

3. Navigate to **Organisation** and click **Cloud Monitor Setup**.

<div align="left"><figure><img src="https://content.gitbook.com/content/SrTJQs663dZ9Te4UU3O8/blobs/Cob5Rr3SjN5BgLzlJ0dK/Unknown%20image" alt="" width="563"><figcaption></figcaption></figure></div>

4. Click **Setup**. You’ll be asked to sign in with a Microsoft account.
5. Sign in with your **Azure Global Administrator** account. Once authenticated, the system automatically performs all necessary Azure configurations, including:
   1. Registering the GuardWare Cloud Monitoring Application in Azure
   2. Generating and uploading the required **certificates**
   3. Assigning the appropriate **permissions** and **roles**
   4. Storing the credentials (Client ID, Tenant ID, Domain, and Certificate details) securely in the database
6. After the application is registered, click **Next**. You’ll be asked to sign in again.\
   The first sign-in registers the application in Azure, and the second allows you to select the security group to monitor.\
   &#x20;

   <div align="left"><figure><img src="https://content.gitbook.com/content/SrTJQs663dZ9Te4UU3O8/blobs/mAeqtjqEUC8RleF2ZWtb/Unknown%20image" alt="" width="375"><figcaption></figcaption></figure></div>
7. Select a Security Group you want Cloud Monitor to monitor and click **Save**. You can update or change this group later if needed.\
   &#x20;

   <div align="left"><figure><img src="https://content.gitbook.com/content/SrTJQs663dZ9Te4UU3O8/blobs/x99ovlNQ4BJho0gWoK24/Unknown%20image" alt="" width="375"><figcaption></figcaption></figure></div>

Once the setup is complete, Cloud Monitor starts monitoring cloud activities, which are then displayed in INSIGHT dashboards, reports, and alerts.


# Configuration for Microsoft SSO Login

You can log in to GuardWare INSIGHT using Single Sign-On (SSO) via Microsoft Azure, removing the need for separate credentials.&#x20;

However, before using Microsoft SSO, an Azure administrator **must configure** the consent settings in the Microsoft Azure Portal to allow users to authenticate through Azure.

**To configure the consent settings:**

1. Log in to the [**Azure Portal**](https://portal.azure.com/) using an administrator account.
2. Navigate or search for **Enterprise applications**.&#x20;
3. Under **Manage**, click **User settings** and click **consent and permissions**.<br>

   <figure><img src="https://1102323068-files.gitbook.io/~/files/v0/b/gitbook-x-prod.appspot.com/o/spaces%2FSrTJQs663dZ9Te4UU3O8%2Fuploads%2FiiEmQSjYSQ7n2bjr7RK2%2FUser%20settings.png?alt=media&amp;token=d308316c-95f7-4b37-b9f3-da74b552e746" alt=""><figcaption></figcaption></figure>
4. Under **User consent settings**, select **Let Microsoft manage your consent settings (Recommended)** and click **Save**. <br>

   <figure><img src="https://1102323068-files.gitbook.io/~/files/v0/b/gitbook-x-prod.appspot.com/o/spaces%2FSrTJQs663dZ9Te4UU3O8%2Fuploads%2F9WUmxj6Bxmjcw0FMqBUq%2FUser%20consent%20settings.png?alt=media&amp;token=fbdad9d2-4325-416e-80b0-47f9f354fd0a" alt=""><figcaption></figcaption></figure>

This setting allows Microsoft to automatically manage consent permissions for enterprise applications. Once enabled, users can authenticate with their Microsoft accounts on the GuardWare INSIGHT login screen. &#x20;

## Log In Using Microsoft

Click **Microsoft** on the login screen, and you will be redirected to the Azure authentication page for secure login. Once authenticated, your session is created automatically and remains active until the Azure token expires or you log out.&#x20;

<figure><img src="https://1102323068-files.gitbook.io/~/files/v0/b/gitbook-x-prod.appspot.com/o/spaces%2FSrTJQs663dZ9Te4UU3O8%2Fuploads%2Fjx6lYrRrdTV0qFUaaorK%2FSSO%20button.png?alt=media&amp;token=03e97f90-0894-4d6b-8133-831720f6d600" alt="" width="223"><figcaption></figcaption></figure>


# GuardWare Components

GuardWare INSIGHT uses several core components that work together on each endpoint to monitor activity, protect data, enforce policies, and keep PCs connected to the Server.&#x20;

This page explains what each component does and how to enable and disable drivers and proxy.

## Drivers

Drivers operate at the system level on the device. They monitor specific activities and help INSIGHT apply security and monitoring rules.

1. **GWChatDocMon**: Monitors activity in supported chat applications. It captures files shared through chat and sends them for inspection based on configured policies. It also handles scenarios such as double encryption during file transfers.
2. **GWUsbMon**: Monitors file transfers to and from USB devices. It captures the files being transferred and sends the relevant data for further processing, supporting data loss prevention (DLP) use cases.
3. **GWScanner**: Monitors USB activity from a productivity perspective. It detects connected USB devices, captures details such as serial numbers, and tracks usage, including devices already connected.
4. **GWPG**: Monitors and manages process-level activity related to device interactions, including USB operations, to ensure controlled execution and enforcement of policies.
5. **GWDogFile**: Protects INSIGHT client files and components. It prevents unauthorised renaming, modification, or deletion of critical client files to maintain system integrity.
6. **GWWFP.sys**: Monitors network traffic at the system level. It inspects both standard and SSL/TLS-encrypted traffic (where supported) to detect sensitive information based on configured policies. This enables real-time visibility and control over data transmitted across applications and network connections, supporting data loss prevention (DLP) and network monitoring.

## GWClient

GWClient acts as the primary communication layer between the endpoint and the INSIGHT server.

* Establishes and maintains communication between the server and the endpoint.
* Downloads and applies policies, user settings, and configuration updates from the server.
* Sends system status, logs, and activity data back to the server.
* Handles commands from the server, such as policy updates or actions.
* Maintains handshake status (for example, whether endpoints are online).
* Updates local configurations, including registry settings, and distributes them to other components.

## GWW (Watcher)

GWW monitors user activity on the endpoint and acts as an intermediary between drivers and higher-level processing components.

* Monitors activities such as typing, file access, viewing, and printing.
* Detects sensitive data usage based on configured keywords or policies.
* Receives input from drivers and forwards it to the processing engine (engine DLL).
* Coordinates with other components to enforce policies based on detected activity.

## GWProxy

GWProxy monitors network-level activity on the endpoint.

* Tracks network traffic generated by applications.
* Enables inspection and control of data being transmitted over the network.
* Supports the enforcement of policies related to web and network usage.

These components work together to provide endpoint monitoring, data protection, and policy enforcement within GuardWare INSIGHT.

## Enable or Disable Drivers

You can enable or disable specific drivers based on your organisation’s requirements.

{% hint style="warning" %}
Disable drivers only when required, such as troubleshooting system or application issues, resolving compatibility problems, or testing performance.&#x20;

Disabling drivers can reduce monitoring and control capabilities, so disable only the required driver.&#x20;
{% endhint %}

1. Log in to the INSIGHT Management Console.&#x20;
2. Navigate to **PC Group** and right-click the required PC.
3. Click **Advance Settings > Driver Options**.<br>

   <figure><img src="https://1102323068-files.gitbook.io/~/files/v0/b/gitbook-x-prod.appspot.com/o/spaces%2FSrTJQs663dZ9Te4UU3O8%2Fuploads%2FO5RwDJfx3QTelS5qU6Tc%2FDriver%20option.png?alt=media&amp;token=ba07bd2e-9837-4eb4-ac39-0b4b0a0d4e9f" alt=""><figcaption></figcaption></figure>
4. Enable or disable the required driver. \
   ![](https://1102323068-files.gitbook.io/~/files/v0/b/gitbook-x-prod.appspot.com/o/spaces%2FSrTJQs663dZ9Te4UU3O8%2Fuploads%2FxtihxNyYvCRwWrlS4YTh%2FEnable%20Disable%20driver.png?alt=media\&token=928cbc39-8123-4218-93c2-e24ca63b7531)
5. Click **Submit**.

## Enable or Disable Proxy

You can enable or disable proxy monitoring, or switch between available modes based on your deployment and monitoring requirements.&#x20;

{% hint style="warning" %}
Disable Proxy only when required, such as during troubleshooting network or connectivity issues, resolving conflicts with network-level tools, or when network monitoring is not needed.&#x20;

Disabling Proxy stops traffic monitoring and enforcement, so it should be done with caution.
{% endhint %}

1. Log in to the INSIGHT Management Console.&#x20;
2. Navigate to **PC Group** and right-click the required PC.
3. Click **Advance Settings > Proxy Status**.<br>

   <figure><img src="https://1102323068-files.gitbook.io/~/files/v0/b/gitbook-x-prod.appspot.com/o/spaces%2FSrTJQs663dZ9Te4UU3O8%2Fuploads%2FiCto9ew31rYIT3QVL2Wz%2FProxy%20Status.png?alt=media&amp;token=2e2cd43c-ee34-4eae-8c5f-01f8ebc14b31" alt=""><figcaption></figcaption></figure>
4. Select the required option:
   * **LSP**: Enables proxy using Layered Service Provider for traffic interception.
   * **WFP**: Enables proxy using Windows Filtering Platform.
   * **Off**: Disables proxy monitoring.\
     ![](https://1102323068-files.gitbook.io/~/files/v0/b/gitbook-x-prod.appspot.com/o/spaces%2FSrTJQs663dZ9Te4UU3O8%2Fuploads%2F8SS5UakFJoHiH9VRiRsf%2Fproxy%20off.png?alt=media\&token=a85d7cd6-9d62-4dc1-97c4-19d6e527023f)
5. Click **Submit**.


# INSIGHT Dashboard

GuardWare INSIGHT includes the following predefined dashboards:

1. [Risks Summary Dashboard](#risks-summary-dashboard)
2. [General Dashboard](#general-dashboard)
3. [Risks Dashboard](#risks-dashboard)
4. [SharePoint Dashboard](#sharepoint-dashboard)
5. [AI Usage Dashboard](#ai-usage-dashboard)

These dashboards provide a clear and interactive view of your organisation’s overall data landscape, highlighting user activity, file movements, and potential risks in one place.

Each dashboard includes widgets that provide real-time visibility into data usage patterns through charts, graphs, and tables, helping administrators track trends, detect unusual behaviour, and keep sensitive information secure. You can export a dashboard widget’s data to **PDF or Excel** by clicking the respective icons in the top-right corner of the widget.

You can also create **custom dashboards** and choose the widgets according to your requirements. For details on creating custom dashboards, see[ Create Custom Dashboards](#create-custom-dashboards).

## Risk Levels

Each activity category in the dashboard is assigned a risk level that indicates the severity of detected activities:

<table><thead><tr><th width="145">Risk Level</th><th width="117">Colour Indicator</th><th>Description</th></tr></thead><tbody><tr><td>No Risk</td><td>🟩 <strong>Green</strong></td><td>No unusual or unauthorised activity detected. These include routine activities within corporate policy.</td></tr><tr><td>Low Risk</td><td>🟦 <strong>Blue</strong></td><td>Minor or low-impact activities that slightly deviate from standard policy but pose minimal threat, such as occasional access from non-corporate networks.</td></tr><tr><td>Medium Risk</td><td>🟨 <strong>Yellow</strong></td><td>Actions that may require review, such as occasional file transfers to external sites.</td></tr><tr><td>High Risk</td><td>🟥 <strong>Red</strong></td><td>Activities that indicate potential misuse or data breaches, such as unauthorised data sharing or file copying to external drives.</td></tr></tbody></table>

Risk levels are automatically determined based on the nature of the data involved and policy rules configured in the INSIGHT Management Console.

## **Risks Summary Dashboard**

The Risks Summary Dashboard provides an overview of key security and data protection indicators across your organisation. It displays critical activities such as file sharing, data transfers, email usage, and device interactions, helping you identify potential risks and monitor sensitive information in real time.

This dashboard is particularly useful for executives and security managers who need a quick summary of data-related risks without navigating through detailed reports.

You can access the Risks Summary Dashboard from the Dashboard section in the GuardWare INSIGHT Management Console.

<figure><img src="https://content.gitbook.com/content/SrTJQs663dZ9Te4UU3O8/blobs/CX33ELdqk0D8f4ivASel/INSIGHT_Risks_Summary.png" alt="" width="563"><figcaption></figcaption></figure>

Each widget in this dashboard displays the following:

1. Activities related to various categories like SharePoint, File and data transfer, file upload, usage of AI tools, non-corporate websites and applications, and so on.
2. The total number of users involved in specific activities or incidents during the specific period.
3. The total number of incidents recorded for each monitored category. (for example, how many files were downloaded).
4. Risk levels for each activity category.

### Widgets in Risks Summary Dashboard

<table data-header-hidden><thead><tr><th width="246.79998779296875"></th><th></th></tr></thead><tbody><tr><td><strong>Category</strong></td><td><strong>Widget Name</strong></td></tr><tr><td><strong>SharePoint Activities</strong></td><td><a href="#id-1.-external-sharepoint-events">External SharePoint Events</a></td></tr><tr><td></td><td><a href="#id-2.-internal-sharepoint-events">Internal SharePoint Events</a></td></tr><tr><td><strong>Email Activities</strong></td><td><a href="#id-3.-email-activities">Email Activities</a></td></tr><tr><td><strong>Data Transfers</strong></td><td><a href="#id-4.-data-transfer-using-non-corporate-websites">Data Transfer Using Non-Corporate Websites</a></td></tr><tr><td></td><td><a href="#id-5.-file-uploads-to-non-corporate-file-sharing-applications">File Uploads to Non-Corporate File-Sharing Applications</a></td></tr><tr><td><strong>Device Usage</strong></td><td><a href="#id-6.-storage-device-risk">Storage Device Risk</a></td></tr><tr><td></td><td><a href="#id-7.-printing-incidents">Printing Incidents</a></td></tr><tr><td></td><td><a href="#id-8.-access-of-documents-on-local-devices">Access of Documents on Local Devices</a></td></tr><tr><td><strong>Behavioural Monitoring</strong></td><td><a href="#id-9.-key-stroke-capture-of-monitored-phrases">Key Stroke Capture of Monitored Phrases</a></td></tr><tr><td></td><td><a href="#id-10.-usage-of-ai-tools">Usage of AI Tools</a></td></tr><tr><td></td><td><a href="#id-11.-usage-of-non-corporate-websites">Usage of Non-Corporate Websites</a></td></tr><tr><td></td><td><a href="#id-12.-usage-of-non-corporate-applications">Usage of Non-Corporate Applications</a></td></tr></tbody></table>

#### **1. External SharePoint Events**

This widget helps you track how files are accessed and shared by users outside your organisation, such as partners, vendors, or contractors. It highlights activities such as access or downloads from sensitive libraries, actions by anonymous or invited users, access from mobile devices, and file interactions through links shared on Teams.

![](https://content.gitbook.com/content/SrTJQs663dZ9Te4UU3O8/blobs/9BALhH3m1H3cn03G7Wqf/INSIGHT_Risks_Summary_External_SharePoint_Events.png)

Click a specific record to view detailed information, including the username, email address, file name, incident date and time, file path, expiry date, and URL. Use the search box at the top to quickly filter specific information.

![](https://content.gitbook.com/content/SrTJQs663dZ9Te4UU3O8/blobs/XpjwNyU2OS8f25Nmqhfe/INSIGHT_Risks_Summary_External_SharePoint_Drilldown.png)

#### **2. Internal SharePoint Events**

This widget helps you track how files are accessed and shared by users within your organisation. It shows who has viewed, modified, or shared files across SharePoint, highlighting activities such as link creation for anonymous users, access to sensitive libraries, downloads from mobile devices, and file access through links shared on Teams.

![](https://content.gitbook.com/content/SrTJQs663dZ9Te4UU3O8/blobs/wUnP1fZ0SvvKynZURA0G/INSIGHT_Risks_Summary_Internal_SharePoint_Events.png)

Click a specific record to view detailed information, including the username, email address, file name, incident date and time, file path, expiration date, and URL. Use the search box at the top to quickly filter specific information.

![](https://content.gitbook.com/content/SrTJQs663dZ9Te4UU3O8/blobs/XmPGbCgSl2XIWdu1FmPF/INSIGHT_Risks_Summary_Internal_SharePoint_Drilldown.png)

#### **3. Email Activities**

This widget provides an overview of email usage patterns across your organisation, helping you monitor how attachments and sensitive information are shared through corporate email channels. It tracks email attachments sent from corporate to non-corporate domains, as well as emails sent to insecure, personal, or internal corporate addresses, and attachments shared from non-corporate email accounts.

![](https://content.gitbook.com/content/SrTJQs663dZ9Te4UU3O8/blobs/2EcxZKOEgutD9RPrHSXa/INSIGHT_Risks_Summary_Email_Activities.png)

Click a specific record to view detailed information, including the username, date and time, sender and recipient addresses, subject, and file name. Use the Arrow icon in the **Action** column to further drill down into details, and use the search box at the top to quickly filter specific information.

![](https://content.gitbook.com/content/SrTJQs663dZ9Te4UU3O8/blobs/TMwwFO1sAcynn3wjhTs8/INSIGHT_Risks_Summary_Email_Activities_Drilldown.png)

#### **4. Data Transfer using Non-Corporate Websites**

This widget helps you track file uploads or transfers made to non-corporate websites, such as public file-sharing services or personal cloud storage platforms. It helps you detect and prevent potential data leaks by identifying instances where sensitive files may have been transferred outside secure corporate networks.

![](https://content.gitbook.com/content/SrTJQs663dZ9Te4UU3O8/blobs/LsAwEexP6aw00PMua2QT/INSIGHT_Risks_Summary_%20Non_Corporate_Websites.png)

Click a specific record to view detailed information, including the username, PC name, file name, software used, website URL, and the date and time of the violation. Use the Arrow icon in the **Action** column to further drill down into details, and use the search box at the top to quickly filter specific information.

![](https://content.gitbook.com/content/SrTJQs663dZ9Te4UU3O8/blobs/njgsHrols96J6gZ4iU8U/INSIGHT_Risks_Summary_%20Non_Corporate_Websites_Drilldown1.png)

![](https://content.gitbook.com/content/SrTJQs663dZ9Te4UU3O8/blobs/xjEg3gao0QOab0wbrC0L/INSIGHT_Risks_Summary_%20Non_Corporate_Websites_Drilldown2.png)

#### **5. File Uploads to Non-Corporate File Sharing Applications**

This widget helps you track files uploaded through applications like Dropbox, or Google Drive that are not managed under your organisation’s approved corporate accounts. Frequent uploads to these applications can indicate an attempt to bypass corporate storage policies or move confidential data to personal accounts.

![](https://content.gitbook.com/content/SrTJQs663dZ9Te4UU3O8/blobs/cGEV6RfrMzDigoH44tpe/INSIGHT_Risks_Summary_File_Upload_NonCorporate_File_Sharing.png)

Click a specific record to view detailed information, including the username, file name, file path, application name, and violation date and time. Use the Arrow icon in the **Action** column to further drill down into details, and use the search box at the top to quickly filter specific information.

![](https://content.gitbook.com/content/SrTJQs663dZ9Te4UU3O8/blobs/SkKwJV8lJqVB9HZWTabE/INSIGHT_Risks_Summary_File_Upload_NonCorporate_File_Sharing_App_drilldown2.png)

#### **6. Storage Device Risk**

This widget helps you track files copied or moved to portable storage devices such as USB drives or external hard disks, along with the users who performed these actions. Because these transfers are often offline and unmonitored, this widget helps mitigate risks of data theft or accidental exposure through removable media.

![](https://content.gitbook.com/content/SrTJQs663dZ9Te4UU3O8/blobs/j8eBjdGhHJ9q4CUkwADa/INSIGHT_Risks_Summary_Storage_Device_Risk.png)

Click a specific record to view detailed information, including the username, file name, file path, transfer means, PC name, and violation date and time. Use the Arrow icon in the **Action** column to further drill down into details, and use the search box at the top to quickly filter specific information.

![](https://content.gitbook.com/content/SrTJQs663dZ9Te4UU3O8/blobs/IFBV0e9Npb145NQI8X54/INSIGHT_Risks_Summary_Storage_Device_Risk_drilldown.png)

#### **7. Printing Incidents**

This widget helps you track files printed using non-corporate or unauthorised printers. It provides visibility into printing activities that may lead to hard-copy data leaks.

![](https://content.gitbook.com/content/SrTJQs663dZ9Te4UU3O8/blobs/hcsChnRHqcHUdSBHvybC/INSIGHT_Risks_Summary_Printing_Incidents.png)

Click a specific record to view detailed information, including the username, file name, file path, printer name, PC name, and violation date and time. Use the Arrow icon in the **Action** column to further drill down into details, and use the search box at the top to quickly filter specific information.

![](https://content.gitbook.com/content/SrTJQs663dZ9Te4UU3O8/blobs/4FT7PcZRGoztHQYpa6Hw/INSIGHT_Risks_Summary_Printing_Incidents_drilldown.png)

#### **8. Access of Documents on Local Devices**

This widget helps you track when Office documents, such as Word, Excel, or PowerPoint files, are opened on local devices. Tracking local document access helps ensure files are viewed only by authorised users and assists in identifying unusual access outside regular working patterns.

![](https://content.gitbook.com/content/SrTJQs663dZ9Te4UU3O8/blobs/XvqQRyUoZSE33bAu1CcI/INSIGHT_Risks_Summary_Documents_on_Local_Device.png)

Click a specific record to view detailed information, including the username, file name, file path, PC name, and violation date and time. Use the Arrow icon in the **Action** column to further drill down into details, and use the search box at the top to quickly filter specific information.

![](https://content.gitbook.com/content/SrTJQs663dZ9Te4UU3O8/blobs/5Ckm2UW9WvvGqTnpWpzH/INSIGHT_Risks_Summary_Documents_on_Local_Device_drilldown.png)

#### **9. Key Stroke Capture of Monitored Phrases**

This widget helps you detect specific keywords or phrases typed by users that match predefined monitoring criteria (for example, financial terms, project codes, or classified labels). It helps detect early signs of policy violations, insider threats, or attempts to exfiltrate sensitive data through manual entry or chat messages.

![](https://content.gitbook.com/content/SrTJQs663dZ9Te4UU3O8/blobs/AJr5D59hfhOFH1EO58Fq/INSIGHT_Risks_Summary_Key_Stroke_Capture.png)

Click a specific record to view detailed information, including the username, application name, PC name, and violation date and time. Use the Arrow icon in the **Action** column to further drill down into details, and use the search box at the top to quickly filter specific information.

![](https://content.gitbook.com/content/SrTJQs663dZ9Te4UU3O8/blobs/GIbx3ZJvhcu7byJ9mPNs/INSIGHT_Risks_Summary_Key_Stroke_Capture_drilldown.png)

#### **10. Usage Of AI Tools**

This widget helps you track any instance where corporate files are uploaded to AI-powered platforms such as ChatGPT and Copilot. These tools may inadvertently store or process sensitive information externally.

![](https://content.gitbook.com/content/SrTJQs663dZ9Te4UU3O8/blobs/7qiKSmjpVmaIkPSR3Gf7/INSIGHT_Risks_Summary_Usage_of_AI_Tools.png)

Click a specific record to view detailed information, including the username, application name, URL, PC name, and violation date and time. Use the Arrow icon in the **Action** column to further drill down into details, and use the search box at the top to quickly filter specific information.

![](https://content.gitbook.com/content/SrTJQs663dZ9Te4UU3O8/blobs/UzjXWMDFlUffIpoJHWvE/INSIGHT_Risks_Summary_Usage_of_AI_Tools_drilldown.png)

#### **11. Usage of Non-Corporate Websites**

This widget helps you track how much time users spend browsing or interacting with non-corporate websites. It helps identify productivity risks and potential exposure to untrusted domains.

![](https://content.gitbook.com/content/SrTJQs663dZ9Te4UU3O8/blobs/HpS2fDFUm2kjk0ePnOmq/INSIGHT_Risks_Summary_%20Usage_of_Non_Corporate_Websites.png)

Click a specific record to view detailed information, including the username, PC name, website source, total time spent on the website, and violation date. Use the search box at the top to quickly filter specific information.

![](https://content.gitbook.com/content/SrTJQs663dZ9Te4UU3O8/blobs/QMcigxC4SLKI2tHnq5Sb/INSIGHT_Risks_Summary_%20Usage_of_Non_Corporate_Websites_drilldown.png)

#### **12. Usage of Non-Corporate Applications**

This widget helps you monitor the use of unapproved applications that are not part of your organisation’s authorised software list. Frequent use of such tools can introduce vulnerabilities, create compliance risks, or bypass existing security controls.

![](https://content.gitbook.com/content/SrTJQs663dZ9Te4UU3O8/blobs/wy2mAE3SWH9dwHGNZpE3/INSIGHT_Risks_Summary_%20Usage_of_Non_Corporate_Applications.png)

Click a specific record to view detailed information, including the username, PC name, application source, total time spent on the application, and violation date. Use the search box at the top to quickly filter specific information.

![](https://content.gitbook.com/content/SrTJQs663dZ9Te4UU3O8/blobs/kjFmnv6so8cEZJCJgHpz/INSIGHT_Risks_Summary_%20Usage_of_Non_Corporate_Applications_drilldown.png)

## General Dashboard

The General Dashboard provides an overview of day-to-day user and system activities across your organisation. It helps you monitor how users interact with applications, websites, and files, and understand how data moves within your network.

You can use the General Dashboard for quick executive summaries and daily monitoring. This dashboard focuses on operational visibility, showing who is active, what they are doing, and how data is being accessed, shared, or transferred.

You can access the General Dashboard from the Dashboard section in the GuardWare INSIGHT Management Console.

![](https://content.gitbook.com/content/SrTJQs663dZ9Te4UU3O8/blobs/JvJswZsPLm7ZoV6xnwvr/INSIGHT_General.png)

### **Widgets in General Dashboard**

| **Category**                      | **Widget Name**                                                                                         |
| --------------------------------- | ------------------------------------------------------------------------------------------------------- |
| **System Activity**               | [PCs Online](#id-1.-pcs-online)                                                                         |
|                                   | [Users Online](#id-2.-users-online)                                                                     |
| **File Transfers & Applications** | [Application Transfer Summary](#id-3.-application-transfer-summary)                                     |
|                                   | [Application Transfer](#id-4.-application-transfers)                                                    |
|                                   | [Website Uploads Summary](#id-9.-website-uploads-summary)                                               |
|                                   | [Website Incidents](#id-10.-website-incidents)                                                          |
|                                   | [Storage Transfer Summary](#id-15.-storage-transfer-summary)                                            |
|                                   | [Storage Transfers](#id-16.-storage-transfers)                                                          |
| **Email & Web Communication**     | [Email Attachments Summary](#id-7.-email-attachments-summary)                                           |
|                                   | [Emailing of attachments from any email address](#id-8.-emailing-of-attachments-from-any-email-address) |
|                                   | [Email Body Summary](#id-11.-email-body-summary)                                                        |
|                                   | [Email Body](#id-12.-email-body)                                                                        |
|                                   | [Website Text Summary](#id-13.-website-text-summary)                                                    |
|                                   | [Website Text](#id-14.-website-text)                                                                    |
| **Printing & Document Access**    | [Printed Files Summary](#id-5.-printed-files-summary)                                                   |
|                                   | [Printed Files](#id-6.-printed-files)                                                                   |
|                                   | [Document Viewed Summary](#id-19.-document-viewed-summary)                                              |
|                                   | [Document View](#id-20.-document-view)                                                                  |
| **Data Loss Prevention (DLP)**    | [DLP Incidents Over Time](#id-21.-dlp-incidents-over-time)                                              |
|                                   | [DLP Incidents](#id-22.-dlp-incidents)                                                                  |
| **User Behaviour**                | [Keystrokes Summary](#id-17.-keystrokes-summary)                                                        |
|                                   | [Keystrokes](#id-18.-keystrokes)                                                                        |
|                                   | [Productivity](#id-23.-productivity)                                                                    |

#### **1. PCs Online**

This widget shows the total number of PCs that are active during the selected time period. It helps you monitor endpoint availability and determine which systems are active or inactive across the network.

![](https://content.gitbook.com/content/SrTJQs663dZ9Te4UU3O8/blobs/rJvoDtNWh4Wh1vDbcLdC/INSIGHT_General_PC_Online.png)

Click the widget to view detailed information, including the PC name, PC group, username, and last online time. Use the **Online** and **Offline** tabs to switch between active and inactive PCs, and use the search box at the top to quickly filter specific results.

![](https://content.gitbook.com/content/SrTJQs663dZ9Te4UU3O8/blobs/E7UChWFcQkkAZ8bu7bMb/INSIGHT_General_PC_Online_drilldown.png)

#### **2. Users Online**

This widget displays the total number of users who are **online** or **offline** within the selected time period. It helps you track user activity levels and session availability.

![](https://content.gitbook.com/content/SrTJQs663dZ9Te4UU3O8/blobs/CPrxrHcvONEph9UrblCJ/INSIGHT_General_User_Online.png)

Click the widget to view detailed information, including the username, user group, PC name, and last online time. Use the **Online** and **Offline** tabs to switch between active and inactive users, and use the search box at the top to quickly filter specific results.

![](https://content.gitbook.com/content/SrTJQs663dZ9Te4UU3O8/blobs/vJHHLSXouHQhcAlL3wTd/INSIGHT_General_User_Online_drilldown.png)

#### **3. Application Transfer Summary**

This widget summarises the total number of users and files transferred using applications or cloud-based services such as Dropbox, Google Drive, OneDrive, FileZilla, and WhatsApp. Clicking the widget takes you to the [Application Transfers](#id-4.-application-transfers) widget, where you can see more details.

![](https://content.gitbook.com/content/SrTJQs663dZ9Te4UU3O8/blobs/snIxnkBVQNOJ9PDUgsEK/INSIGHT_General_Application_transfer_summary.png)

#### **4. Application Transfers**

This widget helps you track policy violations detected during file transfers through specific applications. It provides visibility into tools, whether corporate-approved or not, being used to move data and users involved in moving the data, helping identify potential data-leakage channels or policy violations. You can filter the data by application name, rule, and user.

![](https://content.gitbook.com/content/SrTJQs663dZ9Te4UU3O8/blobs/tT5M3zvfGu0k9mRg5Q9X/INSIGHT_General_Application_transfer.png)

Click a specific record to view detailed information, including the application name, username, rule name, PC name, and the date and time of the violation.

![](https://content.gitbook.com/content/SrTJQs663dZ9Te4UU3O8/blobs/aiC2EEGMD2aZCjILMXdW/INSIGHT_General_Application_transfer_drilldown1.png)

Use the Arrow icon in the **Action** column to further drill down into details like **detected content in the application body**, transfer means, and so on. Use the search box at the top to quickly filter specific information.

![](https://content.gitbook.com/content/SrTJQs663dZ9Te4UU3O8/blobs/ngBplvdO7OrJtR7mukNq/INSIGHT_General_Application_transfer_drilldown2.png)

#### **5. Printed Files Summary**

This widget summarises the total number of files printed within your organisation, including the total number of users who initiated print jobs. Clicking the widget takes you to the [Printed Files](#id-6.-printed-files) widget, where you can see more details.

![](https://content.gitbook.com/content/SrTJQs663dZ9Te4UU3O8/blobs/19A6EDgKmZ7zBXq0zuA2/INSIGHT_General_Printed_Files_Summary.png)

#### **6. Printed Files**

This widget helps you track violations related to printing activities and identify potential data leaks through physical copies. It helps you identify unauthorised or excessive printing of sensitive or confidential documents and trace which users and devices were involved. You can filter the data by printer name, rule, and user.

![](https://content.gitbook.com/content/SrTJQs663dZ9Te4UU3O8/blobs/txtQwObQCmbhoog5Vc6L/INSIGHT_General_Printed_Files.png)

Click a specific record to view detailed information, including the username, printer name, rule name, PC name, file name, and the date and time of the violation. Use the Arrow icon in the **Action** column to further drill down into details like detected content in the print file, file path, and so on. Use the search box at the top to quickly filter specific information.

![](https://content.gitbook.com/content/SrTJQs663dZ9Te4UU3O8/blobs/kC4ptQBuMIBMymnp29IH/INSIGHT_General_Printed_Files_drilldown.png)

#### **7. Email Attachments Summary**

This widget shows the total number of email attachments sent via both corporate and non-corporate email accounts, including the total number of users who sent the attachment. Clicking the widget takes you to the [Emailing of Attachments from Any Email Address](#id-8.-emailing-of-attachments-from-any-email-address) widget, where you can see more details.

![](https://content.gitbook.com/content/SrTJQs663dZ9Te4UU3O8/blobs/32UlpKbRfCAlIkYnWg2F/INSIGHT_General_email_attachment_summary.png)

#### **8. Emailing of Attachments from Any Email Address**

This widget helps you track violations involving email attachments sent from any email account, including both corporate and non-corporate. It helps you identify when sensitive files are being shared externally and track which users are sending attachments that may violate your organisation’s policies. You can filter the data by email provider, violation rule, and user.

![](https://content.gitbook.com/content/SrTJQs663dZ9Te4UU3O8/blobs/3kWRqib84PXsETzFvECP/INSIGHT_General_email_of_attachment_from_any.png)

Click a specific record to view detailed information, including the email provider, username, rule name, the date and time of the violation, the name of the file that was shared, and the email subject. Use the Arrow icon in the **Action** column to further drill down into details like sender and receiver’s email address, and so on. Use the search box at the top to quickly filter specific information.

![](https://content.gitbook.com/content/SrTJQs663dZ9Te4UU3O8/blobs/Qohyn7aTGLhDrdDeDW2e/INSIGHT_General_email_of_attachment_from_any_drilldown.png)

#### **9. Website Uploads Summary**

This widget shows the total number of file uploads or transfers made to corporate and non-corporate websites, such as public file-sharing services or personal cloud storage platforms, including the total number of users who initiated the upload. Clicking the widget takes you to the [Website Incidents ](#id-10.-website-incidents)widget, where you can see more details.

![](https://content.gitbook.com/content/SrTJQs663dZ9Te4UU3O8/blobs/lp4IfV9CE9IF0tdd1Oc4/INSIGHT_General_Websites_upload_summary.png)

#### **10. Website Incidents**

This widget helps you detect and prevent potential data leaks by identifying websites where sensitive content was uploaded or shared. You can filter the data by URL, rule, and user.

![](https://content.gitbook.com/content/SrTJQs663dZ9Te4UU3O8/blobs/nkDuuUJqBOwwzMt92lZz/INSIGHT_General_website_incident.png)

Click a specific record to view detailed information, including the username, rule name, URL, the date and time of the violation, software used, and the name and path of the file uploaded. Use the Arrow icon in the **Action** column to further drill down into details like detected content in the website text, PC name, and so on. Use the search box at the top to quickly filter specific information.

![](https://content.gitbook.com/content/SrTJQs663dZ9Te4UU3O8/blobs/YsYbROcopfl4Eh9PwQie/INSIGHT_General_website_incident_drilldown.png)

#### **11. Email Body Summary**

This widget displays the total number of emails that violated content rules within the body of the message, including the total number of users who sent them. Clicking the widget takes you to the [Email Body](#id-12.-email-body) widget, where you can see more details.

![](https://content.gitbook.com/content/SrTJQs663dZ9Te4UU3O8/blobs/2M3nPXQvGBamiRhLuPmt/INSIGHT_General_email_body_summary.png)

#### **12. Email Body**

This widget helps you track details of emails containing restricted words, sensitive information, or policy breaches written directly in the message text. It helps you assess whether users are adhering to communication policies and prevent exposure of sensitive data through email. You can filter the data by email provider, rule, and user.

![](https://content.gitbook.com/content/SrTJQs663dZ9Te4UU3O8/blobs/UU4YUwo4nEtFUWvPYGmO/INSIGHT_General_email_body.png)

Click a specific record to view detailed information, including the email provider, username, rule name, URL, the date and time of the violation, and email subject. Use the Arrow icon in the **Action** column to further drill down into details like sender’s and receiver’s email, detected content in the email body, and so on. Use the search box at the top to quickly filter specific information.

![](https://content.gitbook.com/content/SrTJQs663dZ9Te4UU3O8/blobs/Ry0XzlQOU4VDxKUyc5GP/INSIGHT_General_email_body_drilldown.png)

#### **13. Website Text Summary**

This widget shows the total number of sensitive words or phrases posted on websites, along with the total number of users who posted them. Clicking the widget takes you to the [Website Text ](#id-14.-website-text)widget, where you can see more details.

![](https://content.gitbook.com/content/SrTJQs663dZ9Te4UU3O8/blobs/LXmsxbuuvbeMmw64qiZi/INSIGHT_General_Website_text_summary.png)

#### **14. Website Text**

This widget helps you track confidential or restricted text or phrases shared on websites or through online forms. You can filter the data by URL, rule, and user.

![](https://content.gitbook.com/content/SrTJQs663dZ9Te4UU3O8/blobs/pjpnEv1uaBryzKgrjA20/INSIGHT_General_website_text.png)

Click a specific record to view detailed information, including the username, rule name, URL, and the date and time of the violation. Use the Arrow icon in the **Action** column to further drill down into details like detected content in the website text, PC name, and so on. Use the search box at the top to quickly filter specific information.

#### **15. Storage Transfer Summary**

This widget displays the total number of files copied or transferred to USB drives or external storage devices, along with the total number of users who performed these actions. Clicking the widget takes you to the [Storage Transfers](#id-16.-storage-transfers) widget, where you can see more details.

![](https://content.gitbook.com/content/SrTJQs663dZ9Te4UU3O8/blobs/01gQzjeF4UKJ8mCQeLjE/INSIGHT_General_storage_transfer_summary.png)

#### **16. Storage Transfers**

This widget helps you track which users copied files and whether the transfers align with your organisation’s policies by providing a detailed view of files transferred to USB or external storage devices. It helps detect and prevent unauthorised offline data transfers or potential data leakage through removable media. You can filter the data by rule and user.

![](https://content.gitbook.com/content/SrTJQs663dZ9Te4UU3O8/blobs/0cTT8tDsuyc7WDzk0bez/INSIGHT_General_storage_transfers.png)

Click a specific record to view detailed information, including the username, rule name, PC name, file name, and the date and time of the violation. Use the Arrow icon in the **Action** column to further drill down into details like file path, transfer means, and so on. Use the search box at the top to quickly filter specific information.

![](https://content.gitbook.com/content/SrTJQs663dZ9Te4UU3O8/blobs/dPp4L28VKWYwTzIK3Ei4/INSIGHT_General_storage_transfers_drilldown.png)

#### **17. Keystrokes Summary**

This widget displays the total number of sensitive words or monitored phrases typed by users, including the total number of users who typed them. Clicking the widget takes you to the [Keystrokes ](#id-18.-keystrokes)widget, where you can see more details.

![](https://content.gitbook.com/content/SrTJQs663dZ9Te4UU3O8/blobs/WHqqybIVgO1P7Wytbrfo/INSIGHT_General_keysrokes_summary.png)

#### **18. Keystrokes**

This widget helps you track sensitive phrases typed by users. It helps you identify insider threats and monitor attempts to manually share confidential information in chat messages, documents, or forms. You can filter the data by application, rule, and user.

![](https://content.gitbook.com/content/SrTJQs663dZ9Te4UU3O8/blobs/930PKfv1YZa8mlNFzbhL/INSIGHT_General_keysrokes.png)

Click a specific record to view detailed information, including the application name, username, rule name, and the date and time of the violation. Use the Arrow icon in the **Action** column to further drill down into details. Use the search box at the top to quickly filter specific information.

![](https://content.gitbook.com/content/SrTJQs663dZ9Te4UU3O8/blobs/bZ9w8vc8iTXFioaDreuC/INSIGHT_General_keysrokes_drilldown.png)

#### **19. Document Viewed Summary**

This widget shows the total number of documents accessed or opened, along with the total number of users who viewed them. Clicking the widget takes you to the [Document View](#id-20.-document-view) widget, where you can see more details.

![](https://content.gitbook.com/content/SrTJQs663dZ9Te4UU3O8/blobs/jQ0mSwC2vwYrM6DJlcBI/INSIGHT_General_document_viewed_summary.png)

#### **20. Document View**

This widget helps you monitor document access patterns and ensure that confidential files are being viewed only by authorised users within authorised limits. You can filter the data by rule and user.

![](https://content.gitbook.com/content/SrTJQs663dZ9Te4UU3O8/blobs/573R6eTzEu71gfid8SI3/INSIGHT_General_document_view.png)

Click a specific record to view detailed information, including the username, rule name, PC name, file name, and the date and time of the violation. Use the Arrow icon in the **Action** column to further drill down into details. Use the search box at the top to quickly filter specific information.

![](https://content.gitbook.com/content/SrTJQs663dZ9Te4UU3O8/blobs/PsRucrlKx1z6IKBMeU7f/INSIGHT_General_document_view_drilldown.png)

#### **21. DLP Incidents Over Time**

This widget displays a trend graph of Data Loss Prevention (DLP) incidents over time. It helps you analyse how frequently violations occur in each monitored category, such as email, printing, storage and application transfers, website, document view, and keystrokes. You can filter the data by day, week, month, and quarter.

![](https://content.gitbook.com/content/SrTJQs663dZ9Te4UU3O8/blobs/3STXV5brBR8l7wCXTXz9/INSIGHT_General_%20DLP_Incidents_Over_Time.png)

#### **22. DLP Incidents**

This widget lists the total number of policy violations detected across all monitored rules on each monitored category, such as email, printing, storage and application transfers, website, document view, and keystrokes. It gives a consolidated view of where sensitive data breaches or unauthorised activities occurred.

![](https://content.gitbook.com/content/SrTJQs663dZ9Te4UU3O8/blobs/rBY9kjXtL6xjOpAMQz1I/INSIGHT_General_%20DLP_Incidents.png)

Click on a record to view detailed information about each violation on each monitored category. Use the Arrow icon in the **Action** column to further drill down into details. Use the search box at the top to quickly filter specific information.

![](https://content.gitbook.com/content/SrTJQs663dZ9Te4UU3O8/blobs/rvyZmLqylTiSOvDP3Nfm/INSIGHT_General_%20DLP_Incidents_drilldown.png)

#### **23. Productivity**

This widget shows time spent by users and user groups on productive, unproductive, or uncategorised applications and websites. These categories are configured in the GuardWare INSIGHT Management Console. It helps you evaluate how users spend their time and identify opportunities to improve efficiency.

![](https://content.gitbook.com/content/SrTJQs663dZ9Te4UU3O8/blobs/EsK3d25ksuOzJt1Igm5a/INSIGHT_General_Productivity.png)

Click on a specific group to view detailed information, including the username and time spent on the productive, unproductive, and uncategorised websites and applications.

![](https://content.gitbook.com/content/SrTJQs663dZ9Te4UU3O8/blobs/oo06hMg4aJKZF3ERQami/INSIGHT_General_Productivity_drilldown1.png)

You can filter the data by user, productive, unproductive, and uncategorised URL, and productive, unproductive, and uncategorised Application.

![](https://content.gitbook.com/content/SrTJQs663dZ9Te4UU3O8/blobs/DlgwMRSXNRwsZICTJcxs/INSIGHT_General_Productivity_drilldown2.png)

Use the arrow icon in the **Action** column to further drill down into details. Use the search box at the top to quickly filter specific information.

![](https://content.gitbook.com/content/SrTJQs663dZ9Te4UU3O8/blobs/5hwC2UqgZs6KaBHXC1LR/INSIGHT_General_Productivity_drilldown3.png)

## Risks Dashboard

The Risks Dashboard provides a detailed view of high-risk user activities and policy violations occurring across your organisation. It consolidates critical data from multiple monitoring categories, such as file transfers, application usage, email activity, and printing, to help you detect, assess, and respond to potential data security threats.

Unlike the Risk Summary Dashboard, which focuses on summarised risk levels, the Risks Dashboard delivers deeper visibility into the specific sources of risk. It highlights where violations are happening, which users are involved, and how sensitive information is being accessed, shared, or transferred.

This dashboard is particularly useful for security and compliance teams who need to investigate incidents, track behavioural patterns, and ensure adherence to data protection policies. Use the Risks Dashboard when you need a focused view of who, what, and how risks are occurring within your organisation.

You can access the Risks Dashboard from the **Dashboard** section in the GuardWare INSIGHT Management Console.

### Widgets in Risks Dashboard

<table data-header-hidden><thead><tr><th width="198"></th><th></th></tr></thead><tbody><tr><td><strong>Category</strong></td><td><strong>Widget Name</strong></td></tr><tr><td><strong>System Activity</strong></td><td><a href="#id-1.-pcs-online">PCs Online</a></td></tr><tr><td></td><td><a href="#id-2.-users-online">Users Online</a></td></tr><tr><td><strong>Storage Devices</strong></td><td><a href="#id-15.-storage-transfer-summary">Storage Transfer Summary</a></td></tr><tr><td></td><td><a href="#id-16.-storage-transfers">Storage Transfers</a></td></tr><tr><td><strong>Keystrokes</strong></td><td><a href="#id-17.-keystrokes-summary">Keystrokes Summary</a></td></tr><tr><td></td><td><a href="#id-18.-keystrokes">Keystrokes</a></td></tr><tr><td><strong>Applications</strong></td><td><a href="#id-1.-use-of-monitored-non-organisational-applications-summary">Use of Monitored Non-Organisational Applications Summary</a></td></tr><tr><td></td><td><a href="#id-2.-use-of-monitored-non-organisational-applications">Use of Monitored Non-Organisational Applications</a></td></tr><tr><td><strong>Web Activity</strong></td><td><a href="#id-3.-use-of-monitored-non-organisational-websites-summary">Use of Monitored Non-Organisational Websites Summary</a></td></tr><tr><td></td><td><a href="#id-4.-use-of-monitored-non-organisational-websites">Use of Monitored Non-Organisational Websites</a></td></tr><tr><td><strong>Cloud Storage</strong></td><td><a href="#id-5.-use-of-non-corporate-onedrive-folders-summary">Use of Non-Corporate OneDrive Folders Summary</a></td></tr><tr><td></td><td><a href="#id-6.-use-of-non-corporate-onedrive-folders">Use of Non-Corporate OneDrive Folders</a></td></tr><tr><td><strong>File Sharing</strong></td><td><a href="#id-7.-uploading-of-files-via-non-corporate-cloud-or-file-sharing-application-summary">Uploading of Files via Non-Corporate Cloud or File Sharing Application Summary</a></td></tr><tr><td></td><td><a href="#id-8.-uploading-of-files-via-non-corporate-cloud-or-file-sharing-application">Uploading of Files via Non-Corporate Cloud or File Sharing Application</a></td></tr><tr><td><strong>Printing</strong></td><td><a href="#id-9.-printing-of-files-using-non-corporate-printers-summary">Printing of Files Using Non-Corporate Printers Summary</a></td></tr><tr><td></td><td><a href="#id-10.-printing-files-using-non-corporate-printers">Printing of Files Using Non-Corporate Printers</a></td></tr><tr><td><strong>Website Uploads</strong></td><td><a href="#id-11.-uploads-of-data-to-non-corporate-websites-summary">Uploads of Data to Non-Corporate Websites Summary</a></td></tr><tr><td></td><td><a href="#id-12.-uploads-of-data-to-non-corporate-websites">Uploads of Data to Non-Corporate Websites</a></td></tr><tr><td><strong>Email Attachments</strong></td><td><a href="#id-13.-email-attachments-from-any-email-summary">Email Attachments From Any Email Summary</a></td></tr><tr><td></td><td><a href="#id-14.-emailing-of-attachments-from-any-email-address">Email Attachments From Any Email Address</a></td></tr><tr><td></td><td><a href="#id-15.-email-attachments-from-corporate-email-to-non-corporate-summary">Email Attachments from Corporate Email to Non-Corporate Summary</a></td></tr><tr><td></td><td><a href="#id-15.-email-attachments-from-corporate-email-to-non-corporate-summary">Emailing of Attachments from Corporate Email Address to Non-Corporate Email Address</a></td></tr><tr><td></td><td><a href="#id-17.-email-attachments-from-corporate-to-insecure-email-address-summary">Email Attachments From Corporate to Insecure Email Address Summary</a></td></tr><tr><td></td><td><a href="#id-18.-emailing-of-attachments-from-corporate-email-address-to-insecure-email-address">Emailing of Attachments From Corporate Email Address to Insecure Email Address</a></td></tr><tr><td></td><td><a href="#id-19.-emailing-of-attachments-from-non-corporate-email-address-summary">Emailing of Attachments From Non-Corporate Email Address Summary</a></td></tr><tr><td></td><td><a href="#id-20.-emailing-of-attachments-from-non-corporate-email-address">Emailing of Attachments From Non-Corporate Email Address</a></td></tr><tr><td></td><td><a href="#id-21.-email-attachments-from-corporate-email-to-personal-email-summary">Email Attachments From Corporate Email to Personal Email Summary</a></td></tr><tr><td></td><td><a href="#id-22.-emailing-of-attachments-from-corporate-email-address-to-personal-email-address">Emailing of Attachments From Corporate Email Address to Personal Email Address</a></td></tr><tr><td></td><td><a href="#id-23.-email-attachments-from-corporate-email-to-potential-personal-email-summary">Email Attachments from Corporate Email to Potential Personal Email Summary</a></td></tr><tr><td></td><td><a href="#id-24.-emailing-of-attachments-from-corporate-email-address-to-potential-personal-email-address">Emailing of Attachments From Corporate Email Address to Potential Personal Email Address</a></td></tr><tr><td></td><td><a href="#id-25.-email-attachments-from-corporate-email-to-own-corporate-email-summary">Email Attachments From Corporate Email to Own Corporate Email Summary</a></td></tr><tr><td></td><td><a href="#id-26.-emailing-of-attachments-from-corporate-email-to-own-corporate-email-address">Emailing of Attachments From Corporate Email to Own Corporate Email Address</a></td></tr><tr><td><strong>Documents</strong></td><td><a href="#id-19.-document-viewed-summary">Document Viewed Summary</a></td></tr><tr><td></td><td><a href="#id-20.-document-view">Document View</a></td></tr><tr><td><strong>Data Loss Prevention (DLP)</strong></td><td><a href="#id-21.-dlp-incidents-over-time">DLP Incidents Over Time</a></td></tr><tr><td></td><td><a href="#id-22.-dlp-incidents">DLP Incidents</a></td></tr><tr><td><strong>Application Control</strong></td><td><a href="#id-27.-application-control">Application Control</a></td></tr></tbody></table>

#### **1. Use of Monitored Non-Organisational Applications Summary**

This widget shows the total time users spent on non-organisational applications, such as unauthorised communication or file-sharing tools, along with the number of users involved. Clicking the widget takes you to the [Use of Monitored Non-Organisational Applications](#id-2.-use-of-monitored-non-organisational-applications) widget, where you can see more details.

![](https://content.gitbook.com/content/SrTJQs663dZ9Te4UU3O8/blobs/S0EfgXjPqhoqMjZPXYOy/INSIGHT_Risks_Use_of_Monitored_Non%20Organisational_Applications_Summary.png)

#### **2. Use of Monitored Non-Organisational Applications**

This widget helps you identify the use of applications outside authorised corporate systems and assess potential data security or compliance risks. It shows which users used which non-organisational applications, and how much time they spent using them. You can filter the data by application name and user.

![](https://content.gitbook.com/content/SrTJQs663dZ9Te4UU3O8/blobs/BHseNvLwbUG8UgpfWHv6/INSIGHT_Risks_Use_of_Monitored_Non%20Organisational_Applications.png)

Click a specific record to view detailed information. Use the search box at the top to quickly filter specific information.

![](https://content.gitbook.com/content/SrTJQs663dZ9Te4UU3O8/blobs/gKOyo5yX8Xq8uF9QTSH7/INSIGHT_Risks_Use_of_Monitored_Non%20Organisational_Applications_drilldown.png)

#### **3. Use of Monitored Non-Organisational Websites Summary**

This widget displays the total time users spend on non-organisational websites along with the number of users involved. Clicking the widget takes you to the [Use of Monitored Non-Organisational Websites](#id-4.-use-of-monitored-non-organisational-websites) widget, where you can see more details.

![](https://content.gitbook.com/content/SrTJQs663dZ9Te4UU3O8/blobs/uZzt9tpZLwEDADZE3BnO/INSIGHT_Risks_Use_of_Monitored_Non%20Organisational_Websites_Summary.png)

#### **4. Use of Monitored Non-Organisational Websites**

This widget helps you identify the use of websites outside corporate domains and identify high-risk browsing activities that may pose security or productivity concerns. It shows which users visited non-organisational websites and how much time they spent on them. You can filter the data by URL and user.

![](https://content.gitbook.com/content/SrTJQs663dZ9Te4UU3O8/blobs/5WAWAmwojRRGRKuhSb3R/INSIGHT_Risks_Use_of_Monitored_Non%20Organisational_Websites.png)

Click a specific record to view detailed information. Use the search box at the top to quickly filter specific information.

![](https://content.gitbook.com/content/SrTJQs663dZ9Te4UU3O8/blobs/LkphLvfkpTAL813HaZ6d/INSIGHT_Risks_Use_of_Monitored_Non%20Organisational_Websites_drilldown.png)

#### **5. Use of Non-Corporate OneDrive Folders Summary**

This widget shows the total number of files uploaded to or accessed from non-corporate OneDrive folders, including the total number of users involved. Clicking the widget takes you to the [Use of Non-Corporate OneDrive Folders](#id-6.-use-of-non-corporate-onedrive-folders) widget, where you can see more details.

#### **6. Use of Non-Corporate OneDrive Folders**

This widget helps you detect instances where corporate files are being stored or shared through personal OneDrive accounts rather than secured organisational storage. It shows the total number of file uploads made through non-corporate OneDrive folders, and the users who initiated them.

Click a specific record to view detailed information. Use the search box at the top to quickly filter specific information.

#### **7. Uploading of Files via Non-Corporate Cloud or File-Sharing Application Summary**

This widget shows the total number of file uploads made through non-corporate cloud or file-sharing applications, such as Dropbox or Google Drive, and the number of users who initiated them. Clicking the widget takes you to the [Uploading of Files via Non-Corporate Cloud or File-Sharing Application ](#id-8.-uploading-of-files-via-non-corporate-cloud-or-file-sharing-application)widget, where you can see more details.

![](https://content.gitbook.com/content/SrTJQs663dZ9Te4UU3O8/blobs/Ec20NjhBUtjQfEpPp9Tg/INSIGHT_Risks_Uploading_of_Files_via_Non%20Corporate_Cloud_Summary.png)

#### **8. Uploading of Files via Non-Corporate Cloud or File-Sharing Application**

This widget displays the information on which user uploaded which file on which non-corporate cloud or file-sharing application. It helps you identify unauthorised uploads that may lead to data loss. You can filter the data by application name, rule, and user.

![](https://content.gitbook.com/content/SrTJQs663dZ9Te4UU3O8/blobs/cmGO6sTay3N3JzrLJ7zu/INSIGHT_Risks_Uploading_of_Files_via_Non%20Corporate_Cloud.png)

Click a specific record to view detailed information, including the application name, username, rule name, PC name, the date and time of the violation, and the name of the file that was uploaded. Use the Arrow icon in the **Action** column to further drill down into details, and use the search box at the top to quickly filter specific information.

![](https://content.gitbook.com/content/SrTJQs663dZ9Te4UU3O8/blobs/zPy5DRUN4m3mBU6SdB0U/INSIGHT_Risks_Uploading_of_Files_via_Non%20Corporate_Cloud_drilldown.png)

#### **9. Printing of Files Using Non-Corporate Printers Summary**

This widget displays the total number of files printed via non-corporate printers, along with the number of users who performed the print jobs. Clicking the widget takes you to the [Printing files using non-corporate printers](#id-10.-printing-files-using-non-corporate-printers) widget, where you can see more details.

![](https://content.gitbook.com/content/SrTJQs663dZ9Te4UU3O8/blobs/zA6GIdvjSmFRvDCCJZb1/INSIGHT_Risks_Printing_of_Files_Using_Non%20Corporate_Printers_Summary.png)

#### **10. Printing files Using Non-Corporate Printers**

This widget helps you track files printed using non-corporate or unauthorised printers. It provides visibility into printing activities that may lead to hard-copy data leaks. You can filter the data by printer name, rule, and user.

![](https://content.gitbook.com/content/SrTJQs663dZ9Te4UU3O8/blobs/7agCkOtun9artkFc9enf/INSIGHT_Risks_Printing_of_Files_Using_Non%20Corporate_Printers.png)

Click a specific record to view detailed information, including the username, file name, file path, printer name, PC name, and violation date and time. Use the Arrow icon in the **Action** column to further drill down into details, and use the search box at the top to quickly filter specific information.

![](https://content.gitbook.com/content/SrTJQs663dZ9Te4UU3O8/blobs/WJNP45ZARf0FuTUZYYc9/INSIGHT_Risks_Printing_of_Files_Using_Non%20Corporate_Printers_drilldown.png)

#### **11. Uploads of Data to Non-Corporate Websites Summary**

This widget shows the total number of file uploads or transfers made to corporate and non-corporate websites, such as public file-sharing services or personal cloud storage platforms, including the total number of users who initiated the upload. Clicking the widget takes you to the [Uploads of Data to Non-Corporate Websites](#id-12.-uploads-of-data-to-non-corporate-websites) widget, where you can see more details.

![](https://content.gitbook.com/content/SrTJQs663dZ9Te4UU3O8/blobs/Bg58wsUxu8Z9xBkpOuvQ/INSIGHT_Risks_Uploads_of_Data_to_Non%20Corporate_Websites_Summary.png)

#### **12. Uploads of Data to Non-Corporate Websites**

This widget helps you detect and prevent potential data leaks by identifying websites where sensitive content was uploaded or shared. You can filter the data by URL, rule, and user.

![](https://content.gitbook.com/content/SrTJQs663dZ9Te4UU3O8/blobs/C09Fz8YtVy8bErnWFs9r/INSIGHT_Risks_Uploads_of_Data_to_Non%20Corporate_Websites.png)

Click a specific record to view detailed information, including the username, rule name, URL, the date and time of the violation, software used, and the name and path of the file uploaded. Use the Arrow icon in the **Action** column to further drill down into details like detected content in the website text, PC name, and so on. Use the search box at the top to quickly filter specific information.

![](https://content.gitbook.com/content/SrTJQs663dZ9Te4UU3O8/blobs/pDZhrcvuAeXEolMHtwwZ/INSIGHT_Risks_Uploads_of_Data_to_Non%20Corporate_Websites_drilldown.png)

#### **13. Email Attachments From Any Email Summary**

This widget shows the total number of email attachments sent via both corporate and non-corporate email accounts, including the total number of users who sent the attachment. Clicking the widget takes you to the [Emailing of attachments from any email address](#id-14.-emailing-of-attachments-from-any-email-address) widget, where you can see more details.

![](https://content.gitbook.com/content/SrTJQs663dZ9Te4UU3O8/blobs/TQq1bTZ9eG298tuw0q1N/INSIGHT_Risks_Email_Attachments_from_Any_Email_Summary.png)

#### **14. Emailing of Attachments From Any Email Address**

This widget helps you track violations involving email attachments sent from any email account, including both corporate and non-corporate. It helps you identify when sensitive files are being shared externally and track which users are sending attachments that may violate your organisation’s policies. You can filter the data by email provider, violation rule, and user.

![](https://content.gitbook.com/content/SrTJQs663dZ9Te4UU3O8/blobs/fLRNOimDjogcpBQrTf8G/INSIGHT_Risks_Email_Attachments_from_Any_Email.png)

Click a specific record to view detailed information, including the email provider, username, rule name, the date and time of the violation, the name of the file that was shared, and the email subject. Use the Arrow icon in the **Action** column to further drill down into details like sender and receiver’s email address, and so on. Use the search box at the top to quickly filter specific information.

![](https://content.gitbook.com/content/SrTJQs663dZ9Te4UU3O8/blobs/suz8PrA4XeD3vLp3cUfW/INSIGHT_Risks_Email_Attachments_from_Any_Email_drilldown.png)

#### **15. Email Attachments From Corporate Email to Non-Corporate Summary**

This widget shows the total number of attachments sent from corporate email addresses to non-corporate domains, which are not part of your organisation’s authorised or managed domain, along with the total number of users involved. Clicking the widget takes you to the [Emailing of attachments from Corporate Email Address to Non-Corporate Email Address ](#id-16.-emailing-of-attachments-from-corporate-email-address-to-non-corporate-email-address)widget, where you can see more details.

![](https://content.gitbook.com/content/SrTJQs663dZ9Te4UU3O8/blobs/YmO7WkFnSgrwKe4C9w0f/INSIGHT_Risks_Email_Attachments_from_Corporate_Email_to_Non%20Corporate_Summary.png)

#### **16. Emailing of Attachments from Corporate Email Address to Non-Corporate Email Address**

This widget displays information about attachments sent from corporate email accounts to non-corporate domains. It helps identify external data sharing and ensure that outbound communication follows corporate data-sharing standards. You can filter the data by email provider, violation rule, and user.

![](https://content.gitbook.com/content/SrTJQs663dZ9Te4UU3O8/blobs/0wvGRbERAkiOl63MdUUc/INSIGHT_Risks_Email_Attachments_from_Corporate_Email_to_Non%20Corporate.png)

Click a specific record to view detailed information, including the email provider, username, rule name, the date and time of the violation, the name of the file that was shared, and the email subject. Use the Arrow icon in the **Action** column to further drill down into details like sender and receiver’s email address, and so on. Use the search box at the top to quickly filter specific information.

![](https://content.gitbook.com/content/SrTJQs663dZ9Te4UU3O8/blobs/PjDqslYOcFotIkKXMzGO/INSIGHT_Risks_Email_Attachments_from_Corporate_Email_to_Non%20Corporate_drilldown.png)

#### **17. Email Attachments from Corporate to Insecure Email Address Summary**

This widget shows the total number of attachments sent from corporate email accounts to insecure email providers that do not meet the organisation’s defined security standards, including the total number of users involved. Clicking the widget takes you to the [Emailing of attachments from Corporate Email Address to Insecure Email Address](#id-18.-emailing-of-attachments-from-corporate-email-address-to-insecure-email-address) widget, where you can see more details.

![](https://content.gitbook.com/content/SrTJQs663dZ9Te4UU3O8/blobs/VxX1EKKlevbpKvNltfxX/INSIGHT_Risks_Email_Attachments_from_Corporate_Email_to_Insecure_Summary.png)

#### **18. Emailing of Attachments from Corporate Email Address to Insecure Email Address**

This widget lists incidents where attachments were sent from corporate accounts to insecure email addresses, such as lacking encryption, using outdated protocols, or failing to meet compliance requirements. It helps detect potential exposure of sensitive data to unprotected or unverified email providers. You can filter the data by email provider, violation rule, and user.

![](https://content.gitbook.com/content/SrTJQs663dZ9Te4UU3O8/blobs/HRE4kya2B3HUK6cLAVbo/INSIGHT_Risks_Email_Attachments_from_Corporate_Email_to_Insecure.png)

Click a specific record to view detailed information, including the email provider, username, rule name, the date and time of the violation, the name of the file that was shared, and the email subject. Use the Arrow icon in the **Action** column to further drill down into details like sender and receiver’s email address, and so on. Use the search box at the top to quickly filter specific information.

![](https://content.gitbook.com/content/SrTJQs663dZ9Te4UU3O8/blobs/BN4B1q1xqswdSX9qbMZ5/INSIGHT_Risks_Email_Attachments_from_Corporate_Email_to_Insecure_drilldown.png)

#### **19. Emailing of Attachments from Non-Corporate Email Address Summary**

This widget displays the number of attachments sent using non-corporate email addresses, along with the total number of users who received them. Clicking the widget takes you to the [Emailing of attachments from Non-Corporate Email Address](#id-20.-emailing-of-attachments-from-non-corporate-email-address) widget, where you can see more details.

![](https://content.gitbook.com/content/SrTJQs663dZ9Te4UU3O8/blobs/9Bzak2Pgz0J19s0NZDyW/INSIGHT_Risks_Emailing_of_Attachments_from_Non%20Corporate_Email_Address_Summary.png)

#### **20. Emailing of Attachments from Non-Corporate Email Address**

This widget displays incidents where attachments were sent from non-corporate email addresses. It helps you identify unauthorised data transfers performed through personal or unmonitored email accounts. You can filter the data by email provider, violation rule, and user.

![](https://content.gitbook.com/content/SrTJQs663dZ9Te4UU3O8/blobs/i9CMMbrI5DgNracdQFJj/INSIGHT_Risks_Emailing_of_Attachments_from_Non%20Corporate_Email_Address.png)

Click a specific record to view detailed information, including the email provider, username, rule name, the date and time of the violation, the name of the file that was shared, and the email subject. Use the Arrow icon in the **Action** column to further drill down into details like sender and receiver’s email address, and so on. Use the search box at the top to quickly filter specific information.

![](https://content.gitbook.com/content/SrTJQs663dZ9Te4UU3O8/blobs/Dqw4eAhBzhNH0HkvRf7A/INSIGHT_Risks_Emailing_of_Attachments_from_Non%20Corporate_Email_Address_drilldown.png)

#### **21. Email Attachments from Corporate Email to Personal Email Summary**

This widget shows the number of attachments sent from corporate email accounts to personal addresses, including the total number of users who performed the action. Clicking the widget takes you to the [Emailing of attachments from Corporate Email Address to Personal Email Address](#id-22.-emailing-of-attachments-from-corporate-email-address-to-personal-email-address) widget, where you can see more details.

![](https://content.gitbook.com/content/SrTJQs663dZ9Te4UU3O8/blobs/cEUccYNlMiu0Q0yIR5I5/INSIGHT_Risks_Email_Attachments_from_Corporate_Email_to_Personal_Summary.png)

#### **22. Emailing of Attachments from Corporate Email Address to Personal Email Address**

This widget displays incidents where attachments were sent from corporate accounts to personal email addresses. It helps you identify users who transfer company data to private inboxes. You can filter the data by email provider, violation rule, and user.

![](https://content.gitbook.com/content/SrTJQs663dZ9Te4UU3O8/blobs/I6K0tlsfpdwvOWrb8ZAW/INSIGHT_Risks_Email_Attachments_from_Corporate_Email_to_Personal.png)

Click a specific record to view detailed information, including the email provider, username, rule name, the date and time of the violation, the name of the file that was shared, and the email subject. Use the Arrow icon in the **Action** column to further drill down into details like sender and receiver’s email address, and so on. Use the search box at the top to quickly filter specific information.

![](https://content.gitbook.com/content/SrTJQs663dZ9Te4UU3O8/blobs/GTJyJ7g4XlZRFnpK71ja/INSIGHT_Risks_Email_Attachments_from_Corporate_Email_to_Personal_drilldown.png)

#### **23. Email Attachments from Corporate Email to Potential Personal Email Summary**

This widget shows the number of attachments sent from corporate email accounts to potential personal email addresses (that may belong to individual users, but are not from a recognised public email domain), including the total number of users who performed the action. Clicking the widget takes you to the [Emailing of attachments from Corporate Email Address to Potential Personal Email Address](#id-24.-emailing-of-attachments-from-corporate-email-address-to-potential-personal-email-address) widget, where you can see more details.

![](https://content.gitbook.com/content/SrTJQs663dZ9Te4UU3O8/blobs/llfelMDHxVEQbK9KdZL9/INSIGHT_Risks_Email_Attachments_from_Corporate_to_Potential_Personal_Summary.png)

#### **24. Emailing of attachments from Corporate Email Address to Potential Personal Email Address**

This widget lists incidents of attachments sent from corporate accounts to potential personal email accounts. It helps you flag suspicious email activity for review. You can filter the data by email provider, violation rule, and user.

![](https://content.gitbook.com/content/SrTJQs663dZ9Te4UU3O8/blobs/UpoSjwOTiMNu4T74dUkH/INSIGHT_Risks_Email_Attachments_from_Corporate_to_Potential_Personal.png)

Click a specific record to view detailed information, including the email provider, username, rule name, the date and time of the violation, the name of the file that was shared, and the email subject. Use the Arrow icon in the **Action** column to further drill down into details like sender and receiver’s email address, and so on. Use the search box at the top to quickly filter specific information.

![](https://content.gitbook.com/content/SrTJQs663dZ9Te4UU3O8/blobs/LvByJc1cf6nX1YtDUm2H/INSIGHT_Risks_Email_Attachments_from_Corporate_to_Potential_Personal_drilldown.png)

#### **25. Email Attachments from Corporate Email to Own Corporate Email Summary**

This widget tracks emails where users sent attachments from their **corporate email accounts to their own corporate addresses**, including the number of users who did so. Clicking the widget takes you to the [Emailing of attachments from Corporate Email to Own Corporate Email Address](#id-26.-emailing-of-attachments-from-corporate-email-to-own-corporate-email-address) widget, where you can see more details.

![](https://content.gitbook.com/content/SrTJQs663dZ9Te4UU3O8/blobs/ZIveuuvDOjS8b78QpIK0/INSIGHT_Risks_Email_Attachments_from_Corporate_to_Own_Corporate_Email_Summary.png)

#### **26. Emailing of attachments from Corporate Email to Own Corporate Email Address**

This widget displays self-emailing incidents where users sent attachments to their own **corporate accounts**. It helps monitor self-transfers that may indicate attempts to bypass data-handling policies or duplicate sensitive files. You can filter the data by email provider, violation rule, and user.

![](https://content.gitbook.com/content/SrTJQs663dZ9Te4UU3O8/blobs/07LOpfeaVgI851prpBsi/INSIGHT_Risks_Email_Attachments_from_Corporate_to_Own_Corporate_Email.png)

Click a specific record to view detailed information, including the email provider, username, rule name, the date and time of the violation, the name of the file that was shared, and the email subject. Use the Arrow icon in the **Action** column to further drill down into details like sender and receiver’s email address, and so on. Use the search box at the top to quickly filter specific information.

![](https://content.gitbook.com/content/SrTJQs663dZ9Te4UU3O8/blobs/QOxBgsS3j6b3u5UAi5ww/INSIGHT_Risks_Email_Attachments_from_Corporate_to_Own_Corporate_Email_drilldown.png)

#### **27. Application Control**

This widget provides visibility into application (for example, browsers, work-related, and non-work applications) usage across your organisation. It shows which users accessed which applications and how much time they spent using them. It helps you enforce application usage policies, detect unapproved tools, and maintain compliance with security guidelines.

![](https://content.gitbook.com/content/SrTJQs663dZ9Te4UU3O8/blobs/ZOK3NGoo54L8vIo4NSPA/INSIGHT_Risks_Application_Control.png)

Click a specific record to view detailed information, including the application name, description, number of users, time spent on the application, and vendor name.

![](https://content.gitbook.com/content/SrTJQs663dZ9Te4UU3O8/blobs/5f3WTTAPsaHeLPL2usD7/INSIGHT_Risks_Application_Control_drilldown1.png)

Use the Arrow icon in the **Action** column to further drill down into details like PC name, user name, date, and time. Use the search box at the top to quickly filter specific information.

![](https://content.gitbook.com/content/SrTJQs663dZ9Te4UU3O8/blobs/TQytjliNVv42mVrnpH8E/INSIGHT_Risks_Application_Control_drilldown2.png)

## SharePoint Dashboard

The SharePoint Dashboard provides detailed visibility into file access, sharing, and download activities within your organisation’s SharePoint environment. It consolidates user interactions, link-sharing patterns, and platform-based access data to help administrators monitor collaboration, detect unusual behaviour, and ensure secure handling of sensitive corporate information.

Unlike other dashboards that focus on general system activity or user risk, the SharePoint Dashboard specifically analyses SharePoint-related data usage, giving insights into how files are accessed internally and externally, how sharing links are created, and which devices or platforms are used to view or download content.

This dashboard is especially useful for security administrators and compliance teams who need to audit SharePoint access, track file exposure through anonymous or external links, and ensure that data stored in SharePoint sites is being accessed according to organisational policy.

You can access the SharePoint Dashboard from the Dashboard section in the GuardWare INSIGHT Management Console.

![](https://content.gitbook.com/content/SrTJQs663dZ9Te4UU3O8/blobs/9kSS27ruwiyUMVNCZ1eA/INSIGHT_SharePoint_Dashboard.png)

### Widgets in SharePoint Dashboard

<table data-header-hidden><thead><tr><th width="301">Category</th><th>Widget Name</th></tr></thead><tbody><tr><td><strong>Category</strong></td><td><strong>Widget Name</strong></td></tr><tr><td><strong>File and User Activity</strong></td><td><a href="#id-1.-sharepoint-file-access-and-download-logs-by-file-name-or-by-platform">SharePoint File Access and Download Logs by File Name or by Platform</a></td></tr><tr><td></td><td><a href="#id-2.-sharepoint-link-creation-file-access-and-download-logs-by-user-name">SharePoint Link Creation, File Access, and Download Logs by User Name</a></td></tr><tr><td><strong>Library Activity</strong></td><td><a href="#id-3.-sharepoint-activity-logs-by-library-name">SharePoint Activity Logs by Library Name</a></td></tr><tr><td><strong>Link and Access Management</strong></td><td><a href="#id-4.-sharepoint-anonymous-link-creation-by-file-name-or-by-user-name">SharePoint Anonymous Link Creation by File Name or by User Name</a></td></tr><tr><td></td><td><a href="#id-5.-sharepoint-external-file-access-logs-by-file-name-or-by-user-name">SharePoint External File Access Logs by File Name or by User Name</a></td></tr><tr><td><strong>Downloads and Access by Platform</strong></td><td><a href="#id-6.-sharepoint-file-download-logs-by-file-name">SharePoint File Download Logs by File Name</a></td></tr><tr><td></td><td><a href="#id-7.-sharepoint-file-access-logs-by-platform">SharePoint File Access Logs by Platform</a></td></tr><tr><td></td><td><a href="#id-8.-sharepoint-file-download-logs-by-platform">SharePoint File Download Logs by Platform</a></td></tr></tbody></table>

#### **1. SharePoint File Access and Download Logs by File Name or by Platform**

This widget displays detailed logs of file access and download activity for SharePoint files. It provides visibility into how and where files are being used across your organisation’s SharePoint environment, helping you track external collaboration and detect potential unauthorised sharing through anonymous or external access links. You can filter the data by filename, platform name, and IP address.

![](https://content.gitbook.com/content/SrTJQs663dZ9Te4UU3O8/blobs/vYnQE6preWBUF4675JYT/INSIGHT_SharePoint_File_Access_And_Download_Logs_By_File_Name_Or_By_Platform.png)

For each file, the widget shows:

* Secure Links Created: Number of secure or organisation-approved sharing links created.
* Anonymous Links Created: Number of public or unrestricted sharing links generated.
* Accessed by (Internal/External): Number of times files were accessed by internal or external users.
* Downloaded by (Internal/External): Number of times files were downloaded within or outside the organisation.

Click a specific record to view detailed information, including the user who accessed or shared the file, file path, incident date and time, browser name, and so on.

![](https://content.gitbook.com/content/SrTJQs663dZ9Te4UU3O8/blobs/w51ptxt4kxY1rJ5YEpmJ/INSIGHT_SharePoint_File_Access_And_Download_Logs_By_File_Name_Or_By_Platform_drilldown.png)

#### **2. SharePoint Link Creation, File Access, and Download Logs by User Name**

This widget provides a user-level view of SharePoint link creation, file access, and download activity. It displays each user’s total number of links created and files accessed or downloaded, helping you identify who is sharing, accessing, or exporting SharePoint content. This widget helps detect excessive or unusual file-sharing activity, monitor external collaboration, and ensure that all file access and sharing actions comply with organisational data-security policies.

![](https://content.gitbook.com/content/SrTJQs663dZ9Te4UU3O8/blobs/mL0ljhMc2Tkb4ymz6TcA/INSIGHT_SharePoint_Link_Creation_File_Access_And_Download_Logs_By_User_Name.png)

For each user, the widget shows key details such as:

* **Secure Links Created:** Number of secure or organisation-approved sharing links created.
* **Anonymous Links Created:** Number of public or unrestricted sharing links generated.
* **Accessed by (Internal/External):** Number of times files were accessed by internal or external users.
* **Downloaded by (Internal/External):** Number of times files were downloaded within or outside the organisation.

Click a specific record to view detailed information, including the user’s email address, file name, file path, URL, incident date and time, browser name, and so on.

![](https://content.gitbook.com/content/SrTJQs663dZ9Te4UU3O8/blobs/1XyWfKO9RksfKGHKDNJo/INSIGHT_SharePoint_Link_Creation_File_Access_And_Download_Logs_By_User_Name_drilldown.png)

#### **3. SharePoint Activity Logs by Library Name**

This widget displays activity logs for SharePoint libraries, showing file access, sharing, and download activity within each document library. It helps you track how data is being used within different libraries and identify which files or folders are being accessed most frequently, and detect unusual access patterns.

![](https://content.gitbook.com/content/SrTJQs663dZ9Te4UU3O8/blobs/p2lhdDfrg9ih2X1ZQhV8/INSIGHT_SharePoint_Activity_Logs_By_Library_Name.png)

For each library, the widget lists details such as:

* **File Path and Site Name:** Location of the library and the associated SharePoint site.
* **File Name:** Name of the file stored in that library.
* **Secure Links Created / Anonymous Links Created:** Number of secure or public links generated for files within the library.
* **Accessed by (Internal/External):** Number of times files were accessed by internal staff or external users.
* **Downloaded by (Internal/External):** Number of times files were downloaded inside or outside the organisation.

Click a specific record to view detailed information, including the user who accessed the file, file name, file path, URL, incident date and time, browser name, and so on.

![](https://content.gitbook.com/content/SrTJQs663dZ9Te4UU3O8/blobs/UbuYQMrUyReR6UfjDpGY/INSIGHT_SharePoint_Activity_Logs_By_Library_Name_drilldown.png)

#### **4. SharePoint Anonymous Link Creation by File Name or by User Name**

This widget displays details of anonymous link creation activity within SharePoint. It helps you identify when files are shared publicly through links that allow access without authentication. This widget is crucial for monitoring data exposure risks, as anonymous links bypass user identity verification and can be forwarded to unauthorised recipients. By tracking which files and users are involved, you can review, revoke, or restrict public sharing and enforce secure link policies. You can filter the data by file name or user name.

![](https://content.gitbook.com/content/SrTJQs663dZ9Te4UU3O8/blobs/Q8K1Sz0wwnjFdMqsP8fE/INSIGHT_SharePoint_Anonymous_Link_Creation_By_File_Name_Or_By_User_Name.png)

For each file or user, the widget shows:

* **Number of Users:** How many users created anonymous links for the listed files.
* **Number of Incidents:** How many times anonymous links were generated for the same file or by the same user.

Click a specific record to view detailed information, including the user who created the link, file name, file path, URL, incident date and time, browser name, and so on.

![](https://content.gitbook.com/content/SrTJQs663dZ9Te4UU3O8/blobs/XGdmMJWvfPnfBu78l4HB/INSIGHT_SharePoint_Anonymous_Link_Creation_By_File_Name_Or_By_User_Name_drilldown.png)

#### **5. SharePoint External File Access Logs by File Name or by User Name**

This widget provides visibility into external access activity for SharePoint files. It helps you track when and how files stored in SharePoint are being accessed by users outside the organisation’s domain. This widget is essential for identifying data exposure risks through external collaboration or sharing. By reviewing external access patterns, you can verify whether file-sharing aligns with business requirements and take action to revoke access or strengthen permissions when needed. You can filter the data by file name or user name.

![](https://content.gitbook.com/content/SrTJQs663dZ9Te4UU3O8/blobs/mNCXwIVUVfwMeSxKeTzs/INSIGHT_SharePoint_External_File_Access_Logs_By_File_Name_Or_By_User_Name.png)

For each file or user, the widget includes:

* **Number of Users:** Total external users who accessed the file.
* **Number of Incidents:** Total number of times the file was accessed externally.

Click a specific record to view detailed information, including the user who accessed the file, file name, file path, URL, incident date and time, browser name, and so on.

![](https://content.gitbook.com/content/SrTJQs663dZ9Te4UU3O8/blobs/nN2UC375dCwQBFRtEExt/INSIGHT_SharePoint_External_File_Access_Logs_By_File_Name_Or_By_User_Name_drilldown.png)

#### **6. SharePoint File Download Logs by File Name**

This widget displays detailed logs of file download activity within SharePoint. It helps you track which files are being downloaded, by whom, and how often, helping ensure that downloads comply with organisational data handling policies. You can filter the data by internal or external users.

![](https://content.gitbook.com/content/SrTJQs663dZ9Te4UU3O8/blobs/WWxEeBonu2a9WhYMRR1g/INSIGHT_SharePoint_File_Download_Logs_By_File_Name.png)

For each file, the widget shows:

* **Number of Users:** Total users who downloaded the file.
* **Incidents:** Total number of download actions recorded for that file.

Click a specific record to view detailed information, including the user who downloaded the file, file name, file path, URL, incident date and time, browser name, and so on.

![](https://content.gitbook.com/content/SrTJQs663dZ9Te4UU3O8/blobs/cn2sEur0o4r8QvvddEhn/INSIGHT_SharePoint_File_Download_Logs_By_File_Name_Drilldown.png)

#### **7. SharePoint File Access Logs by Platform**

This widget displays detailed records of SharePoint file access activity, categorised by platform or device type. It provides visibility into which operating systems and applications are being used to access SharePoint files, helping you detect unusual access from unauthorised devices, such as personal mobile phones or unregistered systems. You can filter the data by internal or external users.

![](https://content.gitbook.com/content/SrTJQs663dZ9Te4UU3O8/blobs/F3oTsnlnHFfQCjEpBujh/INSIGHT_SharePoint_File_Access_Logs_By_Platform.png)

For each platform, the widget shows:

* **Number of Users:** Total users who accessed files using that platform.
* **Incidents:** Total number of access events recorded for that platform.

Click a specific record to view detailed information, including the user who accessed the file, file name, file path, URL, incident date and time, browser name, and so on.

![](https://content.gitbook.com/content/SrTJQs663dZ9Te4UU3O8/blobs/T8z6TlehU6k3AGGRsWFe/INSIGHT_SharePoint_File_Access_Logs_By_Platform_drilldown.png)

#### **8. SharePoint File Download Logs by Platform**

This widget shows detailed information on SharePoint file download activity, categorised by platform or device type. It helps you identify which devices and operating systems are being used to download files, offering insights into unusual download patterns, such as large file transfers from unverified devices or unapproved operating systems. You can filter the data by internal or external users.

![](https://content.gitbook.com/content/SrTJQs663dZ9Te4UU3O8/blobs/kfB93CgwvaF7y7psYWCa/INSIGHT_SharePoint_File_Download_Logs_By_Platform.png)

For each platform, the widget displays:

* **Number of Users:** Total users who downloaded files using that platform.
* **Incidents:** Total number of download actions recorded for that platform.

Click a specific record to view detailed information, including the user who downloaded the file, file name, file path, URL, incident date and time, browser name, and so on.

![](https://content.gitbook.com/content/SrTJQs663dZ9Te4UU3O8/blobs/sPMxwwdA3OerXDxNTbgt/INSIGHT_SharePoint_File_Download_Logs_By_Platform_drilldown.png)

## AI Usage Dashboard <a href="#ai-usage-dashboard" id="ai-usage-dashboard"></a>

The AI Usage Dashboard provides visibility into how users interact with AI tools across both applications and web platforms. It helps organisations detect file uploads, sensitive prompts, and overall time spent on AI systems such as ChatGPT, Claude, Gemini, DeepSeek, Perplexity, and other emerging AI assistants. This dashboard is particularly useful for monitoring data-loss risks, ensuring compliance with AI usage policies, and assessing the business impact of AI adoption in the workplace.

You can access the AI Usage Dashboard from the Dashboard section in the GuardWare INSIGHT Management Console.

<figure><img src="https://1102323068-files.gitbook.io/~/files/v0/b/gitbook-x-prod.appspot.com/o/spaces%2FSrTJQs663dZ9Te4UU3O8%2Fuploads%2FUgo9F27VoIa41OYHppss%2Fimage.png?alt=media&amp;token=db4df9b3-c671-4831-84f4-c3c12881b4f8" alt=""><figcaption></figcaption></figure>

### Widgets in AI Usage Dashboard <a href="#widgets-in-ai-usage-dashboard" id="widgets-in-ai-usage-dashboard"></a>

| **Category**                    | **Widget Name**                                                                                                   |
| ------------------------------- | ----------------------------------------------------------------------------------------------------------------- |
| **System Activity**             | [PCs Online](#id-1.-pcs-online)                                                                                   |
|                                 | [Users Online](#id-2.-users-online)                                                                               |
| **AI Website Usage**            | [Time Spent on Generative AI Website Summary](#id-3.-time-spent-on-generative-ai-website-summary)                 |
|                                 | [Time Spent on Generative AI Website](#id-4.-time-spent-on-generative-ai-website)                                 |
| **AI Application Usage**        | [Time Spent on Generative AI Application Summary](#id-5.-time-spent-on-generative-ai-application-summary)         |
|                                 | [Time Spent on Generative AI Application](#id-6.-time-spent-on-generative-ai-application)                         |
| **AI Website Uploads**          | [Files Uploaded to Generative AI Website Summary](#id-7.-files-uploaded-to-generative-ai-website-summary)         |
|                                 | [Files Uploaded to Generative AI Website](#id-8.-files-uploaded-to-generative-ai-website)                         |
| **AI Application Uploads**      | [Files Uploaded to Generative AI Application Summary](#id-9.-files-uploaded-to-generative-ai-application-summary) |
|                                 | [Files Uploaded to Generative AI Application](#id-10.-files-uploaded-to-generative-ai-application)                |
| **Sensitive Prompt Monitoring** | [Sensitive Prompts Used in AI Website Summary](#id-11.-sensitive-prompts-used-in-ai-website-summary)              |
|                                 | [Sensitive Prompts Used in AI Website](#id-12.-sensitive-prompts-used-in-ai-website)                              |

#### **1. PCs Online**

This widget shows the total number of PCs that are online or offline during the selected time period. It helps you monitor endpoint availability and determine which systems are active or inactive across the network.

<figure><img src="https://1102323068-files.gitbook.io/~/files/v0/b/gitbook-x-prod.appspot.com/o/spaces%2FSrTJQs663dZ9Te4UU3O8%2Fuploads%2Flbgd6Uxb2bCeFUTZZn0G%2Fimage.png?alt=media&amp;token=27deac88-e5ed-4cf1-b3fa-2ab70e104890" alt=""><figcaption></figcaption></figure>

Click the widget to view detailed information, including the PC name, PC group, username, and last online time. Use the **Online** and **Offline** tabs to switch between active and inactive PCs, and use the search box at the top to quickly filter specific results.

<figure><img src="https://1102323068-files.gitbook.io/~/files/v0/b/gitbook-x-prod.appspot.com/o/spaces%2FSrTJQs663dZ9Te4UU3O8%2Fuploads%2FzCw24nBzdX9ntLo0EFj1%2Fimage.png?alt=media&amp;token=04dc914f-a5fb-4dd0-bf69-08798b41a9f9" alt=""><figcaption></figcaption></figure>

#### **2. Users Online**

This widget displays the total number of users who are online or offline within the selected time period. It helps you track user activity levels and session availability.

<figure><img src="https://1102323068-files.gitbook.io/~/files/v0/b/gitbook-x-prod.appspot.com/o/spaces%2FSrTJQs663dZ9Te4UU3O8%2Fuploads%2FkaZyfsKMQJsk9i3jsT1q%2Fimage.png?alt=media&amp;token=3467253d-853b-4f61-ab34-16cc6a6e3e8d" alt=""><figcaption></figcaption></figure>

&#x20;Click the widget to view detailed information, including the username, user group, PC name, and last online time. Use the **Online** and **Offline** tabs to switch between active and inactive users, and use the search box at the top to quickly filter specific results.

<figure><img src="https://1102323068-files.gitbook.io/~/files/v0/b/gitbook-x-prod.appspot.com/o/spaces%2FSrTJQs663dZ9Te4UU3O8%2Fuploads%2FYkbPBdQoONGltMbuuD2b%2Fimage.png?alt=media&amp;token=1a4ff077-4c41-47bd-9304-939fc6365676" alt=""><figcaption></figcaption></figure>

#### **3. Time Spent on Generative AI Website Summary**

This widget displays how much total time users spent on web-based Generative AI platforms, such as *ChatGPT*, *Claude*, *Gemini*, *DeepSeek*, and *so on*. It shows the number of users using AI websites and the total browsing duration. You can use it to monitor engagement levels with AI tools, detect excessive usage, and evaluate whether users are relying on external AI systems for work-related tasks. Clicking the widget takes you to the [Time Spent on Generative AI Website](#id-4.-time-spent-on-generative-ai-website) widget, where you can see more details.

<figure><img src="https://1102323068-files.gitbook.io/~/files/v0/b/gitbook-x-prod.appspot.com/o/spaces%2FSrTJQs663dZ9Te4UU3O8%2Fuploads%2FxThyp89112HDfhs32vSN%2Fimage.png?alt=media&amp;token=62780c23-fc34-4a7e-a1f4-7af969c7f6ff" alt=""><figcaption></figcaption></figure>

#### **4. Time Spent on Generative AI Website**

This widget displays time spent per AI website or domain, listing the number of users and the total time for each platform. It provides visibility into how long employees interact with AI services such as *ChatGPT*, *Claude*, *Gemini*, *DeepSeek*, and *so on*. This widget helps you understand the scale of AI tool usage and detect patterns that may indicate policy breaches or overuse of external AI resources.

<figure><img src="https://1102323068-files.gitbook.io/~/files/v0/b/gitbook-x-prod.appspot.com/o/spaces%2FSrTJQs663dZ9Te4UU3O8%2Fuploads%2FOi2SbpehqvJ1R8M5QJmr%2Fimage.png?alt=media&amp;token=da1145fa-c3fd-4d0c-a9e2-8fb55f213595" alt=""><figcaption></figcaption></figure>

Click a specific record to view detailed information, including the username, total time spent by each user on the website, and the date when users accessed the site. Use the search box at the top to quickly filter specific information.

<figure><img src="https://1102323068-files.gitbook.io/~/files/v0/b/gitbook-x-prod.appspot.com/o/spaces%2FSrTJQs663dZ9Te4UU3O8%2Fuploads%2FAsUftEi3J6uTIuigk0Fu%2Fimage.png?alt=media&amp;token=5c016664-cdfb-469b-b1a5-d1d64017b78c" alt=""><figcaption></figcaption></figure>

#### **5. Time Spent on Generative AI Application Summary**

This widget displays the total time users spend using Generative AI applications installed on their devices, such as *CHATGPT.EXE* or other desktop-based AI tools. It helps identify how much time employees are actively engaging with AI software that may handle sensitive or corporate data.\
You can use this information to assess productivity impact, detect unauthorised AI tool usage, and ensure compliance with organisational policies. Clicking the widget takes you to the [Time Spent on Generative AI Application](#id-6.-time-spent-on-generative-ai-application) widget, where you can see more details.

<figure><img src="https://1102323068-files.gitbook.io/~/files/v0/b/gitbook-x-prod.appspot.com/o/spaces%2FSrTJQs663dZ9Te4UU3O8%2Fuploads%2FTFaJux4B2KDwGaw8hwM7%2Fimage.png?alt=media&amp;token=777f8e06-d209-4ec6-9cac-53013e18684b" alt=""><figcaption></figcaption></figure>

#### **6. Time Spent on Generative AI Application**

This widget displays how much time users spend using installed Generative AI applications on their devices, such as the desktop version of ChatGPT (e.g. `CHATGPT.EXE`). It shows the number of users who accessed the application and the total time spent, helping you understand how frequently AI tools are being used within the organisation. This information is useful for identifying productivity impact, monitoring adoption of AI tools, and enforcing internal policies around authorised and unauthorised software usage.

<figure><img src="https://1102323068-files.gitbook.io/~/files/v0/b/gitbook-x-prod.appspot.com/o/spaces%2FSrTJQs663dZ9Te4UU3O8%2Fuploads%2FRTFDQOtazxIQsCXimhKl%2Fimage.png?alt=media&amp;token=f6a05e76-12cd-477b-8617-d3834b97a37e" alt=""><figcaption></figcaption></figure>

Click a specific record to view detailed information, including the username, total time spent by each user on the application, and the date when users accessed the application. Use the search box at the top to quickly filter specific information.

<figure><img src="https://1102323068-files.gitbook.io/~/files/v0/b/gitbook-x-prod.appspot.com/o/spaces%2FSrTJQs663dZ9Te4UU3O8%2Fuploads%2FFBrNv9S6i1fAITR1PCsA%2Fimage.png?alt=media&amp;token=3e1651a6-213f-4e99-a08b-4ba4538eb159" alt=""><figcaption></figcaption></figure>

#### **7. Files Uploaded to Generative AI Website Summary**

This widget tracks files uploaded to AI-powered web platforms, such as *ChatGPT*, *Claude*, *Gemini*, *Perplexity, and so on*. It displays the number of users involved and the total upload incidents recorded. Monitoring this widget helps you detect instances where sensitive information may have been shared with online AI systems, which could pose privacy or confidentiality risks. Clicking the widget takes you to the [Files Uploaded to Generative AI Website](#id-8.-files-uploaded-to-generative-ai-website) widget, where you can see more details.

<figure><img src="https://1102323068-files.gitbook.io/~/files/v0/b/gitbook-x-prod.appspot.com/o/spaces%2FSrTJQs663dZ9Te4UU3O8%2Fuploads%2Fg7O2htPY2x5VzJlIL1ii%2Fimage.png?alt=media&amp;token=178878c8-078e-490d-98d6-49a155f1dd34" alt=""><figcaption></figcaption></figure>

#### **8. Files Uploaded to Generative AI Website**

This widget lists all URLs of Generative AI websites, such as *ChatGPT*, *Claude*, *Gemini*, *DeepSeek*, and *so on*, where users uploaded files, along with the number of users and total incidents for each platform. This view helps you pinpoint which specific platforms are most frequently used for file uploads, supporting targeted awareness or restriction policies.

<figure><img src="https://1102323068-files.gitbook.io/~/files/v0/b/gitbook-x-prod.appspot.com/o/spaces%2FSrTJQs663dZ9Te4UU3O8%2Fuploads%2FRvLA3IR6vVPonurqGZ6b%2Fimage.png?alt=media&amp;token=b9d418bf-fa99-4049-8d03-6e7cff496467" alt=""><figcaption></figcaption></figure>

Click a specific record to view detailed information, including the username, violated rule name, date and time of violation, software used to access and upload to the website, and name of the uploaded file.

<figure><img src="https://1102323068-files.gitbook.io/~/files/v0/b/gitbook-x-prod.appspot.com/o/spaces%2FSrTJQs663dZ9Te4UU3O8%2Fuploads%2FnuqOYR0IYzDTKoI5DfNZ%2Fimage.png?alt=media&amp;token=24719fbf-1f42-4961-9c19-0238a42df3d5" alt=""><figcaption></figcaption></figure>

Use the Arrow icon in the **Action** column to further drill down into details like detected content in the uploaded file, PC name, and so on. Use the search box at the top to quickly filter specific information.

<figure><img src="https://1102323068-files.gitbook.io/~/files/v0/b/gitbook-x-prod.appspot.com/o/spaces%2FSrTJQs663dZ9Te4UU3O8%2Fuploads%2FP6OqFHhIQ2pcwNZe4aC9%2Fimage.png?alt=media&amp;token=f585612c-7aab-48d8-9014-88e23c843095" alt=""><figcaption></figcaption></figure>

#### **9. Files Uploaded to Generative AI Application Summary**

This widget helps you monitor when files are uploaded to Generative AI applications, such as desktop versions of AI assistants (e.g. `CHATGPT.EXE`). It shows the total number of users who performed uploads and the total incidents recorded during the selected period. It’s useful for detecting potential data-loss events when corporate files are shared through locally installed AI tools rather than approved platforms. Clicking the widget takes you to the [Files Uploaded to Generative AI Application](#id-10.-files-uploaded-to-generative-ai-application) widget, where you can see more details.

<figure><img src="https://1102323068-files.gitbook.io/~/files/v0/b/gitbook-x-prod.appspot.com/o/spaces%2FSrTJQs663dZ9Te4UU3O8%2Fuploads%2FQcxsWyh9PA66cOSEOI1P%2Fimage.png?alt=media&amp;token=fdcb2cb0-09cb-401d-a2a5-f0218873c3c6" alt=""><figcaption></figcaption></figure>

#### **10. Files Uploaded to Generative AI Application**

This widget shows how many users uploaded files directly into installed Generative AI applications, such as desktop-based AI tools (e.g. `CHATGPT.EXE`), and the total number of upload incidents. It helps you detect when corporate documents, reports, or other sensitive files are shared through local AI software instead of approved channels. This is useful for preventing data leakage through unmanaged or offline AI applications that bypass browser-based monitoring.

<figure><img src="https://1102323068-files.gitbook.io/~/files/v0/b/gitbook-x-prod.appspot.com/o/spaces%2FSrTJQs663dZ9Te4UU3O8%2Fuploads%2FipiEBhvF0VKxaVXMt3EC%2Fimage.png?alt=media&amp;token=d7876b4b-b64a-4913-a883-e6eac9c0dbfc" alt=""><figcaption></figcaption></figure>

Click a specific record to view detailed information, including the username, violated rule name, date and time of violation, and name of the uploaded file.

<figure><img src="https://1102323068-files.gitbook.io/~/files/v0/b/gitbook-x-prod.appspot.com/o/spaces%2FSrTJQs663dZ9Te4UU3O8%2Fuploads%2FcC81OX4npuYEo45Gji0q%2Fimage.png?alt=media&amp;token=77117409-e4e4-4be7-9b5f-76826ee43a83" alt=""><figcaption></figcaption></figure>

Use the **Arrow** icon in the **Action** column to further drill down into details like detected content in the uploaded file, PC name, PC Serial number and so on. Use the search box at the top to quickly filter specific information.

<figure><img src="https://1102323068-files.gitbook.io/~/files/v0/b/gitbook-x-prod.appspot.com/o/spaces%2FSrTJQs663dZ9Te4UU3O8%2Fuploads%2FTbFPk0o2Mnuuhoupe8DP%2Fimage.png?alt=media&amp;token=962ccf5c-c7ac-43aa-8b0f-24ef4a76715c" alt=""><figcaption></figcaption></figure>

#### **11. Sensitive Prompts Used in AI Website Summary**

This widget highlights users who have entered sensitive or policy-violating prompts into AI websites such as *ChatGPT*, *Grok*, or *Perplexity*. It shows the number of users and incidents where monitored or restricted phrases were detected. It helps detect attempts to share confidential content or company-specific information through AI prompts, supporting proactive compliance monitoring. Clicking the widget takes you to the [Sensitive Prompts Used in AI Website](#id-12.-sensitive-prompts-used-in-ai-website) widget, where you can see more details.

<figure><img src="https://1102323068-files.gitbook.io/~/files/v0/b/gitbook-x-prod.appspot.com/o/spaces%2FSrTJQs663dZ9Te4UU3O8%2Fuploads%2FzQdOMUXToqTLaShubFYc%2Fimage.png?alt=media&amp;token=4a403bac-e892-4a5f-84c1-13f21e2e7e68" alt=""><figcaption></figcaption></figure>

#### **12. Sensitive Prompts Used in AI Website**

This widget lists URLs, users, and incident counts where sensitive prompts were entered into AI websites. It helps administrators identify which AI platforms are most frequently used for potentially risky queries or data sharing. It helps you review prompt-level violations, validate DLP detections, and take corrective actions such as user training or access restrictions.

<figure><img src="https://1102323068-files.gitbook.io/~/files/v0/b/gitbook-x-prod.appspot.com/o/spaces%2FSrTJQs663dZ9Te4UU3O8%2Fuploads%2F01GNQ8NsVLHJS0DcyKjK%2Fimage.png?alt=media&amp;token=54ad90e2-c333-4e83-8ef8-62ebe23ee018" alt=""><figcaption></figcaption></figure>

Click a specific record to view detailed information, including the username, violated rule name and date and time of violation.

<figure><img src="https://1102323068-files.gitbook.io/~/files/v0/b/gitbook-x-prod.appspot.com/o/spaces%2FSrTJQs663dZ9Te4UU3O8%2Fuploads%2Fmhtw0VUKuQ1uoW2IZAbN%2Fimage.png?alt=media&amp;token=0a31c8f6-0a7f-460e-a075-4be97ba8b292" alt=""><figcaption></figcaption></figure>

Use the Arrow icon in the **Action** column to further drill down into details like detected content in the website text, PC name, and so on. Use the search box at the top to quickly filter specific information.

<figure><img src="https://1102323068-files.gitbook.io/~/files/v0/b/gitbook-x-prod.appspot.com/o/spaces%2FSrTJQs663dZ9Te4UU3O8%2Fuploads%2FoYHNZr7f3NbWzt4h7z30%2Fimage.png?alt=media&amp;token=dac55d03-ab7f-491d-9fff-ef6fd67273d3" alt=""><figcaption></figcaption></figure>

## Custom Dashboards

You can create your own dashboards to view the data and activities that matter most to you. You can choose the widgets you want to include and apply filters to focus on specific users, time periods, or activities. Creating a custom dashboard helps you monitor key metrics, track usage trends, and quickly access insights relevant to your role, all in one place.

### Create Custom Dashboards

1. Navigate to ***Settings > Dashboard***.
2. Click **+Add New**.<br>

   <figure><img src="https://1102323068-files.gitbook.io/~/files/v0/b/gitbook-x-prod.appspot.com/o/spaces%2FSrTJQs663dZ9Te4UU3O8%2Fuploads%2FbzbSeXgpRHY1yZxr8oa1%2FADD%20NEW%20DAHSBOARD%20BUTTON.png?alt=media&amp;token=7570f051-07b3-497a-b413-4549af12fd92" alt=""><figcaption></figcaption></figure>
3. Enter the Dashboard **Name** and **Description**. Use a clear, descriptive name that reflects the dashboard’s purpose.
4. Select the **Duration** for which you want the data to be displayed (for example, Day, Week, Month, Quarter).
5. Select **Set as Default** if you want this dashboard to be your default and appear first when you open the Dashboard.

   ![](https://content.gitbook.com/content/SrTJQs663dZ9Te4UU3O8/blobs/DC5DUhlHXQhztg93z6JZ/Add%20Custom%20Dashboard%201.png)
6. Select **DLP Rules**. Data Loss Prevention (DLP) Rules are security policies that detect and prevent the unauthorised sharing or transfer of sensitive information. You can select one or more DLP rules to filter dashboard data based on specific monitoring criteria. The selected DLP rules appear in the panel on the right.
7. Select **PC Groups**. PC Groups represent collections of endpoint devices within your organisation (for example, HR Laptops or Finance Desktops). Selecting a PC Group filters the dashboard’s data to activities performed on those specific devices. The selected PC groups appear in the panel on the right.
8. Select **User Groups**. User Groups are sets of users with similar roles, permissions, or departments (for example, IT Team or Sales Department). Selecting user groups allows you to monitor data generated only by those users. The selected User groups appear in the panel on the right.
9. Select the widgets you want to include in the dashboard. Widgets can be selected from different dashboards, such as **General**, **Risks**, **SharePoint**, and **Risks Summary** dashboards. You must select at least one widget to continue.

   ![](https://content.gitbook.com/content/SrTJQs663dZ9Te4UU3O8/blobs/AP1AAPYlC78wYjzfG2zm/Add_Custom_Dashboar_2.png)
10. Click **Save Changes** to create the dashboard.

### Manage Custom Dashboards

After creating a dashboard, you can manage it from ***Settings > Dashboard**.*

![](https://content.gitbook.com/content/SrTJQs663dZ9Te4UU3O8/blobs/gLnIygr92jBdPXah4elN/Navigate_Settings_Dashboard.png)

From this page, you can:

* View the list of all custom dashboards you’ve created.
* Edit an existing dashboard to update its widgets, filters, or duration.
* Delete dashboards that are no longer needed.
* Set any dashboard as the default to make it your primary dashboard view.

  ![](https://content.gitbook.com/content/SrTJQs663dZ9Te4UU3O8/blobs/xbGvY8sxfcEKGQNO4Nc3/Manage_custom_dashboard.png)

### Access Custom Dashboards

To access your dashboards:

1. Go to **Dashboard** from the main navigation menu.
2. Select your custom dashboard from the dropdown list at the top of the page.

   ![](https://content.gitbook.com/content/SrTJQs663dZ9Te4UU3O8/blobs/mEirM4zFrsxiCOwEvs8y/Access_custom_dashboard.png)

The dashboard will load with the widgets and filters you’ve configured. You can switch between dashboards at any time and adjust the time filters.

## Advanced Search

The Advanced Search feature allows you to locate specific activity logs, files, or events more efficiently by applying multiple filters. It helps narrow down large data sets to show only the information you need, such as specific users, PCs, DLP rules, or SharePoint files, saving time and improving data visibility.

You can use Advanced Search to find detailed activity records within a specific date and time range, filter events based on Data Loss Prevention (DLP) rules or PC Groups, search for SharePoint-related activities by site URL, file name, or file path, and so on.

You don’t need to fill every field. Entering even one or two filters will refine your search results.

**To perform an advanced search:**

1. Click the **Search** icon(<i class="fa-magnifying-glass">:magnifying-glass:</i>)located at the top-right corner of the relevant dashboard.
2. Fill in one or more of the available fields:
   1. **Date From / Date To**: Specify the date range for the data you want to view.
   2. **Time From / Time To**: Specify a specific time to narrow the search further.
   3. **Select User Groups**: Filter results by user groups to view activities performed by specific teams or departments.
   4. **Select PC Groups**: Filter results by PC groups to view activities performed by selected endpoint groups, such as HR Laptops or Finance Desktops.
   5. **Select DLP Rules**: Filter results based on defined Data Loss Prevention policies (for example, *Email Attachments*, *File Uploads*, or *Printing of Files*).
   6. **Username**: Search for activities by a specific user.
   7. **PC Name**: View results related to a specific device or workstation.
   8. **Filename**: Search for a particular file by its name.
   9. **SharePoint Site URL**: Locate activities associated with a specific SharePoint site.
   10. **SharePoint File Path**: Search for files by their full SharePoint directory path.
3. Once you’ve entered the filters, click **Search**. If you want to reset all fields and start a new search, click **Clear Search**.

For instance, to find all file-sharing activities from the *Finance Department* PCs between *1st and 11th October*, select the relevant **PC Group**, select **2025-10-01** in **Date From** and **2025-10-11** in **Date To**, and click **Search**. The results will display only activities that match those filters.


# Understanding Your Daily/Weekly Incident Alerts

GuardWare automatically sends two types of scheduled alert reports via email to help you stay on top of user activities and potential risks:

* [**User-Based Incident Alerts**](#user-based-incident-alerts) (Daily/Weekly)
* [**Incident Summary Alerts**](#incident-summary-alerts) (Daily/Weekly)

Both reports are **interactive;** clicking on an item takes you directly to the Dashboard for deeper investigation.

{% hint style="info" %}
**Before opening the links, make sure you’re logged in to the INSIGHT Management Console.**
{% endhint %}

### User-based Incident Alerts

User-based Incident Alerts show user-specific incidents and highlight individuals who may be bypassing policies or engaging in risky behaviour. The daily/weekly alerts help you identify issues early and take timely action.

This feature ensures you receive timely, actionable alerts for critical user-specific risks without needing to log in and manually check the dashboard. This makes it easy to see which users are showing risky behaviour, so security teams can take necessary actions on time.

**What You Will Receive**

Daily/weekly emails containing:

* A list of users displaying risky behaviour
* Number of users and the type of incident associated with each user
* A direct link to view more details in the Dashboard

**How to Check Details**

These emails are clickable. Clicking any incident takes you directly to the relevant Dashboard.

<figure><img src="https://1102323068-files.gitbook.io/~/files/v0/b/gitbook-x-prod.appspot.com/o/spaces%2FSrTJQs663dZ9Te4UU3O8%2Fuploads%2Fl5gI4ZbmbAJGzreod3bP%2FUser-based%20incident%20alert.png?alt=media&amp;token=dbfb0439-79e1-4108-905c-bbc4c7db7d65" alt=""><figcaption></figcaption></figure>

**Example:**\
Clicking **“Emailing of attachments from Corporate Email Address to Non-Corporate Email Address”** takes you to the **Risks Summary > Email Activities** widget in the Dashboard.

From here you can:

* Click an individual record to see username, date and time, sender and recipient addresses, subject, and file name.
* Use the **Arrow icon** in the **Action** column to drill down further.
* Use the **search box** at the top to quickly locate specific information.

<figure><img src="https://1102323068-files.gitbook.io/~/files/v0/b/gitbook-x-prod.appspot.com/o/spaces%2FSrTJQs663dZ9Te4UU3O8%2Fuploads%2FDzKTPc97Wbd3tY4P0TRw%2FRisks%20Summary%20dashboard%20user-specific.png?alt=media&amp;token=74c8058f-986b-4779-83ff-8e1ac39cacab" alt=""><figcaption></figcaption></figure>

Similarly, clicking on a **username** in the alert email takes you to the same widget but **filtered for that specific user**, allowing you to review all their related activities in detail.

<figure><img src="https://1102323068-files.gitbook.io/~/files/v0/b/gitbook-x-prod.appspot.com/o/spaces%2FSrTJQs663dZ9Te4UU3O8%2Fuploads%2FDzKTPc97Wbd3tY4P0TRw%2FRisks%20Summary%20dashboard%20user-specific.png?alt=media&amp;token=74c8058f-986b-4779-83ff-8e1ac39cacab" alt=""><figcaption></figcaption></figure>

#### How to Configure

1. Log in to the GuardWare INSIGHT Management Console.
2. Click **Open Management Console**.
3. Navigate to **Audit Report > Manage Report > User Based Incident Alerts.**
4. Click **Create a new User-based Risk Email**, enter a name for the alert, and choose how often you’d like to receive the alert (**daily, weekly, or monthly**).
5. Click **Create Risk** to define the type of incident you want to track (e.g., file uploads to non-corporate websites, time spent on non-corporate apps). This step sets the foundation for what the alert will monitor.
6. Select **Risk Type**, enter a **Risk Name** and define **Risk parameters** such as **incident thresholds** (e.g., number of files, time duration).
7. Select the **User Groups** you want to monitor and click **Save**.
8. Select the previously created alert name, set a **start** and **end date**, and select the risks you want included.
9. Click **Generate a User-based Risk Email now for these dates** to verify the configurations and generate a test email. Once the setup is complete, you’ll automatically begin receiving emails at the frequency you selected.\ <br>

   <figure><img src="https://1102323068-files.gitbook.io/~/files/v0/b/gitbook-x-prod.appspot.com/o/spaces%2FSrTJQs663dZ9Te4UU3O8%2Fuploads%2FhQvFQouWWaYVzIlnSWu4%2FUser-based%20Incident%20alert%20configure.png?alt=media&amp;token=81931a84-76aa-4565-b84b-8843632b954f" alt=""><figcaption></figcaption></figure>

### Incident Summary Alerts

Incident Summary Alerts provide a high-level overview of all incident categories across your organisation. You’ll see how many users were involved, how many incidents occurred, and the associated risk levels. This gives you a complete snapshot of your security posture in a single email.&#x20;

**What You Will Receive**

Daily/weekly emails summarising:

* Incident categories
* Number of users involved
* Total incidents logged
* Risk levels and severity indicators
* Direct links to relevant Dashboards

**How to Check Details**

Just like the user-based alerts, these emails are interactive as well. Clicking any incident takes you directly to the relevant Dashboard.

<figure><img src="https://1102323068-files.gitbook.io/~/files/v0/b/gitbook-x-prod.appspot.com/o/spaces%2FSrTJQs663dZ9Te4UU3O8%2Fuploads%2F5ajjVARL0P1uNoLNqe9n%2FIncident%20Summary%20report.png?alt=media&amp;token=b5c0727b-0777-461d-b532-7bd57e8a456b" alt=""><figcaption></figcaption></figure>

**Example:**\
Clicking **“Files Uploaded to Generative AI Websites”** takes you to the **Risks Summary > Usage of AI Tools** widget in the Dashboard. This widget displays instances where corporate files have been uploaded to AI-powered platforms such as ChatGPT or claude.ai.

From here you can:

* Click any record to view username, application name, URL, PC name, and violation date and time.
* Use the **Arrow icon** in the **Action** column for deeper investigation
* Use the **search box** to filter specific information quickly.

<figure><img src="https://1102323068-files.gitbook.io/~/files/v0/b/gitbook-x-prod.appspot.com/o/spaces%2FSrTJQs663dZ9Te4UU3O8%2Fuploads%2FSzdseCQDYUggyrZLCZ74%2FUsage%20of%20AI%20tools.png?alt=media&amp;token=f9c4adb6-4b5b-4e58-8431-8a616bbd9ca9" alt=""><figcaption></figcaption></figure>

#### How to Configure

1. Log in to the GuardWare INSIGHT Management Console.
2. Click **Open Management Console**.
3. Navigate to **Audit Report > Manage Report > Incident Summary Alerts.**
4. Click **Create New Risk Summary Email**, enter a name for the alert, and choose how often you’d like to receive the alert (**daily, weekly, or monthly**).
5. Click **Create Risk Set** to define the type of incident you want to track (e.g., file uploads to non-corporate websites, time spent on non-corporate apps). This step sets the foundation for what the alert will monitor.
6. Select **Risk Type**, enter a **Risk Name** and define **Risk parameters** such as **incident thresholds** (e.g., number of files, time duration).
7. Select the **User Groups** you want to monitor and click **Save**.
8. Select the previously created alert name, set a **start** and **end date**, and select the risks you want included.
9. Click **Generate a test Risk Summary Email now for these dates** to verify the configurations and generate a test email. Once the setup is complete, you’ll automatically begin receiving emails at the frequency you selected.\ <br>

   <figure><img src="https://1102323068-files.gitbook.io/~/files/v0/b/gitbook-x-prod.appspot.com/o/spaces%2FSrTJQs663dZ9Te4UU3O8%2Fuploads%2FPLr6l0ChgyoXqlFdxZKG%2FIncident%20Summary%20Alert%20Configure.png?alt=media&amp;token=a3cb45d8-4512-4d55-a095-7230a5e2b6b7" alt=""><figcaption></figcaption></figure>


# INSIGHT FAQs

<details>

<summary>How do I monitor ChatGPT and other AI tools?</summary>

You can monitor ChatGPT, Claude, and other AI or generative-text applications through the Risks Summary Dashboard, Risks Dashboard, General Dashboard, and SharePoint Dashboard (for Microsoft 365 sites).

When you install the INSIGHT Agent on your endpoint devices, it automatically tracks the usage of both approved and non-corporate applications. This includes AI tools opened in browsers or as desktop apps.

To view AI-related activity:

Go to the **INSIGHT Dashboard** and see the following widgets:

| **Dashboard**          | **Widget Name**                                                   | **Purpose / Summary**                                                                                       |
| ---------------------- | ----------------------------------------------------------------- | ----------------------------------------------------------------------------------------------------------- |
| Risk Summary Dashboard | Usage of AI Tools                                                 | Detects when users access or upload files to AI-powered platforms like ChatGPT, Copilot, or Bard.           |
| Risks Dashboard        | Use of Monitored Non-Organisational Applications Summary          | Displays the total users who accessed or interacted with AI or unapproved applications such as ChatGPT.exe. |
|                        | Use of Monitored Non-Organisational Websites Summary              | Tracks users visiting AI-related websites.                                                                  |
|                        | Keystrokes Summary                                                | Detects sensitive or monitored phrases typed into applications or web tools, including AI chat prompts.     |
|                        | Uploads of Data to Non-Corporate Websites Summary                 | Identifies files uploaded to public or non-corporate websites, including AI web platforms.                  |
| General Dashboard      | Website Text Summary                                              | Detects when sensitive text or keywords are entered or posted on external sites such as AI chat interfaces. |
|                        | Website Uploads Summary                                           | Tracks file uploads through browsers, including potential uploads to ChatGPT or similar tools.              |
|                        | Keystrokes Summary                                                | Monitors sensitive words typed on local devices that may indicate data entry into AI platforms.             |
| SharePoint Dashboard   | SharePoint File Download Logs by File Name                        | Displays files downloaded from SharePoint that could later be uploaded to AI tools.                         |
|                        | SharePoint External File Access Logs by File Name or by User Name | Shows external users accessing files, helping correlate with potential AI data uploads.                     |

{% hint style="info" %}
Ensure that ChatGPT and other AI platforms are listed in your **Monitored Non-Organisational Applications** configuration in the INSIGHT Management Console so that INSIGHT can categorise them correctly and include them in your dashboards.
{% endhint %}

</details>

<details>

<summary>How do I monitor the usage of specific websites in the dashboard?</summary>

You can monitor visits to specific websites, such as file-sharing, social media, or AI tools, through the Risks Summary Dashboard, Risks Dashboard, General Dashboard, and SharePoint Dashboard (for Microsoft 365 sites).

| **Dashboard**          | **Widget Name**                                                   | **Purpose / What It Shows**                                                                  |
| ---------------------- | ----------------------------------------------------------------- | -------------------------------------------------------------------------------------------- |
| Risk Summary Dashboard | Usage of Non-Corporate Websites                                   | Shows how much time users spent on non-corporate or unapproved websites.                     |
|                        | Data Transfer using Non-Corporate Websites                        | Displays the number of files uploaded or transferred to public or non-corporate websites.    |
| Risks Dashboard        | Use of Monitored Non-Organisational Websites Summary              | Displays the total users and total duration of activity on monitored non-corporate websites. |
|                        | Uploads of Data to Non-Corporate Websites Summary                 | Tracks the total number of files uploaded to public or non-corporate websites.               |
|                        | Use of Monitored Non-Organisational Websites                      | Lists rule-based violations for access to monitored websites by user and URL.                |
|                        | Uploads of Data to Non-Corporate Websites                         | Displays detailed violation logs for file uploads to unapproved or external websites.        |
| General Dashboard      | Website Uploads Summary                                           | Displays total files uploaded to both corporate and non-corporate websites.                  |
|                        | Website Text Summary                                              | Detects sensitive text or phrases posted on websites, such as in forms or chat fields.       |
|                        | Website Incidents                                                 | Lists website-related violations by URL, rule, and user, showing potential data exposure.    |
|                        | Productivity                                                      | Shows time spent on websites categorised as productive, unproductive, or uncategorised.      |
| SharePoint Dashboard   | SharePoint External File Access Logs by File Name or by User Name | Displays external user access activity through SharePoint URLs.                              |
|                        | SharePoint Anonymous Link Creation by File Name or by User Name   | Shows creation of public or anonymous file-sharing links within SharePoint.                  |

{% hint style="info" %}
For focused analysis, you can create a **Custom Dashboard** that tracks specific websites, applications, or high-risk users.
{% endhint %}

</details>

<details>

<summary>If I change the format of a protected file (for example, saving a DWG as a PDF), is the new file still protected?</summary>

Yes, GuardWare PROTECT ensures that when a protected file is saved or exported into another format or extension (for example, DWG to PDF), the newly created file is also protected.

</details>

<details>

<summary>I want to monitor sensitive financial information. How do I do that?</summary>

You can monitor exposure of financial data, such as credit-card numbers, bank details, invoices, or payroll files, using **Data Loss Prevention (DLP)** rules and dashboard widgets.

1. **Create DLP Rules:**
   1. Add rules to detect financial patterns (e.g., credit-card or BSB numbers) and keywords like *invoice*, *salary*, or *bank account*.
   2. Apply rules to emails, uploads, SharePoint, and endpoint monitoring.
2. **Watch Key Widgets:**

| **Dashboard**          | **Widget Name**                                                   | **Purpose / What It Detects**                                                                                               |
| ---------------------- | ----------------------------------------------------------------- | --------------------------------------------------------------------------------------------------------------------------- |
| Risk Summary Dashboard | Data Transfer using Non-Corporate Websites                        | Detects files containing financial data uploaded to public or unapproved websites.                                          |
|                        | Usage of AI Tools                                                 | Identifies when users paste or upload corporate financial data into AI tools like ChatGPT or Copilot.                       |
| Risks Dashboard        | Uploads of Data to Non-Corporate Websites Summary                 | Tracks files uploaded to external websites, helping detect potential leaks of invoices, bank records, or financial reports. |
|                        | Email Attachments Summary                                         | Monitors financial documents sent as attachments through corporate or personal emails.                                      |
|                        | Keystrokes Summary                                                | Detects sensitive financial details such as card numbers or account details typed into websites, apps, or chats.            |
|                        | Storage Transfer Summary                                          | Displays files containing financial data copied to USB drives or external storage devices.                                  |
| General Dashboard      | DLP Incidents                                                     | Lists all policy violations involving financial data, such as detected account numbers or invoices.                         |
|                        | DLP Incidents Over Time                                           | Shows trends in financial-data policy violations over a selected time period.                                               |
| SharePoint Dashboard   | SharePoint External File Access Logs by File Name or by User Name | Tracks external access to SharePoint files that may include financial data.                                                 |
|                        | SharePoint File Download Logs by File Name                        | Displays which financial documents were downloaded and by whom.                                                             |

3. **Respond Quickly:**
   1. Investigate flagged incidents, remove public links or recall emails if needed, Update rules or whitelist approved systems to minimise false positives.

</details>

<details>

<summary>How do I track clipboard copying?</summary>

Clipboard copying is currently not supported in GuardWare INSIGHT. INSIGHT does not capture or log text or file data copied to the clipboard. However, you can still detect similar data movement activities using other monitoring features:

* **Keystrokes Summary / Keystrokes (Risks Dashboard)**: Detects when users type or paste sensitive information into websites, chat tools, or applications.
* **Data Transfer using Non-Corporate Websites (Risk Summary Dashboard)**: Identifies files uploaded or transferred to public or unapproved websites after being copied locally.
* **Uploads of Data to Non-Corporate Websites Summary (Risks Dashboard)**: Tracks file uploads that could result from copy–paste actions.
* **Storage Transfer Summary**: Monitors when copied data is saved or transferred to USB drives or external storage.

</details>

<details>

<summary>How do I log and review violations?</summary>

GuardWare INSIGHT automatically logs all policy violations detected by the Data Loss Prevention (DLP) rules configured in the Management Console.

To review violations:

1. Go to the General Dashboard
   1. Open the DLP Incidents or DLP Incidents Over Time widgets to view all detected violations.
   2. Each record includes details such as the user name, rule violated, file or activity type, timestamp, and severity level.
2. Drill down for details
   1. Click a specific violation in the DLP Incidents table to open its detailed view.
   2. Review the file path, data type, and related actions (e.g., upload, print, email, or download).
3. Cross-check in the other dashboard.
   1. Use the Risks Dashboard to identify how and where the violation occurred (e.g., via email, USB, or website).
   2. Check the Risk Summary Dashboard for an overview of overall violation trends and severity distribution.

GuardWare INSIGHT does not save or keep a record of your sensitive files. It only keeps records of violations that a user has broken based on configured policies. These violations can be viewed through Audit Reports, which are generated automatically daily. However, if you wish to create incident reports on an ad-hoc basis, you can do so via Audit Reports.

</details>

<details>

<summary>How do I see a user’s web browsing history and time spent per site?</summary>

GuardWare INSIGHT logs all web browsing history and the time spent on each site for enrolled users.

To review:

1. Open the Management Console and go to **User Group**.
2. Select the group that contains the user whose web data you want to review.
3. In the right-hand panel, click **Productivity**, then select **Internet Usage**.
4. Click **Advanced Search** and specify the required date and time range.
5. In the **Username** field, enter the user’s ID and click **Search**.
6. Select **View by Website** to display the results. You will see all websites visited by the user, categorised as Productive, Unproductive, or Uncategorized, along with the time spent on each site.

</details>

<details>

<summary>How do we monitor chat apps and web apps (Slack, Teams, web WhatsApp)?</summary>

GuardWare INSIGHT logs all application usage history and the time spent on each application for enrolled users.

To review:

1. Open the Management Console and go to **User Group**.
2. Select the group that contains the user whose app usage data you want to review.
3. In the right-hand panel, click **Productivity**, then select **App Usage**.
4. Click **Advanced Search** and specify the required date and time range.
5. In the **Software Name** field, enter the name of the application and click **Search.**
6. Select either **View by User** or **View by Application:**

| **View by User**                                                                                                  | **View by Application**                                                                                                 |
| ----------------------------------------------------------------------------------------------------------------- | ----------------------------------------------------------------------------------------------------------------------- |
| If you select **View by User**, you will get a list of users that have used the app in the configured time range. | If you selected **View by Application**, you will get a list of applications that match your search criteria.           |
| Click **Total** to view the app usage of the selected user in more detail.                                        | Click **Total Duration** to see the users who have opened or interacted with the application in the selected timeframe. |
| Click **View Chart** to look the app usage statistics (per-hour).                                                 | You can also see how long the user has interacted with the application in the **Total Duration** column.                |

</details>

<details>

<summary>How do I automate remediation (move/delete) of sensitive files?</summary>

Guardware **INSIGHT is designed exclusively for monitoring and controlling user behavior**, including activities such as data access, file usage, uploads, and policy violations. Its capabilities focus on visibility, detection, logging, and blocking of user actions.

Automated remediation is an **exclusive capability of Guardware DISCOVER**. It supports remediation workflows that enable administrators to **move, delete, or notify the device/data owner** of sensitive files.

</details>

<details>

<summary>How to speed up INSIGHT client performance?</summary>

Client performance depends on how frequently the endpoint communicates with the server for commands, policies, and status updates. To improve client responsiveness, adjust the communication intervals between the client and server.

**Steps:**

1. Log in to the INSIGHT Management Console.
2. Navigate to **PC Group**.
3. Right-click the required PC.
4. Click **Client Server Communication**.

**Recommended configuration**

* **Client Server Interval**: Reduce this value to allow the client to check for commands more frequently.
* **Settings Interval**: Reduce this value so policy and DLP rule changes are applied faster.
* **Client Status Interval**: Reduce this value to receive more frequent updates on PC status (online/offline).

Lowering these intervals ensures faster communication and quicker application of changes.

</details>

<details>

<summary>How to speed up reporting performance?</summary>

Reporting performance depends on how efficiently the client collects and uploads data to the server. To speed up report generation and upload, adjust the report settings.

**Steps:**

1. Log in to the INSIGHT Management Console.
2. Navigate to **PC Group**.
3. Right-click the required PC.
4. Click **Report Settings**.

**Recommended configuration**

* **Report Packet Size**: Increase this value to send more data in a single upload.
* **Report Interval**: Reduce this value so the client checks more frequently for reports to upload.
* **Bulk Report Time**: Reduce this value to trigger more frequent report uploads.

These changes help reduce delays in report availability.

</details>


# Uninstall INSIGHT Agent

You can uninstall the INSIGHT Agent using either the Management Console or the uninstaller file.

## Uninstall via Management Console

Use this method to remotely uninstall the agent from a PC.

1. Navigate to **Settings Panel > Maintenance > Client > Status**.&#x20;
2. Select the required PC.<br>

   <figure><img src="https://1102323068-files.gitbook.io/~/files/v0/b/gitbook-x-prod.appspot.com/o/spaces%2FSrTJQs663dZ9Te4UU3O8%2Fuploads%2FaI2sOfonyAwKfEATpfte%2FUninstall%20INSIGHT%20Agent.png?alt=media&amp;token=d1058631-e0ee-44c4-af8d-d667f2835c4b" alt=""><figcaption></figcaption></figure>
3. Choose one of the following:
   1. **Uninstall PC**: Uninstalls the INSIGHT Agent from the selected endpoint.
      1. In **Uninstall Mode**, select **Upon next start-up** to perform the uninstallation the next time the system restarts, or select **Immediately** to start the uninstallation right away.
   2. **Delete PC**: Uninstalls the INSIGHT Agent from the selected endpoint. Deleting the selected PC permanently removes all associated history and related details. You must uninstall the PC first before deleting it.
4. Click **Submit**.

## Uninstall via Uninstaller File

Use this method to uninstall the agent directly from a PC.

1. Right-click the uninstaller file and select **Run as administrator**.
2. Click **Yes** in the confirmation pop-up.\
   ![](https://1102323068-files.gitbook.io/~/files/v0/b/gitbook-x-prod.appspot.com/o/spaces%2FSrTJQs663dZ9Te4UU3O8%2Fuploads%2Fb5M7K2Ug2jV6nadA4wAA%2FUninstall%20Agent%201.png?alt=media\&token=0ccb23be-1b6e-46c9-bee2-118e64e8ea88)
3. If there are any open applications that should be closed before continuing to uninstall, a pop-up appears, select **Automatically close applications and attempt to restart them after setup is complete** and click **Ok**.\
   ![](https://1102323068-files.gitbook.io/~/files/v0/b/gitbook-x-prod.appspot.com/o/spaces%2FSrTJQs663dZ9Te4UU3O8%2Fuploads%2FXJd3PKsmmHGqlXLkl9cF%2FUninstall%20Agent%202.png?alt=media\&token=02fc7e5c-58cf-4a3f-be04-7224d0e65c8e)
4. &#x20;The uninstallation process will complete.


# User Policies

**User Policies** define how user activities are monitored, governed, and controlled within the organisation. User policies help organisations to monitor and prevent risky actions such as accessing restricted applications, transferring sensitive data, or using unauthorised devices. Policies also help protect sensitive data across applications, websites, devices, and other system activities.&#x20;

By creating user policies, an organisation can enforce governance, security controls and monitoring  according to organisational requirements across multiple areas:

* **Monitor user activity:** Track how users interact with applications, websites, networks, and files.
* **Restrict risky behaviour:** Block access to unauthorised applications, websites, or devices.
* **Protect sensitive data:** Detect and control how sensitive information is shared across different channels, such as email, uploads, printing, or keystrokes.
* **Enforce consistent rules:** Apply the same security configuration to multiple users through a single policy.

## Add a User Policy

1. Navigate to ***INSIGHT > User Policies***.
2. Click **New User Policy.**
3. **Policy Info**:
   1. In **Import Settings**, select an existing policy if you want to import the settings from any existing policy.
   2. Enter the **policy name**.
   3. Enter a **description** for the policy. The description must be at least 10 characters long.
   4. Select **Set as default policy (Only one default policy is allowed)** if you want to set this policy as the default. \
      The **Default Policy** is automatically applied to all newly created users or users who are not assigned to any user policy.
   5. Click **Continue**.<br>

      <figure><img src="https://1102323068-files.gitbook.io/~/files/v0/b/gitbook-x-prod.appspot.com/o/spaces%2FSrTJQs663dZ9Te4UU3O8%2Fuploads%2FaAiz1nCO1sFby1WV3WNg%2FAdd%20new%20policy%20-%20Screen%201.png?alt=media&amp;token=372c665c-e4c0-4d84-8500-e47118e18d24" alt=""><figcaption></figcaption></figure>
4. In **Environment Setting**, configure how user activities are monitored and controlled across applications, websites, devices, and network connections. These settings help administrators enforce acceptable usage policies, detect risky behaviour, and prevent unauthorised actions that could expose sensitive data.\ <img src="https://1102323068-files.gitbook.io/~/files/v0/b/gitbook-x-prod.appspot.com/o/spaces%2FSrTJQs663dZ9Te4UU3O8%2Fuploads%2FoR1Q5KBGVkOJu6MX3mCR%2FEnvironment%20settings%20-%20Screen%202.png?alt=media&amp;token=c0db547b-e6a2-4bec-a9eb-b208d24f51c7" alt="" data-size="original">
   1. **Application Usage**: Enable **Application Usage** to monitor the applications used by users.<br>

      You can also configure application restrictions by enabling:

      1. **Block Application:** Enable **Block Application** to block specific applications from being accessed. You can restrict access to specific applications that are not approved for use within the organisation. \
         Blocking applications can help prevent data leakage, reduce security risks from untrusted software, and enforce organisational security policies.

         For example, you can block file sharing tools, unauthorised cloud storage applications, remote access tools, and peer-to-peer applications.<br>

         To view or configure blocked applications:

         1. In Blocked Applications, click **Detail.**<br>

            <figure><img src="https://1102323068-files.gitbook.io/~/files/v0/b/gitbook-x-prod.appspot.com/o/spaces%2FSrTJQs663dZ9Te4UU3O8%2Fuploads%2Fef7v4PMlHBFuIGHiZobu%2FBlock%20application%20-%20Detail%20button.png?alt=media&amp;token=96b3f0fc-55a2-41b4-bdc1-461e664b2d96" alt=""><figcaption></figcaption></figure>
         2. Search for the application that you want to block for users, select it, and click **Confirm**.\
            ![](https://1102323068-files.gitbook.io/~/files/v0/b/gitbook-x-prod.appspot.com/o/spaces%2FSrTJQs663dZ9Te4UU3O8%2Fuploads%2FUAeLNVBtsr5kfpNpzVbE%2FBlocked%20application%20control.png?alt=media\&token=a04d3b77-67a7-42ee-af49-46996ccd30c7)
         3. If you do not find the application you are looking for, enter the application's name and click **Add Application.** We recommend entering the name in uppercase and including the file extension, for example, `WHATSAPP.EXE`.
         4. After the application is added, select it and click **Confirm**.
   2. **Website Usage**: Enable **Website Usage** to monitor websites accessed by users.

      You can also configure website restrictions by enabling:

      1. **Block Website:** Enable **Block Website** to block users from accessing specific websites that may pose security risks or violate organisational policies. This can help reduce exposure to malicious websites, prevent access to unauthorised services, and support compliance requirements.\
         For example, you can block file-sharing websites, unauthorised cloud storage platforms, high-risk domains, and non-work-related websites.\
         To view or configure blocked websites:
         1. In Blocked Websites, click **Detail.**<br>

            <figure><img src="https://1102323068-files.gitbook.io/~/files/v0/b/gitbook-x-prod.appspot.com/o/spaces%2FSrTJQs663dZ9Te4UU3O8%2Fuploads%2FdWBUH0IaKj99DxEIwHtM%2FBlock%20website%20-%20Detail%20button.png?alt=media&amp;token=9ba0dd5f-7e6d-47f4-ab0f-a519e1f6b1cd" alt=""><figcaption></figcaption></figure>
         2. Search for the website, select it, and click **Confirm**.\
            ![](https://1102323068-files.gitbook.io/~/files/v0/b/gitbook-x-prod.appspot.com/o/spaces%2FSrTJQs663dZ9Te4UU3O8%2Fuploads%2Fmo8OKTQCRGoyYPFKrfAn%2FBlocked%20website%20control.png?alt=media\&token=4a9d91ae-c1b5-4d37-bd48-c399ab4e97c3)
         3. If you do not find the website you are looking for, enter the website's URL and click **Add Website.**
         4. After the website is added, select it and click **Confirm**.
   3. **USB/Storage Device Control:** This setting controls how removable storage devices, such as USB drives and external storage media, are monitored on users' devices. It helps prevent sensitive data from being copied or transferred outside the organisation.
      1. **Off:** No monitoring or restrictions are applied.
      2. **Block:** Prevents users from transferring any files to the USB or other storage devices.
      3. **Monitor:** Monitors the files being transferred to USB or other storage devices, including detecting transferred files, identifying sensitive content, monitoring device insertion, and tracking changes made to files on the USB.
   4. **Archive Files:** Enable **Archive Files** to monitor compressed or archived files such as ZIP or RAR files. Archive monitoring helps detect attempts to conceal sensitive data within compressed files before transferring or sharing them.
      1. **Password-Protected Archives:** Enable **Password-Protected Archives** to monitor archive files that are protected with passwords. INSIGHT cannot read the content or access files inside the password-protected archives, but it can monitor the movement of such archives.
      2. **Password-Protected Document:** Enable **Password-Protected Document** to monitor documents that are protected with passwords. INSIGHT cannot read the content inside the password-protected documents, but it can monitor the movement of such documents.
   5. **Network Access & Connectivity**: Enable **Network Access & Connectivity** to monitor user activities related to network connections and data transfers over the network. When enabled, INSIGHT monitors how users access network resources and interact with external or internal networks.

      INSIGHT tracks activities such as:

      * **Connecting to external networks:** For example, when a user connects their device to a new Wi-Fi network, such as a public hotspot or an unsecured network.
      * **Accessing internal network resources:** For example, when users access shared drives, internal servers, or company network services.
      * **Establishing remote connections:** For example, when users connect to remote systems using tools such as VPN, Remote Desktop, or SSH.
      * **Connecting to unknown or suspicious IP addresses:** For example, connections made to unfamiliar external IP addresses or domains.
      * **Network file transfers:** For example, when files are uploaded or downloaded over network connections.
      * **Changes in network connectivity:** For example, switching between networks (e.g., from a corporate network to public Wi-Fi).
      * **Accessing cloud services over the network:** For example, connections to cloud storage or web services used to transfer or access files.
   6. **Image & Document OCR**: Enable **Image & Document OCR** to monitor images and documents using Optical Character Recognition (OCR) to detect sensitive information embedded within them. When enabled, INSIGHT can analyse images and documents to detect sensitive information that may not be visible through standard text-based inspection. \
      By using OCR, INSIGHT extracts text from images and documents to identify whether they contain sensitive data such as personal information, financial details, identification numbers, or other protected information.
   7. **Display Icon in System Tray**: Enable **Display Icon in System Tray** to display the **INSIGHT agent icon** in the user’s system tray. This allows users to see that their activities on the device are being monitored.
   8. **Classify Office Documents**: Enable **Classify Office Documents** to add GuardWare classification labels in the Microsoft Office Standalone version. Users must apply a classification label before saving Office documents. This helps ensure that sensitive or confidential information is properly identified. Depending on the configured policy, labels can define the sensitivity level of documents and apply visual markings such as headers, footers, or watermarks.
   9. **Classify Emails in Outlook**: Enable **Classify Emails in Outlook** to enforce the classification of emails in Microsoft Outlook. Users must apply a classification label before sending emails, helping ensure that sensitive information is properly categorised and handled according to organisational policies.
5. After enabling the necessary settings, click **Continue**.
6. In **Data Type Selection**, select the types of sensitive data that should be monitored or controlled under the policy. Here, you will see a list of predefined data types that INSIGHT can monitor.\
   \
   You can configure monitoring or enforcement actions for different data types across various activities, such as emails, websites, application uploads, keystrokes, and printed files. This allows administrators to enforce different levels of protection depending on the type of activity and the sensitivity of the data.\
   \
   You can review each data type and configure how it should be handled within the policy. Use the search and filter options at the top of the table to quickly locate specific data types.\
   \
   The table lists all available data types along with their configuration details.

   <table data-header-hidden><thead><tr><th width="211.20001220703125">Column</th><th>Description</th></tr></thead><tbody><tr><td><strong>Column</strong></td><td><strong>Description</strong></td></tr><tr><td><strong>ALL DATA TYPES</strong></td><td>Displays the name of the sensitive data type being monitored.</td></tr><tr><td><strong>NATURE</strong></td><td>Indicates the detection method used to identify the data type.</td></tr><tr><td><strong>CONTROL MODE</strong></td><td>Defines how the system handles the detected data.</td></tr><tr><td><strong>ASSIGNED POLICIES</strong></td><td>Shows the policies currently associated with the data type.</td></tr><tr><td><strong>EMAIL BODY</strong></td><td>Monitors sensitive data within the content of emails.</td></tr><tr><td><strong>EMAIL ATTACHMENT</strong></td><td>Monitors attachments sent through email.</td></tr><tr><td><strong>WEBSITE UPLOAD</strong></td><td>Monitors sensitive data uploaded to websites.</td></tr><tr><td><strong>APPLICATION UPLOAD</strong></td><td>Monitors files uploaded through applications.</td></tr><tr><td><strong>PRINTED FILES</strong></td><td>Monitors sensitive data in files being printed.</td></tr><tr><td><strong>KEYSTROKE</strong></td><td>Monitors typed data that may contain sensitive information.</td></tr><tr><td><strong>WEBSITE TEXTS</strong></td><td>Monitors sensitive data entered into website forms.</td></tr><tr><td><strong>STORAGE MEDIA</strong></td><td>Monitors sensitive data transferred to storage media</td></tr><tr><td><strong>DOCUMENT ACCESS</strong></td><td>Monitors sensitive data in document access</td></tr></tbody></table>

   \
   To configure a data type:

   1. Click the **Edit** icon on a data type. If you want to configure multiple data types at once, select the data types you want to configure and click **Apply Bulk**.<br>

      <figure><img src="https://1102323068-files.gitbook.io/~/files/v0/b/gitbook-x-prod.appspot.com/o/spaces%2FSrTJQs663dZ9Te4UU3O8%2Fuploads%2F5AlPKwMQmShxWq6NQkwV%2FEdit%20data%20type.png?alt=media&amp;token=a9ee1f97-262f-4215-a79f-a15f68165708" alt=""><figcaption></figcaption></figure>
   2. Select the activities where these data types should be monitored.\
      ![](https://1102323068-files.gitbook.io/~/files/v0/b/gitbook-x-prod.appspot.com/o/spaces%2FSrTJQs663dZ9Te4UU3O8%2Fuploads%2FBXj7VSSkXmQVyW3iEiEp%2FData%20type%20monitoring%20action.png?alt=media\&token=73389c3d-f726-4eef-bd50-422c948201ff)
   3. Select the action mode:
      1. **Off**: No monitoring or enforcement is applied for the selected data type.
      2. **Block**: INSIGHT blocks any activities that are selected when the specified data type is detected.
      3. **Monitor**: INSIGHT monitors the data type in the selected activities and records related activities.
      4. **Warn**: INSIGHT alerts the user when the specified data type is detected in the selected activities.<br>

         <table><thead><tr><th width="126.20001220703125">Activities</th><th width="171">Block</th><th width="183.4000244140625">Monitor</th><th>Warn</th></tr></thead><tbody><tr><td><strong>Email Body</strong></td><td>Blocks the email from being sent if the specified data type is detected in the email body.</td><td>Monitors the email content and records activities when the specified data type is detected in the email body.</td><td>Displays a warning and records activities when the specified data type is detected in the email body, but allows the email to be sent.</td></tr><tr><td><strong>File Upload to Application</strong></td><td>Blocks users from uploading a file to an application if the specified data type is detected in the file.</td><td>Monitors file uploads and records activities when the specified data type is detected.</td><td>Displays a warning and records activities when the specified data type is detected while uploading a file to an application, but allows the upload.</td></tr><tr><td><strong>Printing of Files</strong></td><td>Monitors print activity and records details when the specified data type is detected, but does not block any activities.</td><td>Monitors print activity and records details when the specified data type is detected.</td><td>Displays a warning and records activities when the specified data type is detected in the file being printed, but allows printing.</td></tr><tr><td><strong>File Uploaded to Website</strong></td><td>Blocks file uploads to websites if the specified data type is detected in the file.</td><td>Monitors file uploads to websites and records activities when the specified data type is detected.</td><td>Displays a warning and records activities when the specified data type is detected in the file being uploaded to a website, but allows the upload.</td></tr><tr><td><strong>Keystroke</strong></td><td>Monitors and records keystrokes when the specified data type is entered, but does not block any activities.</td><td>Monitors and records keystrokes when the specified data type is entered.</td><td>Displays a warning and records activities when the specified data type is entered, but allows users to send the content.</td></tr><tr><td><strong>Website Posts (Texts)</strong></td><td>Blocks text from being posted to the website if the specified data type is detected in the text.</td><td>Monitors posted text and records activities when the specified data type is detected.</td><td>Displays a warning and records activities when the specified data type is detected, but allows the post.</td></tr><tr><td><strong>Transfer to Storage Media</strong></td><td>Blocks file transfers to storage media if the specified data type is detected in the file.</td><td>Monitors file transfers to storage media and records activity when the specified data type is detected.</td><td>Displays a warning and records activities when the specified data type is detected in the files being transferred to storage media, but allows the transfer.</td></tr><tr><td><strong>Document Access</strong></td><td>Blocks access to a document if the specified data type is detected in the document.</td><td>Monitors document access and records activity when the specified data type is detected.</td><td>Displays a warning and records activities when the specified data type is detected in a document, but allows access.</td></tr><tr><td><strong>Email Attachments</strong></td><td>Blocks the email from being sent if the specified data type is detected in the email attachment.</td><td>Monitors the email content and records activities when the specified data type is detected in the email attachment.</td><td>Displays a warning and records activities when the specified data type is detected in the email attachment, but allows the email to be sent.</td></tr></tbody></table>
   4. Click **Apply To This Row.** If you want to remove all selections for a data type, click **Clear This Row**.
7. Click **Continue**.
8. Review the configurations and click **Confirm** if everything is correct.\
   ![](https://1102323068-files.gitbook.io/~/files/v0/b/gitbook-x-prod.appspot.com/o/spaces%2FSrTJQs663dZ9Te4UU3O8%2Fuploads%2F4ucqexWy4zlLsGdsFnHP%2FReview%20and%20Confirm.png?alt=media\&token=68b11179-c62b-4c73-aa11-542c735db34e)

You will see the newly created user policy on the **User Policies** list. Once a policy is created, you can assign it to users, and INSIGHT begins monitoring user activity based on the configured settings.

When a defined condition is met (for example, sensitive data is detected on an application or document, INSIGHT takes the configured action, such as recording the activity, displaying a warning, and blocking the action. This ensures that user activity is continuously monitored and controlled according to organisational security requirements.

## Assign Users to a User Policy

To assign users to a user policy:

1. Navigate to ***INSIGHT > User Policies***.
2. Find the policy where you want to assign users and click **Assign Users** in the **ACTIONS** column.<br>

   <figure><img src="https://1102323068-files.gitbook.io/~/files/v0/b/gitbook-x-prod.appspot.com/o/spaces%2FSrTJQs663dZ9Te4UU3O8%2Fuploads%2Fw3nwWdKPwJQ4HJP9yaZn%2FAssign%20users%20to%20policy.png?alt=media&amp;token=2607e6ff-085b-41a1-bc50-4c54eaf7e634" alt=""><figcaption></figcaption></figure>
3. Filter the users by selecting the Security Group and Location. You can also search for a user using the search bar.
4. Enable **Assign New Users only** \<TBD> if you want to filter only users who are not assigned to any policy yet.
5. Select the users you want to assign the policy to and click **Assign**. \
   ![](https://1102323068-files.gitbook.io/~/files/v0/b/gitbook-x-prod.appspot.com/o/spaces%2FSrTJQs663dZ9Te4UU3O8%2Fuploads%2FRhm5YwNN8LRVTqc0N81O%2FAssign%20users%20to%20policy%20-%20Screen%202.png?alt=media\&token=38841e24-6c75-4b79-b6e1-8854d811322f)
6. If the selected users are already assigned to another policy, a confirmation message appears. Click **Yes, Assign** to replace their existing policy with the new policy.

## View User Policy Details

To view the policy details:

1. Navigate to ***INSIGHT > User Policies***.
2. Find the policy you want to view and in the **ACTIONS** column, click the **View** icon.\
   \
   The policy overview page opens, where you can review its configuration, including applied rules, selected activities, and enforcement settings.<br>

   <figure><img src="https://1102323068-files.gitbook.io/~/files/v0/b/gitbook-x-prod.appspot.com/o/spaces%2FSrTJQs663dZ9Te4UU3O8%2Fuploads%2F0tNldaJhfu0CJTzpEPen%2FView%20user%20policy.png?alt=media&amp;token=44e2f9b2-1fa1-4530-a4f5-3f1d02bb9d3b" alt=""><figcaption></figcaption></figure>

## Edit User Policy

To edit a user policy:

1. Navigate to ***INSIGHT > User Policies***.
2. Find the policy you want to edit and in the **ACTIONS** column, click the **Edit** icon.<br>

   <figure><img src="https://1102323068-files.gitbook.io/~/files/v0/b/gitbook-x-prod.appspot.com/o/spaces%2FSrTJQs663dZ9Te4UU3O8%2Fuploads%2FJyYiDcaYo21Ivvq55XU2%2FEdit%20user%20policy.png?alt=media&amp;token=6db399e6-6221-4e58-a401-2c1ff9037c60" alt=""><figcaption></figcaption></figure>
3. Edit the details and click **Confirm**.

## Delete User Policy

To delete a user policy:

1. Navigate to ***INSIGHT > User Policies***.
2. Find the policy you want to delete and in the **ACTIONS** column, click the **Delete** icon.<br>

   <figure><img src="https://1102323068-files.gitbook.io/~/files/v0/b/gitbook-x-prod.appspot.com/o/spaces%2FSrTJQs663dZ9Te4UU3O8%2Fuploads%2FPl8TIZ86rVpFdFcO5Z8V%2FDelete%20user%20policy.png?alt=media&amp;token=85701b67-8d99-4c9d-a775-a4ac42bd446e" alt=""><figcaption></figcaption></figure>
3. Click **Yes, delete** in the confirmation alert.


# Organisation Settings

**Organisation Settings** lets you manage key organisation-wide settings. You can define working days and hours, classify applications, websites, printers, email domains, and USB devices as *organisational* and *non-organisational*, manage trusted email addresses, configure monitored OneDrive folders, identify AI tools, and mark SharePoint libraries as sensitive.&#x20;

These settings improve monitoring accuracy and reduce false positives. Policies can be applied differently to organisational and non-organisational resources, and sensitive data can be restricted from being shared with untrusted websites, applications, printers, or email domains.

## Working Days

The Working Days section shows your organisation’s official working days and hours. These settings help INSIGHT distinguish between working and non-working time, ensuring that productivity and activity tracking are accurate.

To configure your working days and hours:

1. Navigate to ***INSIGHT > Organisation Settings***.
2. Click **Working Days**.
3. Select the days and working hours during which your organisation operates.
4. Click **Save.**

<figure><img src="https://1102323068-files.gitbook.io/~/files/v0/b/gitbook-x-prod.appspot.com/o/spaces%2FSrTJQs663dZ9Te4UU3O8%2Fuploads%2FmollFwAvgp32JURGQXis%2FWorking%20Days.png?alt=media&amp;token=5a105ce9-60e3-46c5-8ad6-3db63f0eba4a" alt=""><figcaption></figcaption></figure>

## Printers

The Printers section lists all printers accessed by users within your organisation, along with usage details such as the number of users who accessed each printer and the number of files printed through it.

Classify each printer as **organisational** or **non-organisational.** This helps monitor and control which printers are considered trusted and which may pose a risk of data leakage.

To classify printers:

1. Navigate to ***INSIGHT > Organisation Settings***.
2. Click **Printers.**
3. Select the printers, click the dropdown in the top-right of the section, and select **Organisational** or **Non-organisational.**<br>

   <figure><img src="https://1102323068-files.gitbook.io/~/files/v0/b/gitbook-x-prod.appspot.com/o/spaces%2FSrTJQs663dZ9Te4UU3O8%2Fuploads%2Fd8hzgsLgx3KVzs0c9roj%2FPrinters.png?alt=media&amp;token=d6b2106b-2b0e-4056-8e8e-2fb217e775b3" alt=""><figcaption></figcaption></figure>
4. Click **Save.**
5. Click **Yes, update** in the confirmation box.

## Websites

The Websites section lists all websites accessed by users within your organisation, along with usage details such as the number of users who visited each website and the total time spent on it.

Classify the websites as **organisational** or **non-organisational.** This helps distinguish work-related browsing from non-work activity, enabling better productivity analysis and enforcement of web usage policies.

To classify websites:

1. Navigate to ***INSIGHT > Organisation Settings***.
2. Click **Websites.**
3. Select the websites, click the dropdown in the top-right of the section, and select **Organisational** or **Non-organisational.**<br>

   <figure><img src="https://1102323068-files.gitbook.io/~/files/v0/b/gitbook-x-prod.appspot.com/o/spaces%2FSrTJQs663dZ9Te4UU3O8%2Fuploads%2FVvKqNpIuFZ6xXloE66S8%2Fwebistes.png?alt=media&amp;token=5c75d963-16e4-4213-813e-967cd5724848" alt=""><figcaption></figcaption></figure>
4. Click **Save.**
5. Click **Yes, update** in the confirmation box.

## Applications

The Applications section lists all applications accessed by users within your organisation, along with usage details such as the number of users who used each application and the total time spent on it. You can classify applications as **organisational** or **non-organisational.** This helps identify which applications contribute to work and which may impact productivity, allowing you to apply appropriate controls and policies.

To classify applications:

1. Navigate to ***INSIGHT > Organisation Settings***.
2. Click **Applications.**
3. Select the applications, click the dropdown in the top-right of the section, and select **Organisational** or **Non-organisational.**<br>

   <figure><img src="https://1102323068-files.gitbook.io/~/files/v0/b/gitbook-x-prod.appspot.com/o/spaces%2FSrTJQs663dZ9Te4UU3O8%2Fuploads%2FhxYY9tyJvEqyNgswTG1Z%2FApplications.png?alt=media&amp;token=07b6ea9a-a87e-4949-8499-4b511425a51f" alt=""><figcaption></figcaption></figure>
4. Click **Save.**
5. Click **Yes, update** in the confirmation box.

## Email Domains

The Email Domains section lists all domains used in email communication by users within your organisation, along with the total number of emails sent through each domain.

Classify the email domains as **organisational, insecure** or **undefined.** This helps monitor external communication and reduce the risk of sensitive data being shared with untrusted domains.

To classify email domains:

1. Navigate to ***INSIGHT > Organisation Settings***.
2. Click **Email Domains.**
3. Select the email domains, click the dropdown in the top-right of the section, and select **Organisational, Insecure** or **Undefined.**<br>

   <figure><img src="https://1102323068-files.gitbook.io/~/files/v0/b/gitbook-x-prod.appspot.com/o/spaces%2FSrTJQs663dZ9Te4UU3O8%2Fuploads%2F5yd1G6CmcNoGy684U4HE%2FEmail%20domains.png?alt=media&amp;token=695cb3f5-03a1-4bd5-a358-32b2477ad861" alt=""><figcaption></figcaption></figure>
4. Click **Save.**
5. Click **Yes, update** in the confirmation box.

## Trusted Emails

The Trusted Emails section lists email addresses considered safe and excluded from certain monitoring or policy actions.

Add or remove specific email addresses to a trusted list to minimise false positives.

To add a trusted email:

1. Navigate to ***INSIGHT > Organisation Settings***.
2. Click **Trusted Emails**.
3. In the **Add trusted email** text box, enter the email address and click **Add.**<br>

   <figure><img src="https://1102323068-files.gitbook.io/~/files/v0/b/gitbook-x-prod.appspot.com/o/spaces%2FSrTJQs663dZ9Te4UU3O8%2Fuploads%2FuvrXFDjTj0vEPGJgziNt%2FTrusted%20emails.png?alt=media&amp;token=75540d54-4701-4008-a3df-dfa44c672428" alt="" width="375"><figcaption></figcaption></figure>
4. Click **Yes, add** in the confirmation box.

To remove an email from the trusted email list:

1. Navigate to ***INSIGHT > Organisation Settings***.
2. Click **Trusted Emails**.
3. Find the email address you want to remove and click the Remove icon in the **ACTIONS** column.<br>

   <figure><img src="https://1102323068-files.gitbook.io/~/files/v0/b/gitbook-x-prod.appspot.com/o/spaces%2FSrTJQs663dZ9Te4UU3O8%2Fuploads%2F0mFaqrIFWPS38mvQDJZO%2FRemove%20trusted%20email.png?alt=media&amp;token=0997d70e-9929-4bc1-895a-cd904ca2ac57" alt="" width="375"><figcaption></figcaption></figure>
4. Click **Yes, delete** in the confirmation box.

## USBs

The USBs section lists all removable storage devices accessed by users within your organisation, along with usage details such as the number of users who accessed each USB device and the number of files transferred.&#x20;

Classify the USBs as **organisational** or **non-organisational.** This helps prevent unauthorised data transfers and protects sensitive information from being copied outside the organisation.

To classify a USB:

1. Navigate to ***INSIGHT > Organisation Settings***.
2. Click **USBs.**
3. Select the USBs, click the dropdown in the top-right of the section, and select **Organisational** or **Non-organisational.**<br>

   <figure><img src="https://1102323068-files.gitbook.io/~/files/v0/b/gitbook-x-prod.appspot.com/o/spaces%2FSrTJQs663dZ9Te4UU3O8%2Fuploads%2FE2g3HYLLLCgdPg5482FJ%2FUSB.png?alt=media&amp;token=323ff51e-867b-41c5-848c-7b51ebb1a80f" alt=""><figcaption></figcaption></figure>
4. Click **Save.**
5. Click **Yes, update** in the confirmation box.

## OneDrive Folder

The OneDrive Folder section displays your organisation’s OneDrive folders that are monitored for file activities.

Add or remove OneDrive folders to control which files and locations are included in monitoring and policy enforcement. This allows you to focus on relevant data while avoiding unnecessary monitoring.

To add a OneDrive folder:

1. Navigate to ***INSIGHT > Organisation Settings***.
2. Click **OneDrive Folder**.
3. In the **Add OneDrive Folder** textbox, enter the folder path that should be monitored and click **Add**. This is typically the root folder or a specific subfolder path within your organisation’s OneDrive.<br>

   <figure><img src="https://1102323068-files.gitbook.io/~/files/v0/b/gitbook-x-prod.appspot.com/o/spaces%2FSrTJQs663dZ9Te4UU3O8%2Fuploads%2FINxq8mYlIlNnYcbbdSy5%2FAdd%20OneDrive%20folder.png?alt=media&amp;token=cae3babc-b5c3-4167-b7a5-c3f917fdecaa" alt=""><figcaption></figcaption></figure>
4. Click **Yes, add** in the confirmation box.

To remove a OneDrive folder:

1. Navigate to ***INSIGHT > Organisation Settings***.
2. Find the OneDrive Folder you want to remove and click the **Remove** icon in the **ACTIONS** column.<br>

   <figure><img src="https://1102323068-files.gitbook.io/~/files/v0/b/gitbook-x-prod.appspot.com/o/spaces%2FSrTJQs663dZ9Te4UU3O8%2Fuploads%2FVC7eycTg2YFi5r6w3d2J%2FRemove%20OneDrive%20folder.png?alt=media&amp;token=0305ce4d-2d5f-4a27-a84f-9f705ce6d460" alt=""><figcaption></figcaption></figure>

## AI Usages

The AI Usages section lists all websites and applications accessed by users within your organisation, along with usage details such as the number of users who used each website or application and the total time spent on each.

Classify websites and applications as **AI** or **Undefined** to ensure accurate tracking and reporting of AI tools across your organisation, since there is no automatic detection to identify AI tools correctly.

To classify AI tools:

1. Navigate to ***INSIGHT > Organisation Settings***.
2. Click **AI Usages.**
3. Click the **AI Websites** tab.
4. Select the websites, click the dropdown in the top-right of the section, and select **AI** or **Undefined**.<br>

   <figure><img src="https://1102323068-files.gitbook.io/~/files/v0/b/gitbook-x-prod.appspot.com/o/spaces%2FSrTJQs663dZ9Te4UU3O8%2Fuploads%2F4WJircjgLc4xs1DBz5Ug%2FAI%20Usage%20-%20AI%20Websites.png?alt=media&amp;token=9742bc0d-2249-4302-b368-1152a359840c" alt=""><figcaption></figcaption></figure>
5. Click the **AI Applications** tab.
6. Select the applications, click the dropdown in the top-right of the section, and select **AI** or **Undefined**.<br>

   <figure><img src="https://1102323068-files.gitbook.io/~/files/v0/b/gitbook-x-prod.appspot.com/o/spaces%2FSrTJQs663dZ9Te4UU3O8%2Fuploads%2FTHf2DJQa05dVd8saDFra%2FAI%20Usage%20-%20AI%20Applications.png?alt=media&amp;token=8bd2c3df-3197-4511-acce-96e579d6c9d9" alt=""><figcaption></figcaption></figure>
7. Click **Save.**
8. Click **Yes, update** in the confirmation box.

## SharePoint

The SharePoint section lists all SharePoint libraries accessed by users within your organisation. Mark libraries as sensitive where required. This helps protect shared data by identifying sensitive libraries and ensuring appropriate monitoring and compliance controls are applied.

To classify SharePoint libraries:

1. Navigate to ***INSIGHT > Organisation Settings***.
2. Click **SharePoint.**
3. Select the SharePoint libraries, click the dropdown in the top-right of the section, and select **Sensitive** or **Undefined**.<br>

   <figure><img src="https://1102323068-files.gitbook.io/~/files/v0/b/gitbook-x-prod.appspot.com/o/spaces%2FSrTJQs663dZ9Te4UU3O8%2Fuploads%2FJncjCK0WVqtxhWKxvquM%2FSharePoint.png?alt=media&amp;token=f86b6820-925a-4a7d-a629-bf842e4a3b38" alt=""><figcaption></figcaption></figure>
4. Click **Save.**
5. Click **Yes, update** in the confirmation box.


# Risk Definitions

**Risk Definitions** allow you to assign risk levels for different user activities across applications, email, file sharing, and data transfers. This setting gives your organisation the flexibility to define which activities are considered high or low risk based on your own security needs. By configuring these risk levels, your organisation can prioritise alerts and incidents based on severity, strengthen data protection by applying stricter controls where needed, and gain better visibility into user behaviour across systems.

The assigned risk levels are reflected in the Incident Risks dashboard, helping you quickly identify and respond to potential threats.

Each activity is assigned the following risk levels:

* **No Risk:** Considered safe and does not require monitoring.
* **Low:** Considered as having minimal impact and monitored with low priority.
* **Medium:** Considered as having a moderate impact and requires attention.
* **High:** Considered as having a critical impact and requires immediate action or a strict policy.
* **Highest**: Considered to have the most severe impact and poses a significant risk to the organisation. Requires immediate intervention, escalation, and the strictest policy enforcement.
* **Undefined**: No risk level is assigned to the activity.

## Configure Risk Levels

1. Navigate to ***INSIGHT > Risk Definition.***
2. Select the risk levels for each activity and click **Save**.<br>

   <figure><img src="https://1102323068-files.gitbook.io/~/files/v0/b/gitbook-x-prod.appspot.com/o/spaces%2FSrTJQs663dZ9Te4UU3O8%2Fuploads%2FDmNgabN9Vxv8BgPYEkFa%2FRisk%20Definitions.png?alt=media&amp;token=752ca87a-7ab6-40c3-a4c8-2e72fdc3b447" alt=""><figcaption></figcaption></figure>

## Risk Categories

User activities are classified according to category:

1. **SharePoint External**: External users accessing organisational data increases the risk of data leakage. Assigning risk levels helps monitor sensitive and uncontrolled access.&#x20;
2. **SharePoint Internal**: Internal users can unintentionally expose or misuse sensitive data. Assigning risk levels helps monitor and control internal data handling.&#x20;
3. **Email**: Email is a common channel for data exfiltration. Assigning risk levels helps prevent sensitive data from being shared outside the organisation.&#x20;
4. **Data Transfer using Non-Corporate Websites**: Uploading files to unapproved websites can lead to data exposure. Assigning risk levels helps prevent unauthorised data transfers.&#x20;
5. **File Uploads to Non-Corporate File Sharing Applications**: Third-party file-sharing applications may not meet organisational security standards, increasing the risk of data loss. Assigning risk levels helps prevent unauthorised data transfers.&#x20;
6. **Storage Device Risk:** Removable storage devices can be used to transfer sensitive data outside the organisation, increasing the risk of data leakage. Assigning risk levels helps control and monitor data movement through such devices.
7. **Printing Incidents:** Printing sensitive information can lead to data exposure and unauthorised access. Assigning risk levels helps monitor and restrict the printing of critical data.
8. **Keystroke Capture:** Captured keystrokes can include sensitive information such as passwords or confidential data, increasing security risks. Assigning risk levels helps detect and control potential data exposure.
9. **Copy Paste:** Copying and pasting data between applications can result in unintended data sharing or leakage. Assigning risk levels helps monitor and prevent unauthorised data transfer.
10. **Access of Documents on Local Devices:** Accessing documents on local devices can bypass organisational controls and increase the risk of data misuse. Assigning risk levels helps track and manage local data access.
11. **Usage of AI Tools:** Using AI tools can involve sharing sensitive organisational data with external platforms. Assigning risk levels helps control and monitor potential data exposure.
12. **Usage of Non-Corporate Websites:** Accessing non-corporate websites can expose data to untrusted platforms and increase security risks. Assigning risk levels helps restrict and monitor such usage.
13. **Usage of Non-Corporate Applications:** Non-corporate applications may not comply with organisational security standards, increasing the risk of data loss. Assigning risk levels helps control and monitor their usage.


# Cyber Awareness Report

**Cyber Awareness Report** provides contextual reports via email directly to end users when a risk associated with their activity is triggered. Cyber Awareness Reports explain what occurred, why it occurred, and the appropriate next steps. This report strengthens security awareness by guiding users through personalised reports, helping them become more self-aware and improve their behaviour without relying solely on IT or security team follow-up.

With the Cyber Awareness Report, organisations can:

* Promote better awareness of data-handling practices
* Encourage responsible use of tools, including AI platforms
* Reduce repetitive IT involvement in minor policy events
* Support internal compliance and HR processes
* Roll out consistent policy messaging across the business

Cyber Awareness Reports are fully configurable, so organisations can customise the messaging, tone, and guidance to suit their policies and communication style.

#### Real-World Example

A Cyber Awareness Report says:

> Repeated access to websites classified as unsafe or non-organisational was detected over multiple days. These platforms, including DeepSeek, Yahoo Mail, WhatsApp Web, WeTransfer, and Telegram, are not approved for organisational use and may expose systems to risks such as data leakage or malware.
>
> Frequent and prolonged browsing sessions, ranging from a few minutes to over an hour, indicate a pattern of non-compliant browsing behaviour.
>
> This occurred due to the use of non-organisational websites and limited awareness of the associated security risks.
>
> **Actions required:**
>
> * Avoid accessing non-approved or unsafe websites on work devices
> * Follow organisational policies on approved tools and platforms
> * Limit browsing strictly to work-related activities
> * Do not share or enter sensitive information on external platforms
> * Report any accidental access to unsafe sites

**Self-Awareness**

After reading the report, a user thinks:

* “I didn’t realise these websites are considered unsafe in my organisation.”
* “I’ve been using these platforms frequently during work hours.”
* “If I enter sensitive information on these sites, it could be exposed.”

This helps the user recognise how routine browsing behaviour may introduce security and compliance risks.

**Self-Improvement**

The user takes concrete steps:

* Stops accessing non-organisational websites on work devices
* Uses only approved tools for work-related tasks
* Avoids entering organisational data into external platforms
* Becomes more mindful of browsing time and purpose
* Reviews organisational policies on safe internet use

**Outcome**

* Reduced exposure to unsafe or unapproved platforms
* Lower risk of data leakage and malware threats
* Improved compliance with organisational security policies
* The user develops more disciplined and security-aware browsing habits

## Configure Cyber Awareness Report

1. Navigate to ***INSIGHT > Cyber Awareness***.
2. Click **Configure Cyber Awareness Report**.<br>

   <figure><img src="https://1102323068-files.gitbook.io/~/files/v0/b/gitbook-x-prod.appspot.com/o/spaces%2FSrTJQs663dZ9Te4UU3O8%2Fuploads%2FjEwad4pNQmvDveZFfOCv%2FConfigure%20Cyber%20Awareness%20Report%20button.png?alt=media&amp;token=b4284908-782c-4dcf-bdae-48ce719c84d8" alt=""><figcaption></figcaption></figure>
3. In **General**:
   1. Enter the email subject.
   2. In **CC**, add valid email addresses for additional recipients, if needed. Separate multiple email addresses with commas.
   3. In **Email Start Date**, select the date and time when the report will be sent.
   4. In **Status**, select **Enabled** to enable the report schedule and start sending reports automatically.
   5. In **Send to**:
      1. **Send to admin**: Select **Send to admin** to send the Cyber Awareness Report of selected users to administrators.
      2. **Send to users**: Select **Send to users** to send the Cyber Awareness Report to individual users selected in the next step.
   6. In **Duration**, choose how often the report is sent:
      * **Daily:** The report is sent every day after the selected start date.

        *Example:* If the Email Start Date is 10 April at 9:00 AM, the report will be sent daily at 9:00 AM starting on 10 April.
      * **Weekly:** The report is sent once every week on the same day and time as the start date.

        *Example:* If the Email Start Date is Friday, 10 April, at 9:00 AM, the report will be sent every Friday at 9:00 AM.
      * **Monthly:** The report is sent once every month on the same date and time as the start date.

        *Example:* If the Email Start Date is set to 10 April at 9:00 AM, the report will be sent on the 10th of every month at 9:00 AM.<br>

        <figure><img src="https://1102323068-files.gitbook.io/~/files/v0/b/gitbook-x-prod.appspot.com/o/spaces%2FSrTJQs663dZ9Te4UU3O8%2Fuploads%2Fl0BgGY5G3KR3cjd2rLvs%2FCreate%20SASI%20-%20General.png?alt=media&amp;token=ec1defb9-db30-4420-9bc1-369fb8b09370" alt=""><figcaption></figcaption></figure>
   7. Click **Continue**.
4. In **Select Users**, select the users whose Cyber Awareness Reports you want to send. Selected users receive only their own report, while administrators receive the reports of all selected users.

   <figure><img src="https://1102323068-files.gitbook.io/~/files/v0/b/gitbook-x-prod.appspot.com/o/spaces%2FSrTJQs663dZ9Te4UU3O8%2Fuploads%2FVNP73gHhKpl55ocZQtRj%2FCreate%20SASI%20-%20Select%20usrs.png?alt=media&amp;token=e03729b0-ddfc-46de-bd79-33a451a42d69" alt=""><figcaption></figcaption></figure>
5. In **Select Risks**, select and configure the risks to include in the report. To configure a risk:
   1. Select a risk template from the list and click **Configure**.<br>

      <figure><img src="https://1102323068-files.gitbook.io/~/files/v0/b/gitbook-x-prod.appspot.com/o/spaces%2FSrTJQs663dZ9Te4UU3O8%2Fuploads%2F6ryT31oSkPVLK2WkJSfU%2FCreate%20SASI%20-%20Configure%20Risk.png?alt=media&amp;token=44f20f8f-322d-46b3-a5d4-4cb5e8d7bfbf" alt=""><figcaption></figcaption></figure>
   2. In the text editor, add context and information to help recipients understand the risk.\
      ![](https://1102323068-files.gitbook.io/~/files/v0/b/gitbook-x-prod.appspot.com/o/spaces%2FSrTJQs663dZ9Te4UU3O8%2Fuploads%2Fy5Lwu8Pst49FArliVAn1%2FCreate%20SASI%20-%20Select%20data%20type.png?alt=media\&token=00060660-c8e5-480b-97a2-66f1afd437cb)
   3. In **Context Threshold**, define how many times the selected data type must appear in a document before it is considered an incident, and the Cyber Awareness Report is triggered.
   4. In **Incident Threshold**, define how many times an incident must occur before the Cyber Awareness Report is generated. If escalation is set to **3**, the Cyber Awareness Report is generated only after an incident matching the selected data type occurs **three times**. If it occurs once or twice, it is recorded, but the Cyber Awareness Report is not generated.\
      \
      *`Example: If the selected data type is Visa Card Global and the`` `**`Context Threshold`**` ``is set to 5, the document must contain at least five Visa card matches to be considered an incident. If the`` `**`Incident Threshold`**` ``is set to 3, the Cyber Awareness Report is generated after three such incidents occur.`*
   5. For risks associated with time-based activities, the **Duration Threshold** option is displayed in the configuration. Use this setting to define the minimum duration an activity must last before it is considered an incident.

      \
      *`Example: If the selected risk type is time spent on Generative AI websites and the Duration Threshold is set to 10 minutes or more, a Cyber Awareness Report is generated when a user browses Generative AI websites for 10 minutes or longer.`*
   6. Select the data types to monitor for this risk.
   7. Click **Save Configuration**, then click **Continue**.
6. In **Customise**, customise the appearance and content of the email report.

   1. In **Cover Image**, upload an image in PNG, JPG, or GIF format, up to 5 MB, to personalise the report.
   2. In **Custom Template**, add or edit the content that will appear in the email. This can include an introductory message, risk summaries, additional instructions, notes, and more.
   3. In **Custom Template Footer**, add or edit the footer content displayed at the bottom of the email report.
   4. In **Custom Template Privacy**, add or edit the privacy statement or disclaimer included in the email report.

   <figure><img src="https://1102323068-files.gitbook.io/~/files/v0/b/gitbook-x-prod.appspot.com/o/spaces%2FSrTJQs663dZ9Te4UU3O8%2Fuploads%2FXekFOV9hC5eixnk7N3Ak%2FCreate%20SASI%20-%20Customise.png?alt=media&amp;token=e8e4fa5b-3512-4bf6-a85b-3218519ab104" alt=""><figcaption></figcaption></figure>
7. After completing all steps, click **Create Report**. The report will be generated and sent based on the defined criteria and schedule.
8. You can also send a test email to a specified email address to preview how the report appears to recipients. To send a test email:
   1. In **Email to**, select or add the email address.
   2. Click **Send email**.\
      ![](https://1102323068-files.gitbook.io/~/files/v0/b/gitbook-x-prod.appspot.com/o/spaces%2FSrTJQs663dZ9Te4UU3O8%2Fuploads%2FHCHwzF6ZTADeQFcYeXCE%2FCreate%20SASI%20-%20Send%20test%20email.png?alt=media\&token=f1177eb0-3cf7-46b2-b2d1-6f2adc717fb9)

## View Cyber Awareness Report Details

You can view the Cyber Awareness Report email that was sent to users.

1. Navigate to ***INSIGHT > Cyber Awareness***.
2. Click **View Details** in the **ACTION** column.<br>

   <figure><img src="https://1102323068-files.gitbook.io/~/files/v0/b/gitbook-x-prod.appspot.com/o/spaces%2FSrTJQs663dZ9Te4UU3O8%2Fuploads%2FnB6Xl40mlKMG9EGLAtj7%2FSASI%20REPORT%20-%20view%20details.png?alt=media&amp;token=394c74f3-91d1-4aee-b164-13b24c13e4c0" alt=""><figcaption></figcaption></figure>
3. In the **ACTION** column, click **View Email**.<br>

   <figure><img src="https://1102323068-files.gitbook.io/~/files/v0/b/gitbook-x-prod.appspot.com/o/spaces%2FSrTJQs663dZ9Te4UU3O8%2Fuploads%2FakCq4YhILzvDenzGvseB%2FView%20email.png?alt=media&amp;token=f7e91ae4-aaa8-4e03-a1dd-45099f5ab5fb" alt=""><figcaption></figcaption></figure>

## Edit Cyber Awareness Report

1. Navigate to ***INSIGHT > Cyber Awareness***.
2. Click **Edit Report** in the **ACTION** column.<br>

   <figure><img src="https://1102323068-files.gitbook.io/~/files/v0/b/gitbook-x-prod.appspot.com/o/spaces%2FSrTJQs663dZ9Te4UU3O8%2Fuploads%2FijiDWg6hfb6CsBWzZBPT%2FEdit%20SASI%20REPORT.png?alt=media&amp;token=ae5294ff-4e87-4b09-b8a7-4b10461c3a40" alt=""><figcaption></figcaption></figure>
3. Update the necessary information and click **Update Report**.

## Delete Cyber Awareness Report

1. Navigate to ***INSIGHT > Cyber Awareness***.
2. Click the **Delete** icon in the **ACTION** column.<br>

   <figure><img src="https://1102323068-files.gitbook.io/~/files/v0/b/gitbook-x-prod.appspot.com/o/spaces%2FSrTJQs663dZ9Te4UU3O8%2Fuploads%2FgIPdjPcu7VqMd5iECVK5%2FDelete%20SASI%20REPORT.png?alt=media&amp;token=571c5a56-5eea-462b-b645-00f785fb99f4" alt=""><figcaption></figcaption></figure>
3. Click **Yes, delete** in the confirmation box.


# Risk Summary

Risk Summary provides a consolidated, high-level overview of risky activities and user behaviour of your organisation in a single email, helping you quickly understand your organisation’s overall risk posture. It gives you visibility into what kinds of incidents are happening in your organisation and which users are showing risky behaviour, so your security teams can take necessary actions on time. &#x20;

Clicking on an item in the report takes you to the INSIGHT Dashboard for deeper investigation. You need to log in to INSIGHT to access the Dashboard. You can customise the report to suit your requirements by choosing what data to include, how it is displayed, and how frequently it is sent.&#x20;

## Configure Risk Summary Report

1. Navigate to ***INSIGHT > Risk Summary***.
2. ​Click **+ New Risk Summary**.<br>

   <figure><img src="https://1102323068-files.gitbook.io/~/files/v0/b/gitbook-x-prod.appspot.com/o/spaces%2FSrTJQs663dZ9Te4UU3O8%2Fuploads%2FU4x8hjHQiV8aKSdd7BKI%2FNew%20Risk%20Summary%20button.png?alt=media&amp;token=d98a1c94-c1af-4eb3-925c-d3df47eba4c7" alt=""><figcaption></figcaption></figure>
3. ​In **General**:
   1. ​Enter the email subject.
   2. ​In **Email On**, select the date when the first report will be sent.
   3. ​In **Email To**, enter or select the email addresses of users who will receive the report.
   4. ​In **Duration**, choose how often the report is sent:
      * ​**Daily:** The report is sent every day after the selected start date.
      * ​**Weekly:** The report is sent once every week on the same day of the week as the start date.
      * ​**Monthly:** The report is sent once every month on the same day as the start date.<br>

        <figure><img src="https://1102323068-files.gitbook.io/~/files/v0/b/gitbook-x-prod.appspot.com/o/spaces%2FSrTJQs663dZ9Te4UU3O8%2Fuploads%2Fh4Xmv2xFOzxZleq9AGEQ%2FStep%201-%20General.png?alt=media&amp;token=25d1f3de-c78a-4706-88e5-b7eda1b4d577" alt=""><figcaption></figcaption></figure>
   5. ​Click **Next**.
4. ​In **Select Widget,** select the [widgets](#widgets) to include in your report and click **Next**. These widgets determine what types of risk activities are analysed. <br>

   <figure><img src="https://1102323068-files.gitbook.io/~/files/v0/b/gitbook-x-prod.appspot.com/o/spaces%2FSrTJQs663dZ9Te4UU3O8%2Fuploads%2FCaOGji14Ypi20y7h4enz%2FStep%202%20-%20Select%20widgets.png?alt=media&amp;token=6d8e1d9a-2263-4828-bfdf-0ad8543e9bc8" alt=""><figcaption></figcaption></figure>
5. In **Filter Options**, apply the following filters to refine the report output and click **Next.**
   1. ​In **File Name**, enter the file name to filter results within the selected widgets. The report will include data only for files that match this name.
   2. ​In **SharePoint File Path**, enter the file or folder path within the SharePoint site to further narrow down the results.
   3. ​In **SharePoint Site URL**, search and select the URL to limit results to activities associated with a specific SharePoint site.
6. In **Select Users**, search and select the users whose risk activities you want to track in the report and click **Next**. Only activities related to selected users will be included.<br>

   <figure><img src="https://1102323068-files.gitbook.io/~/files/v0/b/gitbook-x-prod.appspot.com/o/spaces%2FSrTJQs663dZ9Te4UU3O8%2Fuploads%2F5QgmFqMDGhGbRRq7FDoQ%2FStep%204%20-%20Select%20Users.png?alt=media&amp;token=9c44058d-b7e4-4d69-ae17-bcef40a0853b" alt=""><figcaption></figcaption></figure>
7. In **Data Types**, select relevant data types to include in the report and click **Next**.\
   ![](https://1102323068-files.gitbook.io/~/files/v0/b/gitbook-x-prod.appspot.com/o/spaces%2FSrTJQs663dZ9Te4UU3O8%2Fuploads%2FCigGxzldqUkkOve0gsk1%2FStep%205%20-%20Data%20types.png?alt=media\&token=ccfb9dcb-ce2b-41b2-974a-15b0827c6f50)
8. In **Customisation**, customise the appearance and content of the report.
   1. In **Banner Image**, upload an image in PNG, JPG, or GIF format, up to 5 MB, to personalise the report.
   2. In the text box, add the content that will appear in the report. This can include an introductory message, risk summaries, additional instructions, notes, and more.&#x20;
   3. Click **Next**.<br>

      <figure><img src="https://1102323068-files.gitbook.io/~/files/v0/b/gitbook-x-prod.appspot.com/o/spaces%2FSrTJQs663dZ9Te4UU3O8%2Fuploads%2FIvQxr4DOZnO44OiiEV6P%2FStep%206%20-%20Customisation.png?alt=media&amp;token=6ee21c18-b1e2-4179-853d-958c998a44f2" alt=""><figcaption></figcaption></figure>
9. In **Send Test Email**,&#x20;
   1. In **Date Range,** select the time period for which the Risk Summary report data should be generated.
   2. In **Email to**, enter the recipient's email address.
   3. Click **Send Email**.
10. After completing all steps, click **Save**. The report will be generated and sent based on the defined criteria and schedule.

### Widgets

#### **SharePoint External**

1. **External Access:** Shows when and how files stored in SharePoint are being accessed by users outside the organisation’s domain. This helps identify potential exposure of organisational data outside trusted boundaries.
2. **External Downloads:** Shows which files are being downloaded by external users and how often. This helps highlight potential data exfiltration, especially when large volumes or sensitive files are involved.
3. **Anonymous Downloads:** Shows downloads performed using anonymous links that do not require authentication. Since user identity is not verified, this represents a higher risk of uncontrolled data distribution.
4. **Anonymous Access:** Shows access to SharePoint content through anonymous links. This helps identify content that is accessible without authentication, increasing the risk of unauthorised access.
5. **Platform Downloads External Mobile:** Shows file downloads by external users on mobile devices. This provides visibility into access from potentially unmanaged or less secure environments.
6. **Platform Access External Mobile:** Shows access to SharePoint content by external users from mobile devices, helping identify activity from untrusted or non-corporate devices.
7. **Links Shared to External Users using Teams:** Shows files or links shared with external users through Microsoft Teams, providing visibility into collaboration-based sharing activities.
8. **Use of Sensitive Libraries by External Users:** Shows external user activity within libraries marked as sensitive, helping identify access to critical or confidential data.
9. **Downloads using Sensitive Libraries by External Users:** Shows downloads of files from sensitive libraries by external users, indicating potential data leakage risks.

#### **SharePoint Internal**

1. **Creation of Links for Anonymous Users:** Shows when internal users create anonymous access links, which may introduce risks by allowing access without authentication.
2. **Internal Access:** Shows access to SharePoint files, folders, or sites by internal users, helping identify unusual or unexpected access behaviour.
3. **Internal Downloads:** Shows files downloaded by internal users. High-volume or unusual downloads may indicate potential misuse or insider risk.
4. **Platform Downloads Internal (Mobile Devices):** Shows downloads performed by internal users on mobile devices, providing visibility into activity outside controlled environments.
5. **Platform Access Internal (Mobile Devices):** Shows SharePoint access by internal users from mobile devices, helping track access from non-corporate or unmanaged devices.
6. **Links Shared to Internal Users using Teams:** Shows files or links shared internally through Microsoft Teams, helping track internal collaboration and data distribution.
7. **Use of Sensitive Libraries by Internal Users:** Shows internal user activity within sensitive libraries, helping ensure appropriate access to critical data.
8. **Downloads using Sensitive Libraries by Internal Users:** Shows downloads of sensitive files by internal users, indicating potential insider risk or policy violations.
9. **Internal File Deletions:** Shows file deletion activity by internal users, helping identify accidental or intentional data removal.
10. **Internal File Uploads:** Shows files uploaded by internal users to SharePoint, providing visibility into new data being introduced.
11. **Internal File Deletions from Sensitive Libraries:** Shows deletion of files from sensitive libraries by internal users, highlighting potential loss of critical data.
12. **Internal File Uploads to Sensitive Libraries:** Shows uploads of files to sensitive libraries by internal users, helping track what data is being stored in controlled locations.

#### **Email**

1. **Emailing of attachments from Corporate Email to Non-Corporate:** Shows attachments sent from corporate email accounts to external (non-corporate) recipients, helping identify potential data sharing outside the organisation.
2. **Emailing of attachments from Corporate Email Address to Unsecure Email Address:** Shows attachments sent to email addresses that are considered insecure or untrusted, highlighting increased risk of data exposure.
3. **Emailing of attachments from Corporate Email Address to Personal Email Address:** Shows attachments sent from corporate accounts to personal email accounts (e.g. Gmail, Yahoo), indicating potential data leakage.
4. **Emailing of attachments from Corporate Email Address to Potential Personal Email Address:** Shows attachments sent to email addresses that may be personal but are not explicitly verified, helping detect possible policy violations.
5. **Emailing of attachments from Corporate Email Address to Own Corporate Email Address:** Shows attachments sent within the organisation using corporate email accounts. While internal, unusual patterns may still indicate misuse.
6. **Emailing of attachments from Non-Corporate Email Address:** Shows attachments sent using non-corporate email accounts on organisational devices, indicating potential bypass of corporate controls.

#### **Data Transfer using Non-Corporate Websites**

1. **File Uploads to Non-Corporate Websites:** Shows files uploaded to external or non-corporate websites, helping identify potential data exfiltration through web platforms.

**File Uploads to Non-Corporate File Sharing Applications**

1. **File Uploads via Non-Corporate Sharing Applications:** Shows files uploaded using non-corporate file sharing applications, indicating potential unauthorised data transfer.
2. **File Uploads to Non-Corporate OneDrive Folders:** Shows files uploaded to personal or non-corporate OneDrive accounts, highlighting the risk of data leaving the organisation’s control.

#### **Storage Device Risk**

1. **Files Transferred to Non-Corporate External Storage:** Shows files copied or transferred to external storage devices (e.g. USB drives, external hard disks) that are not managed by the organisation.
2. **Insertion of Non-Corporate Storage Devices:** Shows when external storage devices are connected to organisational systems, providing visibility into potential data transfer points.

#### **Printing Incidents**

1. **Files Printed using Non-Corporate Printers:** Shows files printed using printers that are not managed or approved by the organisation, increasing the risk of data leakage.

#### **Key Stroke Capture**

1. **Key Stroke Capture of Monitored Phrases in Non-Corporate Applications:** Shows instances where monitored or sensitive phrases are typed into non-corporate applications, indicating possible exposure of sensitive information.

#### **Copy Paste**

1. **Copy Paste of Monitored Phrases into Non-Corporate Applications:** Shows when sensitive or monitored content is copied and pasted into non-corporate applications, highlighting potential data leakage.

#### **Access of Documents on Local Devices**

1. **Viewing of Office Documents:** Shows when Office documents are accessed locally on user devices. This provides baseline visibility, though typically considered lower risk.

#### **Usage Of AI Tools**

1. **Files Uploaded to Generative AI Applications:** Shows files uploaded to installed or integrated generative AI applications, indicating potential exposure of organisational data.
2. **Files Uploaded to Generative AI Websites:** Shows files uploaded to web-based generative AI platforms, which may pose higher risks due to external processing of data.
3. **Sensitive Prompts Used in AI Websites:** Shows instances where sensitive or monitored information is entered as prompts in AI websites.
4. **Time Spent on Generative AI Applications:** Shows the duration of usage of generative AI applications, helping assess behavioural patterns and potential productivity or data risks.
5. **Time Spent on Generative AI Websites:** Shows time spent on web-based AI tools, providing insight into external AI usage trends.

#### **Usage of Non-Corporate Websites and Applications**

1. **Time Spent on Non-Corporate Websites:** Shows the amount of time users spend on non-corporate websites, helping identify potential productivity concerns or risky browsing behaviour.
2. **Time Spent on Non-Corporate Applications:** Shows time spent on non-corporate applications, providing visibility into usage of unapproved software.

## Enable/Disable Risk Summary Report

You can enable or disable the Risk Summary Report. When enabled, the system sends the report based on the configured settings and schedule; when disabled, the report is not sent.

To enable or disable the Risk Summary Report:

1. Navigate to ***INSIGHT > Risk Summary***.
2. In the **STATUS** column, use the toggle to turn the report on or off.

<figure><img src="https://1102323068-files.gitbook.io/~/files/v0/b/gitbook-x-prod.appspot.com/o/spaces%2FSrTJQs663dZ9Te4UU3O8%2Fuploads%2FLn98jRPikMlOLah5CtMe%2FEnable%20Disable%20Risk%20summary%20report.png?alt=media&amp;token=0411eee5-605f-45ce-ac1a-1ec40c57aa8f" alt=""><figcaption></figcaption></figure>

## Update a Risk Summary Report

1. Navigate to ***INSIGHT > Risk Summary***.
2. Click **Edit** under the **ACTIONS** column.<br>

   <figure><img src="https://1102323068-files.gitbook.io/~/files/v0/b/gitbook-x-prod.appspot.com/o/spaces%2FSrTJQs663dZ9Te4UU3O8%2Fuploads%2FRxJbTlXJxQ982F2LuhNB%2FEdit%20Risk%20Summary.png?alt=media&amp;token=da38dd1b-b86d-4b62-ad71-7831d7f88587" alt=""><figcaption></figcaption></figure>
3. Edit the information in each section, then click **Update** at the end.

## Delete a Risk Summary Report

1. Navigate to ***INSIGHT > Risk Summary***.
2. Click the **Delete** icon under the **ACTIONS** column.<br>

   <figure><img src="https://1102323068-files.gitbook.io/~/files/v0/b/gitbook-x-prod.appspot.com/o/spaces%2FSrTJQs663dZ9Te4UU3O8%2Fuploads%2FCiah3BxkRjYG27dTooQp%2FDelete%20Risk%20Summary.png?alt=media&amp;token=c2e148bc-7599-42e4-acad-1ff76e553b03" alt=""><figcaption></figcaption></figure>
3. Click **Yes, Delete it!** to confirm.


# Dashboard

The GuardWare INSIGHT Dashboard provides a centralised view of your organisation’s data activity, user behaviour, and potential security risks. It brings key insights into one place, helping you monitor file movements, SharePoint activity, email usage, AI tool usage, device activity, label events, location-based risks, and other sensitive events. The dashboard helps administrators and security teams to quickly detect unusual behaviour, assess risk levels, and investigate incidents across the organisation.

The dashboard includes the following Risk Category tabs, allowing you to switch between different risk areas. Each tab contains widgets that provide insights into data usage patterns, trends, and potential threats.

1. [Risk Summary](#risk-summary)
2. [Data Type Risks](#data-type-risks)
3. [SharePoint Risks](#sharepoint-risks)
4. [AI Usage Risks](#ai-usage-risks)
5. [Behaviour Risks](#behaviour-risks)
6. [Label Events](#label-events)
7. [Location Risks](#location-risks)
8. Protected File
9. [System Risks](#system-risks)

You can also create **custom dashboards** and choose the widgets according to your organisation’s monitoring priorities. For details on creating custom dashboards, see [Create a New Dashboard](#create-a-new-dashboard).

Use the **Search** icon in the top-right corner to filter the dashboard data.

<figure><img src="https://1102323068-files.gitbook.io/~/files/v0/b/gitbook-x-prod.appspot.com/o/spaces%2FSrTJQs663dZ9Te4UU3O8%2Fuploads%2FIji6u4qdWaavqhgVOERF%2FFilter%20dashboard.png?alt=media&amp;token=68931642-f147-4f31-aec2-bcbc7b736d85" alt=""><figcaption></figcaption></figure>

## Dashboard Risk Categories and Widgets

### Risk Summary

Risk Summary provides an overview of key security and data protection indicators across your organisation. It displays critical activities such as file sharing, data transfers, email usage, and device interactions, helping you identify potential risks and monitor sensitive information in real time.

This is particularly useful for executives and security managers who need a quick summary of data-related risks without navigating through detailed reports.

Each widget in this risk category displays the following:

1. Activities related to various categories like SharePoint, File and data transfer, file upload, usage of AI tools, non-corporate websites and applications, and so on.
2. The total number of users involved in specific activities or incidents during the specific period.
3. The total number of incidents recorded for each monitored category. (for example, how many files were downloaded).
4. Risk levels for each activity category.

You can export a widget’s data to **PDF or Excel** by clicking **Download Excel** or **Download PDF** in the top-right corner of the widget.

#### Risk Levels

Each activity in the widgets is assigned a risk level that indicates the severity of detected activities. The risk level for each activity is defined in [Risk Definitions](/documentation/insight-v4/insight-v5/risk-definitions).

<table><thead><tr><th width="145">Risk Level</th><th width="117">Colour</th><th>Description</th></tr></thead><tbody><tr><td>No Risk</td><td><span data-gb-custom-inline data-tag="emoji" data-code="2b1c">⬜</span> <strong>White</strong></td><td>No unusual or unauthorised activity detected. This includes routine activities within corporate policy.</td></tr><tr><td>Low Risk</td><td><span data-gb-custom-inline data-tag="emoji" data-code="1f7e9">🟩</span> <strong>Green</strong></td><td>Minor or low-impact activities that slightly deviate from standard policy but pose minimal threat, such as occasional access from non-corporate networks.</td></tr><tr><td>Medium Risk</td><td>🟨 <strong>Yellow</strong></td><td>Actions that may require review, such as occasional file transfers to external sites.</td></tr><tr><td>High Risk</td><td>🟥 <strong>Red</strong></td><td>Activities that indicate potential misuse or data breaches, such as unauthorised data sharing or file copying to external drives.</td></tr></tbody></table>

#### Widgets in Risk Summary <a href="#widgets-in-risks-summary-dashboard" id="widgets-in-risks-summary-dashboard"></a>

<table><thead><tr><th width="274">Category</th><th>Widget Name</th></tr></thead><tbody><tr><td><strong>SharePoint Activities</strong></td><td><a href="#external-sharepoint-events">​External SharePoint Events​</a></td></tr><tr><td>​</td><td><a href="#internal-sharepoint-events">​Internal SharePoint Events​</a></td></tr><tr><td><strong>Email Activities</strong></td><td><a href="#email-activities">​Email Activities​</a></td></tr><tr><td><strong>Data Transfers</strong></td><td><a href="#data-transfer-using-non-corporate-websites">​Data Transfer Using Non-Corporate Websites​</a></td></tr><tr><td>​</td><td><a href="#file-uploads-to-non-corporate-file-sharing-applications">​File Uploads to Non-Corporate File-Sharing Applications​</a></td></tr><tr><td><strong>Device Usage</strong></td><td><a href="#storage-device-risk">​Storage Device Risk​</a></td></tr><tr><td>​</td><td><a href="#printing-incidents">​Printing Incidents​</a></td></tr><tr><td>​</td><td><a href="#access-of-documents-on-local-devices">​Access of Documents on Local Devices​</a></td></tr><tr><td><strong>Behavioural Monitoring</strong></td><td><a href="#keystroke-capture">​Key Stroke Capture</a></td></tr><tr><td></td><td><a href="#copy-paste">Copy Paste</a></td></tr><tr><td></td><td><a href="#access-of-documents-on-local-devices">Access of Documents on Local Devices</a></td></tr><tr><td>​</td><td><a href="#usage-of-ai-tools">​Usage of AI Tools​</a></td></tr><tr><td>​</td><td><a href="#usage-of-non-corporate-websites">​Usage of Non-Corporate Websites​</a></td></tr><tr><td>​</td><td><a href="#usage-of-non-corporate-applications">​Usage of Non-Corporate Applications</a></td></tr></tbody></table>

#### External SharePoint Events

The External SharePoint Events widget helps you track how files are accessed and shared by users outside your organisation, such as partners, vendors, or contractors. It highlights activities such as access or downloads from sensitive libraries, actions by anonymous or invited users, access from mobile devices, and file interactions through links shared on Teams.

This widget allows you to investigate events at multiple levels of detail:

* **Summary View:** Displays an overview of external SharePoint activities, including the number of users, total incidents, and risk level for each risk category.<br>

  <figure><img src="https://1102323068-files.gitbook.io/~/files/v0/b/gitbook-x-prod.appspot.com/o/spaces%2FSrTJQs663dZ9Te4UU3O8%2Fuploads%2F8Vjj7jQEUJOKA2QPgIhR%2FExternal%20SharePoint%20Events.png?alt=media&amp;token=c8676787-423f-46e2-90ad-a079332c258c" alt=""><figcaption></figcaption></figure>
* **Event Details View:** Click the **View** icon in the **ACTION** column to view detailed information, including username, email address, file name, incident date and time, file path, expiry date, URL, etc. Use the search filter at the top to quickly filter specific information.<br>

  <figure><img src="https://1102323068-files.gitbook.io/~/files/v0/b/gitbook-x-prod.appspot.com/o/spaces%2FSrTJQs663dZ9Te4UU3O8%2Fuploads%2Fce9TLdGBegP3AxhYJxX7%2FExternal%20SharePoint%20Events%20-%20drilldown.png?alt=media&amp;token=19fb97eb-5ef9-4d2e-b56a-4f3300ea9dbd" alt=""><figcaption></figcaption></figure>

#### Internal SharePoint Events

The Internal SharePoint Events widget helps you track how files are accessed and shared by users within your organisation. It shows who has viewed, modified, or shared files across SharePoint, highlighting activities such as link creation for anonymous users, access to sensitive libraries, downloads from mobile devices, and file access through links shared on Teams.

<figure><img src="https://1102323068-files.gitbook.io/~/files/v0/b/gitbook-x-prod.appspot.com/o/spaces%2FSrTJQs663dZ9Te4UU3O8%2Fuploads%2FgMbPBZnfPc9hpNrFpJZt%2FInternal%20SharePoint%20Events.png?alt=media&amp;token=8756d186-9efa-4018-af4d-92e9723aaf57" alt=""><figcaption></figcaption></figure>

Click the **View** icon in the **ACTION** column to view detailed information, including the username, email address, file name, incident date and time, file path, expiration date, URL, etc. Use the search filter at the top to quickly filter specific information.

<figure><img src="https://1102323068-files.gitbook.io/~/files/v0/b/gitbook-x-prod.appspot.com/o/spaces%2FSrTJQs663dZ9Te4UU3O8%2Fuploads%2FhDSwhwxQBM1Q5OKGrPFI%2FInternal%20SharePoint%20Events%20-%20drilldown.png?alt=media&amp;token=37a9b068-8d92-41c0-abc7-c55b265a28a3" alt=""><figcaption></figcaption></figure>

#### Email Activities

The Email Activities widget provides an overview of email usage patterns across your organisation, helping you monitor how attachments and sensitive information are shared through corporate email channels. It tracks email attachments sent from corporate to non-corporate domains, as well as emails sent to insecure, personal, or internal corporate addresses, and attachments shared from non-corporate email accounts.

Click the **View** icon in the **ACTION** column to view detailed information, including the username, date and time, sender and recipient addresses, subject, and file name.

<figure><img src="https://1102323068-files.gitbook.io/~/files/v0/b/gitbook-x-prod.appspot.com/o/spaces%2FSrTJQs663dZ9Te4UU3O8%2Fuploads%2FHvEoWluipCMszERmzwjr%2FEmail%20activities.png?alt=media&amp;token=28bc0dc3-cdfb-44a8-8a76-1fb7601e1560" alt=""><figcaption></figcaption></figure>

Click the menu icon (**☰**) in the **ACTION** column to drill down further into the details, and use the search filter at the top to quickly filter for specific information.

#### Data Transfer using Non-Corporate Websites

The Data Transfer using Non-Corporate Websites widget helps you track file uploads or transfers made to non-corporate websites, such as public file-sharing services or personal cloud storage platforms. It helps you detect and prevent potential data leaks by identifying instances where sensitive files may have been transferred outside secure corporate networks.

Click the **View** icon in the **ACTION** column to view detailed information, including the username, PC name, file name, software used, website URL, and the date and time of the violation.&#x20;

<figure><img src="https://1102323068-files.gitbook.io/~/files/v0/b/gitbook-x-prod.appspot.com/o/spaces%2FSrTJQs663dZ9Te4UU3O8%2Fuploads%2FyUdD9TKymTySmH4F1vhd%2FData%20Transfer%20using%20Non-Corporate%20Websites.png?alt=media&amp;token=a7fbb5b7-13ec-4b06-9996-c69bc3857358" alt=""><figcaption></figcaption></figure>

Click the menu icon (**☰**) in the **ACTION** column to drill down further into the details, and use the search filter at the top to quickly filter for specific information.

#### File Uploads to Non-Corporate File Sharing Applications

The File Uploads to Non-Corporate File Sharing Applications widget helps you track files uploaded via applications such as Dropbox or Google Drive that are not managed through your organisation’s approved corporate accounts. Frequent uploads to these applications can indicate attempts to bypass corporate storage policies or move confidential data to personal accounts.

Click the **View** icon in the **ACTION** column to view detailed information, including the username, file name, file path, application name, and violation date and time.&#x20;

<figure><img src="https://1102323068-files.gitbook.io/~/files/v0/b/gitbook-x-prod.appspot.com/o/spaces%2FSrTJQs663dZ9Te4UU3O8%2Fuploads%2FPWZEYJwoNKhB3esF6LJn%2FFile%20Uploads%20to%20Non-Corporate%20File%20Sharing%20Applications.png?alt=media&amp;token=6807ae57-a070-4227-8ab0-f083bd0e498c" alt=""><figcaption></figcaption></figure>

Click the menu icon (**☰**) in the **ACTION** column to drill down further into the details, and use the search filter at the top to quickly filter for specific information.

#### Storage Device Risk

The Storage Device Risk widget helps you track files copied or moved to portable storage devices such as USB drives or external hard disks, along with the users who performed these actions. Because these transfers are often offline and unmonitored, this widget helps mitigate risks of data theft or accidental exposure through removable media.

Click the **View** icon in the **ACTION** column to view detailed information, including the username, file name, file path, transfer means, PC name, and violation date and time.&#x20;

<figure><img src="https://1102323068-files.gitbook.io/~/files/v0/b/gitbook-x-prod.appspot.com/o/spaces%2FSrTJQs663dZ9Te4UU3O8%2Fuploads%2FsnjzB4cNCasenWlKtXee%2FStorage%20Device%20Risk.png?alt=media&amp;token=d4208e51-191a-4f5e-9d3e-c3afb61117ac" alt=""><figcaption></figcaption></figure>

Click the menu icon (**☰**) in the **ACTION** column to drill down further into the details, and use the search filter at the top to quickly filter for specific information.

#### Printing Incidents

The Printing Incidents widget helps you track files printed using non-corporate or unauthorised printers. It provides visibility into printing activities that may lead to hard-copy data leaks.

Click the **View** icon in the **ACTION** column to view detailed information, including the username, file name, file path, printer name, PC name, and violation date and time.

<figure><img src="https://1102323068-files.gitbook.io/~/files/v0/b/gitbook-x-prod.appspot.com/o/spaces%2FSrTJQs663dZ9Te4UU3O8%2Fuploads%2FJGk215LIhHResfAH7pqk%2FPrinting%20Incidents.png?alt=media&amp;token=a2cd501f-7ec8-432f-a39c-3aa655830be8" alt=""><figcaption></figcaption></figure>

Click the menu icon (**☰**) in the **ACTION** column to drill down further into the details, and use the search filter at the top to quickly filter for specific information.

#### Keystroke Capture

The Keystroke Capture widget helps you detect specific keywords or phrases typed by users that match predefined monitoring criteria (for example, financial terms, project codes, or classified labels). It helps detect early signs of policy violations, insider threats, or attempts to exfiltrate sensitive data through manual entry or chat messages. Additionally, screenshots are captured at the moment users type sensitive words, allowing you to visually review the exact scenario and better understand the intent and risk behind each action.

Click the **View** icon in the **ACTION** column to view detailed information, including the username, application name, PC name, violation date and time, and a screenshot of the violation.

<figure><img src="https://1102323068-files.gitbook.io/~/files/v0/b/gitbook-x-prod.appspot.com/o/spaces%2FSrTJQs663dZ9Te4UU3O8%2Fuploads%2FTDYMkrklERhTWH2YoCI6%2FKeystroke%20Capture.png?alt=media&amp;token=33311ca2-3e53-4778-bbc7-f0cfa1a4e157" alt=""><figcaption></figcaption></figure>

Click the menu icon (**☰**) in the **ACTION** column to drill down further into the details, and use the search filter at the top to quickly filter for specific information.

#### Copy Paste

The Copy Paste widget helps you monitor how sensitive information is copied and pasted into non-corporate applications across your organisation, giving you visibility into potential data leakage risks. The widget provides an overview of users involved and the number of incidents associated with each user. Additionally, screenshots are captured at the moment sensitive content is pasted, allowing you to visually review the exact scenario and better understand the intent and risk behind each action.

Click the **View** icon in the **ACTION** column to view detailed information, including PC name, username, violation date and time, and a screenshot of the violation.&#x20;

<figure><img src="https://1102323068-files.gitbook.io/~/files/v0/b/gitbook-x-prod.appspot.com/o/spaces%2FSrTJQs663dZ9Te4UU3O8%2Fuploads%2F4sH5PfSe8pngB1WWghVf%2FCopy%20Paste.png?alt=media&amp;token=a46bca0c-97e8-413f-81d1-fd3ed849d64d" alt=""><figcaption></figcaption></figure>

Click the menu icon (**☰**) in the **ACTION** column to drill down further into the details, and use the search filter at the top to quickly filter for specific information.

#### Access of Documents on Local Devices

The **Access of Documents on Local Devices** widget helps you track when Office documents, such as Word, Excel, or PowerPoint files, are opened on local devices. Tracking local document access helps ensure files are viewed only by authorised users and assists in identifying unusual access outside regular working patterns.

Click the **View** icon in the **ACTION** column to view detailed information, including the username, file name, file path, PC name, and violation date and time.&#x20;

<figure><img src="https://1102323068-files.gitbook.io/~/files/v0/b/gitbook-x-prod.appspot.com/o/spaces%2FSrTJQs663dZ9Te4UU3O8%2Fuploads%2FJ1WJ1CIaWRc4naUySn0H%2FAccess%20of%20Documents%20on%20Local%20Devices.png?alt=media&amp;token=e9c08379-a987-4bec-842f-1c2ee9146b6d" alt=""><figcaption></figcaption></figure>

Click the menu icon (**☰**) in the **ACTION** column to drill down further into the details, and use the search filter at the top to quickly filter for specific information.

#### Usage of AI Tools

The **Usage of AI Tools** widget helps you track any instance where corporate files are uploaded to AI-powered platforms such as ChatGPT, Gemini, and similar tools. These tools may inadvertently store or process sensitive information externally.

Click the **View** icon in the **ACTION** column to view detailed information, including the username, application name, URL, PC name, and violation date and time.&#x20;

<figure><img src="https://1102323068-files.gitbook.io/~/files/v0/b/gitbook-x-prod.appspot.com/o/spaces%2FSrTJQs663dZ9Te4UU3O8%2Fuploads%2F7ijouNkXimYVpCXBlqgw%2FUsage%20of%20AI%20Tools.png?alt=media&amp;token=26cd7d1b-28fa-45a8-9b8e-49455162ea3c" alt=""><figcaption></figcaption></figure>

Click the menu icon (**☰**) in the **ACTION** column to drill down further into the details, and use the search filter at the top to quickly filter for specific information.

#### Usage of Non-Corporate Websites

The **Usage of Non-Corporate Websites** widget helps you track how much time users spend browsing or interacting with non-corporate websites. It helps identify productivity risks and potential exposure to untrusted domains.

<figure><img src="https://1102323068-files.gitbook.io/~/files/v0/b/gitbook-x-prod.appspot.com/o/spaces%2FSrTJQs663dZ9Te4UU3O8%2Fuploads%2F7GHxLFP98ZzFzICdKD6o%2FUsage%20of%20Non-Corporate%20Websites.png?alt=media&amp;token=370cbfe5-31d1-4ce8-9c75-0f139fa90e97" alt=""><figcaption></figcaption></figure>

Click the **View** icon in the **ACTION** column to view detailed information, including the username, PC name, website source, total time spent on the website, and violation date. Use the search filter at the top to quickly filter specific information.

#### Usage of Non-Corporate Applications

The **Usage of Non-Corporate Applications** widget helps you monitor the use of unapproved applications that are not part of your organisation’s authorised software list. Frequent use of such tools can introduce vulnerabilities, create compliance risks, or bypass existing security controls.

<figure><img src="https://1102323068-files.gitbook.io/~/files/v0/b/gitbook-x-prod.appspot.com/o/spaces%2FSrTJQs663dZ9Te4UU3O8%2Fuploads%2FNvAwG6eeHbLnSbKF83GD%2FUsage%20of%20Non-Corporate%20Applications.png?alt=media&amp;token=b0ee9c4d-d820-4175-8494-9c2a05ff067e" alt=""><figcaption></figcaption></figure>

Click the **View** icon in the **ACTION** column to view detailed information, including the username, PC name, application source, total time spent on the application, and violation date. Use the search filter at the top to quickly filter specific information.

### Data Type Risks

#### Widgets in Data Type Risks

<table><thead><tr><th width="274">Category</th><th>Widget Name</th></tr></thead><tbody><tr><td><strong>Incident Overview</strong></td><td><a href="#incidents-by-data-type">Incidents By Data Type</a></td></tr><tr><td><strong>File and Data Transfers</strong></td><td><a href="#application-transfer">Application Transfer</a></td></tr><tr><td>​</td><td><a href="#website-uploads">Website Uploads</a></td></tr><tr><td>​</td><td><a href="#storage-transfers">Storage Transfers</a></td></tr><tr><td><strong>Email and Printing</strong></td><td><a href="#printed-files">Printed Files</a></td></tr><tr><td>​</td><td><a href="#emails">Emails</a></td></tr><tr><td><strong>User Activity</strong></td><td><a href="#document-views">Document Views</a></td></tr><tr><td>​</td><td><a href="#keystrokes">Keystrokes</a></td></tr><tr><td>​</td><td><a href="#copy-paste-1">Copy Paste</a></td></tr></tbody></table>

#### Incidents By Data Type

The **Incidents by Data Type** widget provides a breakdown of detected incidents based on predefined data types, helping you understand how sensitive information is being handled across different channels. You can use this widget to identify which types of sensitive data are most at risk, how they are being exposed, and through which user activities.

This widget allows you to investigate incidents at multiple levels of detail:

* **Summary View:** Displays an overview of incidents grouped by data type, helping you identify which sensitive data categories are most frequently involved in policy violations across different activities and channels.<br>

  <figure><img src="https://1102323068-files.gitbook.io/~/files/v0/b/gitbook-x-prod.appspot.com/o/spaces%2FSrTJQs663dZ9Te4UU3O8%2Fuploads%2FZt0tqY9telb61nzxn61j%2FIncidents%20By%20Data%20Type.png?alt=media&amp;token=11664435-3eeb-449d-b39c-b06c0fe110d8" alt=""><figcaption></figcaption></figure>
* **Incident Details View:** Click a specific record to view detailed incident information, such as username, violation date and time, activity type, device name, file name, application, and detected data type.<br>

  <figure><img src="https://1102323068-files.gitbook.io/~/files/v0/b/gitbook-x-prod.appspot.com/o/spaces%2FSrTJQs663dZ9Te4UU3O8%2Fuploads%2FTfxnHYrS6mc9G3d8mUfH%2FIncidents%20By%20Data%20Type%20-%20drilldown%201.png?alt=media&amp;token=91429952-2748-4534-97c7-208c57ac50eb" alt=""><figcaption></figcaption></figure>
* **Detected Content View:** Click the menu icon (☰) in the **ACTION** column to further investigate the incident and view the specific sensitive data or matched policy content detected within the file or activity.<br>

  <figure><img src="https://1102323068-files.gitbook.io/~/files/v0/b/gitbook-x-prod.appspot.com/o/spaces%2FSrTJQs663dZ9Te4UU3O8%2Fuploads%2FF5YFYRvfB2IDxNOOMQrY%2FIncidents%20By%20Data%20Type%20-%20drilldown.png?alt=media&amp;token=02e74bd9-39d1-473f-b783-418882a05d31" alt=""><figcaption></figcaption></figure>

#### Application Transfer

The **Application Transfer** widget helps you track policy violations detected during file transfers through specific applications or cloud-based services such as Dropbox, Google Drive, OneDrive, FileZilla, and WhatsApp. It provides visibility into tools, whether corporate-approved or not, being used to move data and users involved in moving the data, helping identify potential data-leakage channels or policy violations. You can filter the data by application name, data type, and user.

<figure><img src="https://1102323068-files.gitbook.io/~/files/v0/b/gitbook-x-prod.appspot.com/o/spaces%2FSrTJQs663dZ9Te4UU3O8%2Fuploads%2FfzaBB6senmxmewAJmmfT%2FApplication%20Transfer.png?alt=media&amp;token=2cbdcd24-736a-4d66-abce-9b979dd733bd" alt=""><figcaption></figcaption></figure>

Click a specific record to view detailed information, including the username, date and time of the violation, application name, device name, file name, data type, and so on.

<figure><img src="https://1102323068-files.gitbook.io/~/files/v0/b/gitbook-x-prod.appspot.com/o/spaces%2FSrTJQs663dZ9Te4UU3O8%2Fuploads%2F1VWzCi7TjqEXeNCMGFyH%2FApplication%20Transfer%20-%20Drill%20down%201.png?alt=media&amp;token=b923820e-fa4c-40d6-ba8a-aaa120f49569" alt=""><figcaption></figcaption></figure>

Click the menu icon (**☰**) in the **ACTION** column to further drill down into detected content in the transferred file.

<figure><img src="https://1102323068-files.gitbook.io/~/files/v0/b/gitbook-x-prod.appspot.com/o/spaces%2FSrTJQs663dZ9Te4UU3O8%2Fuploads%2F0evW1XVKSZNolyHWhs9h%2FApplication%20Transfer%20-%20Drill%20down%202.png?alt=media&amp;token=8e0c658b-cc3b-445b-bdca-906010a67c30" alt=""><figcaption></figcaption></figure>

#### Printed Files

The **Printed Files** widget helps you track violations related to printing activities and identify potential data leaks through physical copies. It helps you identify unauthorised or excessive printing of sensitive or confidential documents and trace which users and devices were involved. You can filter the data by printer name, rule, and user.

<figure><img src="https://1102323068-files.gitbook.io/~/files/v0/b/gitbook-x-prod.appspot.com/o/spaces%2FSrTJQs663dZ9Te4UU3O8%2Fuploads%2FGRNfvWvopvMfqoWOwIL6%2FPrinted%20files.png?alt=media&amp;token=4f57fbde-03cc-410c-b8f8-af5b0623df39" alt=""><figcaption></figcaption></figure>

Click a specific record to view detailed information, including the username, date and time of the violation, printer name, file name, data type, printer's location, first 500 characters of the printed document, and so on.&#x20;

<figure><img src="https://1102323068-files.gitbook.io/~/files/v0/b/gitbook-x-prod.appspot.com/o/spaces%2FSrTJQs663dZ9Te4UU3O8%2Fuploads%2FPu3kpIQdBeLhD6O7zr1L%2FPrinted%20files%20-%20drillldown.png?alt=media&amp;token=bf09423b-4b94-4961-9766-e9e67d65b005" alt=""><figcaption></figcaption></figure>

Click the menu icon (**☰**) in the **ACTION** column to further drill down into detected content in the printed file.

#### Emails

The **Emails** widget helps you track email-related policy violations across both message content and attachments, helping you monitor how sensitive information is shared within your organisation. It includes detailed insights into violations found in emails sent through both corporate and non-corporate accounts, allowing you to identify risks and ensure compliance with communication policies.

<figure><img src="https://1102323068-files.gitbook.io/~/files/v0/b/gitbook-x-prod.appspot.com/o/spaces%2FSrTJQs663dZ9Te4UU3O8%2Fuploads%2Fkp1ntfk6WXs9R6XLNVhU%2FEmails%20-%20Data%20type%20Risks.png?alt=media&amp;token=0289092d-9953-4b41-970e-dcd05c5de8aa" alt=""><figcaption></figcaption></figure>

Click a specific record to view detailed information, including the username, date and time of the violation, email provider, subject, data type, file name, device name, sender and recipient information, VPN used or not, location, SSID, and the first 500 characters of the email content.&#x20;

<figure><img src="https://1102323068-files.gitbook.io/~/files/v0/b/gitbook-x-prod.appspot.com/o/spaces%2FSrTJQs663dZ9Te4UU3O8%2Fuploads%2FpVW5Yc2q9ReKSp2Sx44l%2FEmails%20drilldown%20-%20Data%20type%20Risks.png?alt=media&amp;token=0e8fc2ea-261a-41c1-b073-acc676961d0c" alt=""><figcaption></figcaption></figure>

Click the menu icon (**☰**) in the **ACTION** column to further drill down into detected content in the printed file.

#### Website Uploads

The **Website Uploads** widget helps you detect and prevent potential data leaks by identifying websites where sensitive content was uploaded or shared. This widget shows which files are transferred and the total number of uploads or transfers to both corporate and non-corporate websites, such as public file-sharing services or personal cloud storage platforms, along with the users who initiated them.

<figure><img src="https://1102323068-files.gitbook.io/~/files/v0/b/gitbook-x-prod.appspot.com/o/spaces%2FSrTJQs663dZ9Te4UU3O8%2Fuploads%2Fji2N7M6FIdRALXIROvdP%2FWebsite%20Uploads.png?alt=media&amp;token=ab9ef859-71cc-40cb-b858-3af1864ec56c" alt=""><figcaption></figcaption></figure>

Click a specific record to view detailed information, including the username, violation date and time, website URL, file name, device name, VPN used or not, location, SSID, and the first 500 characters of the transferred file.&#x20;

<figure><img src="https://1102323068-files.gitbook.io/~/files/v0/b/gitbook-x-prod.appspot.com/o/spaces%2FSrTJQs663dZ9Te4UU3O8%2Fuploads%2FlYCFExKJ8idKu4r2I8ak%2FWebsite%20Uploads%20-%20drilldown.png?alt=media&amp;token=9dc8e7a1-0589-4e70-9d0a-472a0fb86e92" alt=""><figcaption></figcaption></figure>

Click the menu icon (**☰**) in the **ACTION** column to further drill down into detected content in the transferred file.

#### Storage Transfers

The **Storage Transfers** widget helps you detect and prevent potential data leaks by identifying files copied or transferred to removable media. This widget shows the total number of files transferred to USB drives or external storage devices, along with the users who performed these actions, and provides detailed visibility into file transfers to help you ensure they align with your organisation’s policies.

<figure><img src="https://1102323068-files.gitbook.io/~/files/v0/b/gitbook-x-prod.appspot.com/o/spaces%2FSrTJQs663dZ9Te4UU3O8%2Fuploads%2F8GkSHXnOUn27tXeKHLid%2FStorage%20Transfers.png?alt=media&amp;token=671d6ab6-5b17-457f-964f-45e5cf4e52b0" alt=""><figcaption></figcaption></figure>

Click a specific record to view detailed information, including the username, violation date and time, website URL, file name, device name, file path, data type, VPN used or not, location, SSID, serial number of the USB, and the first 500 characters of the transferred file.&#x20;

<figure><img src="https://1102323068-files.gitbook.io/~/files/v0/b/gitbook-x-prod.appspot.com/o/spaces%2FSrTJQs663dZ9Te4UU3O8%2Fuploads%2FsBpQldUEw1w4O913UOtR%2FStorage%20Transfers%20-%20drilldown.png?alt=media&amp;token=adac9e43-31e1-4bfe-90dc-14aa5f0f3a4b" alt=""><figcaption></figcaption></figure>

Click the menu icon (**☰**) in the **ACTION** column to further drill down into detected content in the transferred file.

#### Document Views

The **Document Views** widget helps you monitor how sensitive documents are accessed and viewed across your organisation. It provides detailed visibility into user activity, such as which documents were viewed and who viewed them, to ensure that confidential files are only accessed by authorised users within authorised limits.

<figure><img src="https://1102323068-files.gitbook.io/~/files/v0/b/gitbook-x-prod.appspot.com/o/spaces%2FSrTJQs663dZ9Te4UU3O8%2Fuploads%2FzFCGksEbaeHaQjJc31Yj%2FDocument%20Views.png?alt=media&amp;token=24f14705-ce57-49d2-81e6-c957a6dd8f56" alt=""><figcaption></figcaption></figure>

Click a specific record to view detailed information, including the username, violation date and time, data type, VPN used or not, application used to view the file, file name, device name, file path, location, SSID, and the first 500 characters of the viewed file.&#x20;

<figure><img src="https://1102323068-files.gitbook.io/~/files/v0/b/gitbook-x-prod.appspot.com/o/spaces%2FSrTJQs663dZ9Te4UU3O8%2Fuploads%2Fj2fDqC1j94LuqHWhtnoC%2FDocument%20Views%20-%20drilldown.png?alt=media&amp;token=87832190-8314-4295-b815-e6624e381acc" alt=""><figcaption></figcaption></figure>

Click the menu icon (**☰**) in the **ACTION** column to further drill down into detected content in the viewed file.

#### Keystrokes

The **Keystrokes** widget helps you track and monitor sensitive phrases entered by users across your organisation. It enables you to detect potential insider threats and identify attempts to manually share confidential information through chat messages, documents, or forms.

<figure><img src="https://1102323068-files.gitbook.io/~/files/v0/b/gitbook-x-prod.appspot.com/o/spaces%2FSrTJQs663dZ9Te4UU3O8%2Fuploads%2FaEbKX9GkW09OkofX1c0z%2FKeystrokes.png?alt=media&amp;token=0b458948-9bed-4835-ac3e-b989d5ab4ce5" alt=""><figcaption></figcaption></figure>

Click a specific record to view detailed information, including the username, violation date and time, data type, VPN used or not, application used to view the file, device name, location, and SSID. The widget also **includes a screenshot** of the user’s screen at the time the sensitive phrase was entered, providing additional context for investigation.&#x20;

<figure><img src="https://1102323068-files.gitbook.io/~/files/v0/b/gitbook-x-prod.appspot.com/o/spaces%2FSrTJQs663dZ9Te4UU3O8%2Fuploads%2FTJZtNkwVjr5ZLZavv9H2%2FKeystrokes%20drilldown.png?alt=media&amp;token=f632a139-8755-43a0-aab9-e4b3117563ce" alt=""><figcaption></figcaption></figure>

Click the menu icon (**☰**) in the **ACTION** column to further analyse the detected content.

#### Copy Paste

The **Copy Paste** widget helps you monitor how data is transferred between applications through copy and paste actions. It provides visibility into potential data leakage by identifying when sensitive information is copied and pasted from one application to another.

<figure><img src="https://1102323068-files.gitbook.io/~/files/v0/b/gitbook-x-prod.appspot.com/o/spaces%2FSrTJQs663dZ9Te4UU3O8%2Fuploads%2FZh7ECw7UtiVmDsJ0UdXV%2FCopy%20Paste%20-%20Data%20type%20Rsks.png?alt=media&amp;token=8abd7a5f-4a85-476e-b788-9f451be81205" alt=""><figcaption></figcaption></figure>

Click a specific record to view detailed information, including the username, violation date and time, source application, target application, data type, VPN used or not, application used to view the file, device name, location, and SSID. The widget also includes a screenshot of the user’s screen at the time the sensitive content was pasted, providing additional context for investigation.&#x20;

<figure><img src="https://1102323068-files.gitbook.io/~/files/v0/b/gitbook-x-prod.appspot.com/o/spaces%2FSrTJQs663dZ9Te4UU3O8%2Fuploads%2F3feiMyQyEPNUX3GCDR5P%2FCopy%20Paste%20drilldown%20-%20Data%20type%20Rsks.png?alt=media&amp;token=84afa4e0-9eda-47f0-982b-57ecf5ce5c37" alt=""><figcaption></figcaption></figure>

Click the menu icon (**☰**) in the **ACTION** column to further analyse the copied content.

### SharePoint Risks

#### Widgets in SharePoint Risks

<table><thead><tr><th width="274">Category</th><th>Widget Name</th></tr></thead><tbody><tr><td><strong>File and User Activity</strong></td><td><a href="#sharepoint-file-access-and-download-logs-by-file-name-or-by-platform">SharePoint File Access And Download Logs By File Name Or By Platform</a></td></tr><tr><td><strong>Library Activity</strong></td><td><a href="#sharepoint-activity-logs-by-library-name">SharePoint Activity Logs By Library Name</a></td></tr><tr><td><strong>Link and Access Management</strong></td><td><a href="#sharepoint-anonymous-link-creation-by-file-name-or-by-username">SharePoint Anonymous Link Creation By File Name Or By Username</a></td></tr><tr><td>​</td><td><a href="#sharepoint-external-file-access-logs-by-file-name-or-by-username">SharePoint External File Access Logs By File Name Or By Username</a></td></tr><tr><td><strong>Downloads and Access by Platform</strong></td><td><a href="#sharepoint-file-download-logs-by-file-name">SharePoint File Download Logs By File Name</a></td></tr><tr><td>​</td><td><a href="#sharepoint-file-access-logs-by-platform">SharePoint File Access Logs By Platform</a></td></tr><tr><td>​</td><td><a href="#sharepoint-file-download-logs-by-platform">SharePoint File Download Logs By Platform</a></td></tr></tbody></table>

#### SharePoint File Access And Download Logs By File Name Or By Platform

The **SharePoint File Access And Download Logs By File Name Or By Platform** widget displays detailed logs of file access and download activity for SharePoint files. It provides visibility into how and where files are being used across your organisation’s SharePoint environment, helping you track external collaboration and detect potential unauthorised sharing through anonymous or external access links. You can filter the data by filename, platform name, and IP address.

For each file, the widget shows:

* **Secure Links Created**: Number of secure or organisation-approved sharing links created.
* **Anonymous Links Created**: Number of public or unrestricted sharing links generated.
* **Accessed by (Internal/External)**: Number of times files were accessed by internal or external users.
* **Downloaded by (Internal/External)**: Number of times files were downloaded within or outside the organisation.<br>

  <figure><img src="https://1102323068-files.gitbook.io/~/files/v0/b/gitbook-x-prod.appspot.com/o/spaces%2FSrTJQs663dZ9Te4UU3O8%2Fuploads%2FD8fUfb75RWnreSaFbCAq%2FSharePoint%20File%20Access%20And%20Download%20Logs%20By%20File%20Name%20Or%20By%20Platform.png?alt=media&amp;token=c6f164b3-f82c-4abd-b419-48a4800c269f" alt=""><figcaption></figcaption></figure>

Click a specific record to view detailed information, including the user who accessed or shared the file, file path, incident date and time, browser name, and so on.

#### SharePoint Activity Logs By Library Name

The **SharePoint Activity Logs By Library Name** widget displays activity logs for SharePoint libraries, showing file access, sharing, and download activity within each document library. It helps you track how data is being used within different libraries and identify which files or folders are being accessed most frequently, and detect unusual access patterns.

<figure><img src="https://1102323068-files.gitbook.io/~/files/v0/b/gitbook-x-prod.appspot.com/o/spaces%2FSrTJQs663dZ9Te4UU3O8%2Fuploads%2FTzBE4zSMLCW1navLmlAI%2FSharepoint%20Activity%20Logs%20By%20Library%20Name.png?alt=media&amp;token=97bba927-e878-4f67-aa53-cf40c429d999" alt=""><figcaption></figcaption></figure>

For each library, the widget lists details such as:

* **File Path and Site Name:** Location of the library and the associated SharePoint site.
* **File Name:** Name of the file stored in that library.
* **Secure Links Created / Anonymous Links Created:** Number of secure or public links generated for files within the library.
* **Accessed by (Internal/External):** Number of times files were accessed by internal staff or external users.
* **Downloaded by (Internal/External):** Number of times files were downloaded inside or outside the organisation.

Click a specific record to view detailed information, including the user who accessed the file, file name, file path, URL, incident date and time, browser name, and so on.

#### SharePoint Anonymous Link Creation By File Name Or By Username

The **SharePoint Anonymous Link Creation By File Name Or By Username** widget displays details of anonymous link creation activity within SharePoint. It helps you identify when files are shared publicly through links that allow access without authentication. The **SharePoint Anonymous Link Creation By File Name Or By Username** widget is crucial for monitoring data exposure risks, as anonymous links bypass user identity verification and can be forwarded to unauthorised recipients. By tracking which files and users are involved, you can review, revoke, or restrict public sharing and enforce secure link policies. You can filter the data by file name or user name.

For each file or user, the widget shows:

* **Number of Users:** How many users created anonymous links for the listed files.
* **Number of Incidents:** How many times anonymous links were generated for the same file or by the same user.

Click a specific record to view detailed information, including the user who created the link, file name, file path, URL, incident date and time, browser name, and so on.

#### SharePoint External File Access Logs By File Name Or By Username

The **SharePoint External File Access Logs By File Name Or By Username** widget provides visibility into external access activity for SharePoint files. It helps you track when and how files stored in SharePoint are being accessed by users outside the organisation’s domain. The **SharePoint External File Access Logs By File Name Or By Username** widget is essential for identifying data exposure risks through external collaboration or sharing. By reviewing external access patterns, you can verify whether file-sharing aligns with business requirements and take action to revoke access or strengthen permissions when needed. You can filter the data by file name or user name.

For each file or user, the widget includes:

* **Number of Users:** Total external users who accessed the file.
* **Number of Incidents:** Total number of times the file was accessed externally.

Click a specific record to view detailed information, including the user who accessed the file, file name, file path, URL, incident date and time, browser name, and so on.

#### SharePoint File Download Logs By File Name

The **SharePoint File Download Logs By File Name** widget displays detailed logs of file download activity within SharePoint. It helps you track which files are being downloaded, by whom, and how often, helping ensure that downloads comply with organisational data handling policies. You can filter the data by internal or external users.

For each file, the widget shows:

* **Number of Users:** Total users who downloaded the file.
* **Incidents:** Total number of download actions recorded for that file.

Click a specific record to view detailed information, including the user who downloaded the file, file name, file path, URL, incident date and time, browser name, and so on.

#### SharePoint File Access Logs By Platform

The **SharePoint File Access Logs By Platform** widget displays detailed records of SharePoint file access activity, categorised by platform or device type. It provides visibility into which operating systems and applications are being used to access SharePoint files, helping you detect unusual access from unauthorised devices, such as personal mobile phones or unregistered systems. You can filter the data by internal or external users.

For each platform, the widget shows:

* **Number of Users:** Total users who accessed files using that platform.
* **Incidents:** Total number of access events recorded for that platform.

Click a specific record to view detailed information, including the user who accessed the file, file name, file path, URL, incident date and time, browser name, and so on.

#### SharePoint File Download Logs By Platform

The **SharePoint File Download Logs By Platform** widget shows detailed information on SharePoint file download activity, categorised by platform or device type. It helps you identify which devices and operating systems are being used to download files, offering insights into unusual download patterns, such as large file transfers from unverified devices or unapproved operating systems. You can filter the data by internal or external users.

For each platform, the widget displays:

* **Number of Users:** Total users who downloaded files using that platform.
* **Incidents:** Total number of download actions recorded for that platform.

Click a specific record to view detailed information, including the user who downloaded the file, file name, file path, URL, incident date and time, browser name, and so on.

### AI Usage Risks

#### Widgets in AI Usage Risks

<table><thead><tr><th width="274">Category</th><th>Widget Name</th></tr></thead><tbody><tr><td><strong>AI Application Usage</strong></td><td><a href="#time-spent-on-generative-ai-application">Time Spent On Generative AI Application</a></td></tr><tr><td>​</td><td><a href="#file-uploaded-to-generative-ai-application">File Uploaded To Generative AI Application</a></td></tr><tr><td><strong>AI Website Usage</strong></td><td><a href="#time-spent-on-generative-ai-website">Time Spent On Generative AI Website</a></td></tr><tr><td>​</td><td><a href="#file-uploaded-to-generative-ai-website">File Uploaded To Generative AI Website</a></td></tr><tr><td><strong>Prompt Monitoring</strong></td><td><a href="#sensitive-prompt-used-in-website">Sensitive Prompt Used In Website</a></td></tr></tbody></table>

#### Time Spent On Generative AI Application

The **Time Spent On Generative AI Application** widget displays how much time users spend using installed Generative AI applications on their devices, such as the desktop version of ChatGPT (e.g. `CHATGPT.EXE`) or other desktop-based AI tools. It shows the number of users who accessed the application and the total time spent, helping you understand how frequently AI tools are being used within the organisation. You can use this information to assess productivity impact, detect unauthorised AI tool usage, and ensure compliance with organisational policies.

Click the **View** icon in the **ACTION** column to view detailed information, including the username, application name, and total time spent on the application.&#x20;

<figure><img src="https://1102323068-files.gitbook.io/~/files/v0/b/gitbook-x-prod.appspot.com/o/spaces%2FSrTJQs663dZ9Te4UU3O8%2Fuploads%2FyJJuW8QEU5zSB5eC54PG%2FTime%20Spent%20On%20Generative%20AI%20Application.png?alt=media&amp;token=0c4b4137-377c-4138-a35d-865cb984b24d" alt=""><figcaption></figcaption></figure>

Click the menu icon (**☰**) in the **ACTION** column to further analyse the incident details.

<figure><img src="https://1102323068-files.gitbook.io/~/files/v0/b/gitbook-x-prod.appspot.com/o/spaces%2FSrTJQs663dZ9Te4UU3O8%2Fuploads%2FyizG7h6j9YDMVIFyzhhm%2FTime%20Spent%20On%20Generative%20AI%20Application%20-%20drilldown.png?alt=media&amp;token=16dc1acc-2e40-44a3-ba5e-e99f876e7db6" alt=""><figcaption></figcaption></figure>

#### Time Spent On Generative AI Website

The **Time Spent On Generative AI Website** widget displays time spent on AI websites or domains, listing the number of users and the total time spent on each platform. It provides visibility into how long employees interact with AI websites such as *ChatGPT*, *Claude*, *Gemini*, *DeepSeek*, and *so on*. You can use it to monitor engagement levels with AI tools, detect excessive usage, and evaluate whether users are relying on external AI systems for work-related tasks.

Click the **View** icon in the **ACTION** column to view detailed information, including the username, website URL, and total time spent on the website.&#x20;

Click the menu icon (**☰**) in the **ACTION** column to further analyse the incident details.

#### File Uploaded To Generative AI Application

The **File Uploaded to Generative AI Application** widget helps you monitor file uploads to installed generative AI applications, such as CHATGPT.EXE and similar desktop-based AI tools. It shows which user uploaded which files to which AI applications, helping you track potential sharing of sensitive data. It helps you detect when corporate documents, reports, or other sensitive files are shared in AI software. This is useful for preventing data leakage through unmanaged or offline AI applications that bypass browser-based monitoring.

Click the **View** icon in the **ACTION** column to view detailed information, including the username, violation date and time, file name, application name, device name, VPN used or not, SSID, and location.&#x20;

Click the menu icon (**☰**) in the **ACTION** column to further analyse the incident details.

#### File Uploaded To Generative AI Website

The **File Uploaded to Generative AI Website** widget helps you monitor file uploads to web-based generative AI platforms, such as *ChatGPT*, *Claude*, *Gemini*, *Perplexity, and so on*. It provides visibility into which users uploaded which files to which online AI tools, helping you identify potential exposure of sensitive information.

Click the **View** icon in the **ACTION** column to view detailed information, including the username, violation date and time, URL, file name, device name, VPN used or not, SSID, and location. Click the menu icon (**☰**) in the **ACTION** column to further analyse the incident details.

#### Sensitive Prompt Used In Website

The **Sensitive Prompts Used in Website** widget helps you monitor how users interact with web-based generative AI platforms using potentially sensitive prompts. It provides visibility into the type and frequency of sensitive information being entered into AI websites, helping you identify data exposure risks. It helps you review prompt-level violations and take corrective actions such as user training or access restrictions.

Click the **View** icon in the **ACTION** column to view detailed information, including the username, violation date and time, URL, device name, VPN used or not, SSID, and location.&#x20;

Click the menu icon (**☰**) in the **ACTION** column to further analyse the incident details.

### Behaviour Risks

#### Widgets in Behaviour Risks

<table><thead><tr><th width="274">Category</th><th>Widget Name</th></tr></thead><tbody><tr><td><strong>Productivity Monitoring</strong></td><td><a href="#productivity">Productivity</a></td></tr><tr><td><strong>Activity Monitoring</strong></td><td><a href="#heatmap">Heatmap</a></td></tr></tbody></table>

#### Productivity

The **Productivity** widget shows time spent by users on productive, unproductive, or uncategorised applications and websites. These categories are configured in [Organisation Settings](/documentation/insight-v4/insight-v5/organisation-settings), where applications and websites marked as **Organisational** are treated as productive, and **Non-organisational** are treated as unproductive. This widget helps you evaluate how users spend their time and identify opportunities to improve efficiency.

<figure><img src="https://1102323068-files.gitbook.io/~/files/v0/b/gitbook-x-prod.appspot.com/o/spaces%2FSrTJQs663dZ9Te4UU3O8%2Fuploads%2FFTtVOlMn0gZxN1M6Sz0Z%2FProductivity.png?alt=media&amp;token=20a1e5fb-6613-4a2d-a4b6-09ee1dd3e0ab" alt=""><figcaption></figcaption></figure>

Click a percentage record to see the list of applications used by the user and the time spent on each application.&#x20;

<figure><img src="https://1102323068-files.gitbook.io/~/files/v0/b/gitbook-x-prod.appspot.com/o/spaces%2FSrTJQs663dZ9Te4UU3O8%2Fuploads%2FdIGfQziM64FQBU06lrhi%2FProductivity%20-%20drilldown.png?alt=media&amp;token=a58eca6e-ba49-4f01-bbc9-00b8815d0927" alt=""><figcaption></figcaption></figure>

#### Heatmap

The **Heatmap** widget helps you analyse application usage patterns and identify periods of increased activity across users throughout the day. This widget displays user activity in a visual heatmap format, where each row represents a user and each column represents an hourly time period. Colour intensity indicates the level of application usage during that period, allowing you to quickly identify peak activity hours, unusual behaviour patterns, or excessive application usage.

<figure><img src="https://1102323068-files.gitbook.io/~/files/v0/b/gitbook-x-prod.appspot.com/o/spaces%2FSrTJQs663dZ9Te4UU3O8%2Fuploads%2FL0tGwvTLGPhHjWKM28nJ%2FHeatmap.png?alt=media&amp;token=b62b5b22-67a6-4fe9-ab35-d0331b64e6b9" alt=""><figcaption></figcaption></figure>

Hover over a specific record to view the number of incidents recorded during that time period. Click the record to see detailed information such as incident date and time, application name, vendor, and total time spent on each application.

<figure><img src="https://1102323068-files.gitbook.io/~/files/v0/b/gitbook-x-prod.appspot.com/o/spaces%2FSrTJQs663dZ9Te4UU3O8%2Fuploads%2F9ZJuxfZbtWtqPUMySQVq%2FHeatmap%20-%20drilldown.png?alt=media&amp;token=790bd47d-c733-4c18-8b1a-1228ef7300a3" alt=""><figcaption></figcaption></figure>

### Label Events

#### Widgets in Label Events

<table><thead><tr><th width="274">Category</th><th>Widget Name</th></tr></thead><tbody><tr><td><strong>Label Monitoring</strong></td><td><a href="#office-document">Office Document</a></td></tr><tr><td>​</td><td><a href="#email">Email</a></td></tr></tbody></table>

#### Office Document

The **Office Document** widget helps you track activities involving classified or sensitivity-labelled Microsoft Office documents within the organisation. This widget displays details of the labelled Office documents, helping you identify how sensitive or classified information is being created, modified, or accessed across the organisation.

Click the menu icon (**☰**) to expand the record and view detailed information such as label name, device name, host application, incident date and time, and URL of the document. <br>

<figure><img src="https://1102323068-files.gitbook.io/~/files/v0/b/gitbook-x-prod.appspot.com/o/spaces%2FSrTJQs663dZ9Te4UU3O8%2Fuploads%2FZIb7tU2eFeC0szcBlafH%2FOffice%20Document.png?alt=media&amp;token=8a2db015-69e4-4406-807c-af4fbb24b9be" alt=""><figcaption></figcaption></figure>

You can also switch between **By User** and **By Label** views to analyse incidents from different perspectives.

#### Email

The **Email** widget helps you track email activities involving classified or sensitivity-labelled information within the organisation. This widget displays details of the labelled emails, helping you identify how sensitive or classified information is being shared through emails.

Click the menu icon (**☰**) to expand the record and view detailed information such as label name, device name, host application from where the email was sent, incident date and time, sender, recipient, and email subject.&#x20;

<figure><img src="https://1102323068-files.gitbook.io/~/files/v0/b/gitbook-x-prod.appspot.com/o/spaces%2FSrTJQs663dZ9Te4UU3O8%2Fuploads%2FgFxdsQBhws9FBijp7S91%2FEmail.png?alt=media&amp;token=1929c95f-e7cf-4f0a-80ee-55259cbc24be" alt=""><figcaption></figcaption></figure>

You can also switch between **By User** and **By Label** views to analyse incidents from different perspectives.

### Location Risks

**Location Risks** help you identify and analyse risk activities based on geographical locations. It helps organisations detect suspicious cross-region activities and gain better visibility into where sensitive data interactions are occurring. It provides a world map view highlighting countries where risks have been detected, allowing you to quickly identify regions with higher risk activity. The **Country List** table provides a detailed breakdown of incidents by country across different activity types, such as document views, email, storage transfer, web posts, data transfers, file uploads, printing, keystrokes, and copy-paste actions.

<figure><img src="https://1102323068-files.gitbook.io/~/files/v0/b/gitbook-x-prod.appspot.com/o/spaces%2FSrTJQs663dZ9Te4UU3O8%2Fuploads%2FpBGLE3tttA3JCDRe3ZY6%2Flocation%20risk%20widget.png?alt=media&amp;token=9b21953d-657e-4df3-bada-7e4c2ead57ca" alt=""><figcaption></figcaption></figure>

Click on any incident count to view detailed information, including username, device name, violated rule name, file name, email details, incident date and time, and so on. Click the menu icon (**☰**) to further drill down into detected content in each activity.

<figure><img src="https://1102323068-files.gitbook.io/~/files/v0/b/gitbook-x-prod.appspot.com/o/spaces%2FSrTJQs663dZ9Te4UU3O8%2Fuploads%2FX8JxJrOfsRLo3lxZ863B%2FLocation%20Risk%20-%20drilldown.png?alt=media&amp;token=e0c4e95c-9350-4857-b665-58ef65c4f8f3" alt=""><figcaption></figcaption></figure>

### Protected Files

#### Widgets in Protected Files

<table><thead><tr><th width="314.79998779296875">Category</th><th>Widget Name</th></tr></thead><tbody><tr><td><strong>File and Data Transfers</strong></td><td><a href="#application-transfer-protected">Application Transfer</a></td></tr><tr><td></td><td><a href="#email-attachments-protected">Email Attachments</a></td></tr><tr><td></td><td><a href="#website-uploads-protected">Website Uploads</a></td></tr><tr><td></td><td><a href="#storage-transfers-protected">Storage Transfers</a></td></tr></tbody></table>

#### Application Transfer

The **Application Transfer** widget helps you monitor the transfer of **protected files** through specific applications or cloud-based services such as Dropbox, Google Drive, OneDrive, FileZilla, and WhatsApp. It provides visibility into where protected files are being transferred, the applications being used, and the users involved in the transfers, helping you verify that protected data is being handled appropriately and identify potential policy violations or attempts to move sensitive information outside authorised channels. You can filter the data by application name and user.

<figure><img src="https://1102323068-files.gitbook.io/~/files/v0/b/gitbook-x-prod.appspot.com/o/spaces%2FSrTJQs663dZ9Te4UU3O8%2Fuploads%2FnTqQtAYIAwUmpY7BkBNY%2FApplication%20Transfer%20-%20Protected%20files.png?alt=media&amp;token=9f53d2bc-799a-466f-9eb7-2fbcb0c4eda4" alt=""><figcaption></figcaption></figure>

Click an incident count to view detailed information, including the username, date and time of the violation, application name, device name, file name, data type, and so on.&#x20;

<figure><img src="https://1102323068-files.gitbook.io/~/files/v0/b/gitbook-x-prod.appspot.com/o/spaces%2FSrTJQs663dZ9Te4UU3O8%2Fuploads%2F3bUseDDBYalQuNm6aRd1%2FApplication%20Transfer%20drilldown%20-%20Protected%20files.png?alt=media&amp;token=9974cc4e-b18e-4db7-b6e7-f89e0ed2f950" alt=""><figcaption></figcaption></figure>

You can export the widget’s data to **PDF or Excel** by clicking the **Download Excel** or **Download PDF** **icons** in the top-right corner of the page.

#### Email Attachments

The **Email Attachments** widget helps you monitor how **protected files** are shared through email attachments. It provides visibility into which protected files are being sent, the users sending them, and the email accounts used, helping you ensure that sensitive information is shared in accordance with your organisation’s policies. This widget helps identify potential policy violations, unauthorised sharing of protected files, and risks associated with transmitting sensitive data through email. You can filter the data by user and email provider.

<figure><img src="https://1102323068-files.gitbook.io/~/files/v0/b/gitbook-x-prod.appspot.com/o/spaces%2FSrTJQs663dZ9Te4UU3O8%2Fuploads%2FaKTq5WokIF7fmHiw9v0u%2FEmail%20Attachments%20-%20Protected%20Files.png?alt=media&amp;token=7d5725eb-10a2-48c1-8a2a-a99c35db0e98" alt=""><figcaption></figcaption></figure>

Click an incident count to view detailed information, including the email provider, email subject, sender and recipient email addresses, file name, device name, username, date and time of the violation, data type, whether a VPN was used, SSID, and the sender's location.&#x20;

You can export the widget’s data to **PDF or Excel** by clicking the **Download Excel** or **Download PDF** **icons** in the top-right corner of the page.

#### Website Uploads

The **Website Uploads** widget helps you monitor the upload of **protected files** to websites, including both corporate and non-corporate platforms such as file-sharing services, cloud storage sites, and web applications. It provides visibility into which protected files are being uploaded, the websites receiving the files, and the users performing the uploads, helping you ensure that sensitive information is shared only through authorised channels. This widget helps identify potential policy violations and reduce the risk of sensitive data being exposed through web-based transfers. You can filter the data by website and user.

<figure><img src="https://1102323068-files.gitbook.io/~/files/v0/b/gitbook-x-prod.appspot.com/o/spaces%2FSrTJQs663dZ9Te4UU3O8%2Fuploads%2FldV0z9l6DWzISgl23tX3%2FWebsite%20Uploads%20-%20Protected%20files.png?alt=media&amp;token=93ace6db-b39a-402b-9839-cd88a5dfde67" alt=""><figcaption></figcaption></figure>

Click an incident count to view detailed information, including the username, violation date and time, website URL, file name, device name, data type, VPN used or not, SSID, and location.

You can export the widget’s data to **PDF or Excel** by clicking the **Download Excel** or **Download PDF** **icons** in the top-right corner of the page.

#### Storage Transfers

The **Storage Transfers** widget helps you monitor the transfer of **protected files** to removable and external storage devices, such as USB drives and external hard drives. It provides visibility into which protected files are being transferred, the users performing the transfers, and the devices involved, helping you ensure that sensitive information is handled in accordance with your organisation’s policies. This widget helps identify potential policy violations and reduce the risk of data leakage through removable media.&#x20;

<figure><img src="https://1102323068-files.gitbook.io/~/files/v0/b/gitbook-x-prod.appspot.com/o/spaces%2FSrTJQs663dZ9Te4UU3O8%2Fuploads%2FGHMInktgpEoUjmoB9YPc%2FStorage%20Transfers%20-%20Protected%20files.png?alt=media&amp;token=cc402dcc-df81-4f18-9a6b-45b924d5772a" alt=""><figcaption></figcaption></figure>

Click an incident count to view detailed information, including the device name, file name, file path, serial number of the USB, violation date and time, data type, VPN used or not, SSID, and location.

You can export the widget’s data to **PDF or Excel** by clicking the **Download Excel** or **Download PDF** **icons** in the top-right corner of the page.

### System Risks

#### Widgets in System Risks

<table><thead><tr><th width="274">Category</th><th>Widget Name</th></tr></thead><tbody><tr><td><strong>Activity Status</strong></td><td><a href="#online-devices">Online Devices</a></td></tr><tr><td>​</td><td><a href="#online-users">Online Users</a></td></tr><tr><td>​</td><td><a href="#online-web-console-users">Online Web Console Users</a></td></tr><tr><td>​</td><td><a href="#last-cloud-sync">Last Cloud Sync</a></td></tr><tr><td><strong>Inventory and Lists</strong></td><td><a href="#list-of-devices">List of Devices</a></td></tr><tr><td>​</td><td><a href="#list-of-users">List of Users</a></td></tr><tr><td>​</td><td><a href="#list-of-web-console-users">List of Web Console Users</a></td></tr><tr><td><strong>Administration and Monitoring</strong></td><td><a href="#audit-log">Audit Log</a></td></tr><tr><td>​</td><td><a href="#guardware-cloud-monitor">GuardWare Cloud Monitor</a></td></tr><tr><td>​</td><td><a href="#database-tables">Database Tables</a></td></tr><tr><td><strong>Device Inventory</strong></td><td><a href="#devices---software-installed">Devices - Software Installed</a></td></tr><tr><td>​</td><td><a href="#devices---hardware-specification">Devices - Hardware Specification</a></td></tr></tbody></table>

#### Online Devices

The **Online Devices** widget displays the total number of devices that are active in the environment. This widget helps you quickly monitor endpoint availability and determine which systems are active across the network.

<figure><img src="https://1102323068-files.gitbook.io/~/files/v0/b/gitbook-x-prod.appspot.com/o/spaces%2FSrTJQs663dZ9Te4UU3O8%2Fuploads%2Fqf0AYWQj5MnwHNHyWlIa%2FOnline%20DEVICES.png?alt=media&amp;token=1b450b4a-5848-446e-8bac-d095a641b601" alt=""><figcaption></figcaption></figure>

#### Online Users

The **Online Users** widget displays the total number of users currently active in the environment. This widget helps you monitor active user sessions.

#### Online Web Console Users

The **Online Web Console Users** widget displays the number of users currently logged in to the GuardWare Management console. This widget helps you monitor active console access and track administrative or monitoring activities within the platform.

#### Last Cloud Sync

The **Last Cloud Sync** widget displays the most recent cloud synchronisation time between the endpoint devices and the Cloud Monitor. This widget helps you verify whether cloud synchronisation is occurring successfully and identify potential delays in data updates or communication.

#### List of Devices

The **List of Devices** widget provides detailed information about online and offline endpoint devices, such as device name, serial number, assigned username, and last online time, helping administrators monitor device connectivity and user-device associations. You can switch between **Online** and **Offline** views to filter devices based on their current connection status.

<figure><img src="https://1102323068-files.gitbook.io/~/files/v0/b/gitbook-x-prod.appspot.com/o/spaces%2FSrTJQs663dZ9Te4UU3O8%2Fuploads%2FsLJRWjRk18A7dRHtOzYT%2FList%20of%20devices.png?alt=media&amp;token=c0fddb29-94be-4fcc-abe9-2818a8ca869c" alt=""><figcaption></figcaption></figure>

#### List of Users

The **List of Users** widget displays users associated with endpoint devices along with their assigned device names and last online time. This widget helps you monitor user activity and identify when users were last connected to the system. You can switch between **Online** and **Offline** views to filter users based on their activity status.

<figure><img src="https://1102323068-files.gitbook.io/~/files/v0/b/gitbook-x-prod.appspot.com/o/spaces%2FSrTJQs663dZ9Te4UU3O8%2Fuploads%2FiKhudYaX7XMBArmdLVQz%2FList%20of%20users.png?alt=media&amp;token=aa42c81c-5d42-4472-9690-cd3fa75d13e6" alt=""><figcaption></figcaption></figure>

#### List of Web Console Users

The **List of Web Console Users** widget displays users who have access to the GuardWare Management console, along with their last online activity. This widget helps you monitor console access and track user login activity within the management console. You can switch between **Online** and **Offline** views to filter users based on their login status.

#### Audit Log

The **Audit Log** widget provides a record of user and system activities performed within the Management Console. It displays details such as username, activity performed, and event time, helping you monitor administrative actions, track user activity history, and maintain audit visibility for security and compliance purposes.

<figure><img src="https://1102323068-files.gitbook.io/~/files/v0/b/gitbook-x-prod.appspot.com/o/spaces%2FSrTJQs663dZ9Te4UU3O8%2Fuploads%2FLI45hXhlS2gwTaTiOLEf%2Faudit%20log.png?alt=media&amp;token=6b4f3b76-2e24-4f0f-bcfe-a7acdadace5c" alt=""><figcaption></figcaption></figure>

#### GuardWare Cloud Monitor

The **GuardWare Cloud Monitor** widget displays the certificate/token expiry information of the Cloud Monitor along with the last updated time. This widget helps you monitor certificate validity, ensure uninterrupted cloud communication, and identify certificates or tokens approaching expiration.

#### Database Tables

The **Database Tables** widget provides visibility into database usage and storage statistics within the environment. It displays details such as table name, row count, and table size in MB, helping you monitor database growth, identify large or heavily used tables, and manage storage utilisation more effectively.

#### Devices - Software Installed

The **Devices - Software Installed** widget provides information about software installed across endpoint devices. It displays details such as software name, vendor, description, example installation path, and the number of devices where the software is installed. This widget helps you monitor software inventory, identify unauthorised or unapproved applications, and gain visibility into software distribution across devices. You can switch between **By Software** and **By PC** views to analyse the data from different perspectives.

<figure><img src="https://1102323068-files.gitbook.io/~/files/v0/b/gitbook-x-prod.appspot.com/o/spaces%2FSrTJQs663dZ9Te4UU3O8%2Fuploads%2Fmo16l9bgOj1HWGnLojah%2FDevices%20-%20Software%20installed.png?alt=media&amp;token=4c525cf1-8322-4609-a417-4ae6f2abce19" alt=""><figcaption></figcaption></figure>

#### Devices - Hardware Specification

The **Devices - Hardware Specification** widget provides detailed hardware information for endpoint devices. It displays details such as device name, RAM, available free space, CPU information, hardware change count, and last audit time. This widget helps you monitor device hardware configurations, track hardware changes, and maintain visibility into system resources and endpoint specifications across the organisation.

<figure><img src="https://1102323068-files.gitbook.io/~/files/v0/b/gitbook-x-prod.appspot.com/o/spaces%2FSrTJQs663dZ9Te4UU3O8%2Fuploads%2Fh3hfYzQ1gklAQtjBLAns%2FDevices%20-%20Hardware%20Specs.png?alt=media&amp;token=96877ab6-44da-443c-9b3a-7209c695f362" alt=""><figcaption></figcaption></figure>

## Create a New Dashboard

1. Navigate to ***INSIGHT > Dashboard***.
2. Click **Configure Dashboards**.<br>

   <figure><img src="https://1102323068-files.gitbook.io/~/files/v0/b/gitbook-x-prod.appspot.com/o/spaces%2FSrTJQs663dZ9Te4UU3O8%2Fuploads%2FOQ2YbLbimf1iJ5IkFdue%2FConfigure%20Dashboards.png?alt=media&amp;token=6b390561-d664-4474-a760-629bfa9f3dba" alt=""><figcaption></figcaption></figure>
3. Click **+New Dashboard**.<br>

   <figure><img src="https://1102323068-files.gitbook.io/~/files/v0/b/gitbook-x-prod.appspot.com/o/spaces%2FSrTJQs663dZ9Te4UU3O8%2Fuploads%2FashLl1AVzHmqLQ5rgboq%2F%2BNew%20Dashboard.png?alt=media&amp;token=396d04a0-357c-40b6-a714-9e8420519c6a" alt=""><figcaption></figcaption></figure>
4. In **General Details**:
   1. Enter the **Dashboard Name** and **Description.** Use a clear, descriptive name that reflects the dashboard’s purpose.
   2. Select the **Duration** for which you want the data to be displayed (for example, Daily, Weekly, Monthly).
   3. Select **Set as an Active Dashboard** to make it visible and accessible from the Dashboard page. You can switch between active dashboards at any time using the **Switch Dashboard** dropdown.
   4. Click **Next**.<br>

      <figure><img src="https://1102323068-files.gitbook.io/~/files/v0/b/gitbook-x-prod.appspot.com/o/spaces%2FSrTJQs663dZ9Te4UU3O8%2Fuploads%2FGqVZFxxp147Lc45kAa4Y%2FAdd%20new%20dashboard%20-%20General%20details.png?alt=media&amp;token=b0365d9d-3d79-4de4-a907-bb2bc550d037" alt=""><figcaption></figcaption></figure>
5. In **Select Devices:**
   1. Search and select the devices you want to monitor in this dashboard and click **Next**. The dashboard will show activities performed on those specific devices only.
   2. You can also select a configured **Advanced Setting** from the dropdown to display only the devices associated with the selected Advanced Setting.<br>

      <figure><img src="https://1102323068-files.gitbook.io/~/files/v0/b/gitbook-x-prod.appspot.com/o/spaces%2FSrTJQs663dZ9Te4UU3O8%2Fuploads%2FdTVB7PZKNnS113oyRZAG%2FAdd%20new%20dashboard%20-%20Select%20devices.png?alt=media&amp;token=c275a88e-79e2-47a7-b6b6-6fe99a126874" alt=""><figcaption></figcaption></figure>
6. In **Select Users:**
   1. Search and select the users whose data you want to monitor in this dashboard and click **Next**.
   2. You can also select a configured **User policy** from the **Select policy dropdown** to display only the users associated with the selected policy.<br>

      <figure><img src="https://1102323068-files.gitbook.io/~/files/v0/b/gitbook-x-prod.appspot.com/o/spaces%2FSrTJQs663dZ9Te4UU3O8%2Fuploads%2FnwRhC5fjlWxJ0HqP2ESM%2FAdd%20new%20dashboard%20-%20Select%20users.png?alt=media&amp;token=dd511714-3c64-4b16-ad6d-72e375a16148" alt=""><figcaption></figcaption></figure>
7. In **Select Data Types**, search and select the data types you want to monitor in this dashboard and click **Next**.\
   ![](https://1102323068-files.gitbook.io/~/files/v0/b/gitbook-x-prod.appspot.com/o/spaces%2FSrTJQs663dZ9Te4UU3O8%2Fuploads%2FmgA94rsf8PhzeOCvmPql%2FAdd%20new%20dashboard%20-%20Select%20data%20type.png?alt=media\&token=2b0f4dd6-3119-40c6-b170-fd2484fbf9a8)
8. In **Select Risks**, select the risks you want to monitor in this dashboard and click **Next**. These risks are displayed in Risk Summary.<br>

   <figure><img src="https://1102323068-files.gitbook.io/~/files/v0/b/gitbook-x-prod.appspot.com/o/spaces%2FSrTJQs663dZ9Te4UU3O8%2Fuploads%2FzhN5HTOmvk9VJ4lMXJIp%2FAdd%20new%20dashboard%20-%20Select%20risks.png?alt=media&amp;token=e6621e64-4c7b-4e8e-b622-fc5d84700b7d" alt=""><figcaption></figcaption></figure>
9. In **Select Widget**, select the widgets to customise your dashboard insights and click **Review and Save**. Only the selected widgets appear in the dashboard.<br>

   <figure><img src="https://1102323068-files.gitbook.io/~/files/v0/b/gitbook-x-prod.appspot.com/o/spaces%2FSrTJQs663dZ9Te4UU3O8%2Fuploads%2FmL4obT3iZ0eCvLss30ld%2FAdd%20new%20dashboard%20-%20Select%20widgets.png?alt=media&amp;token=e4aa9c2b-32e6-492e-ac09-7863aea46fe8" alt=""><figcaption></figcaption></figure>
10. Review the details and click **Save** to confirm the configuration. You'll see the newly created dashboard in the **Dashboards** list, from where you can view and edit the details.

## Edit a Dashboard

1. Navigate to ***INSIGHT > Dashboard***.
2. Click **Configure Dashboards**.
3. Search for the dashboard you want to edit and click **Edit** in the **ACTIONS** column.<br>

   <figure><img src="https://1102323068-files.gitbook.io/~/files/v0/b/gitbook-x-prod.appspot.com/o/spaces%2FSrTJQs663dZ9Te4UU3O8%2Fuploads%2F7dPlI72kDJYCQZ7H1QnV%2FEdit%20a%20dashboard.png?alt=media&amp;token=caaff31c-2bed-46d3-8ea7-6892d8650433" alt=""><figcaption></figcaption></figure>
4. Update the details and click **Review and Save**.

## Delete a Dashboard

1. Navigate to ***INSIGHT > Dashboard***.
2. Click **Configure Dashboards**.
3. Search for the dashboard you want to delete and click the **Delete** icon in the **ACTIONS** column.<br>

   <figure><img src="https://1102323068-files.gitbook.io/~/files/v0/b/gitbook-x-prod.appspot.com/o/spaces%2FSrTJQs663dZ9Te4UU3O8%2Fuploads%2F3L6VQk4ZXpmNdo3qH8av%2FDelete%20a%20dashboard.png?alt=media&amp;token=eee404d5-92b4-4587-bc83-a20e2d307ea1" alt=""><figcaption></figcaption></figure>
4. In the confirmation alert, click **Yes, Delete it!** to confirm.

## View a Dashboard's Details

1. Navigate to ***INSIGHT > Dashboard***.
2. Click **Configure Dashboards**.<br>

   <figure><img src="https://1102323068-files.gitbook.io/~/files/v0/b/gitbook-x-prod.appspot.com/o/spaces%2FSrTJQs663dZ9Te4UU3O8%2Fuploads%2FxktOfREn13JL4rt1znMS%2FView%20dashboard's%20details.png?alt=media&amp;token=04aabfd3-3f05-4855-8793-d3da2d8d9b14" alt=""><figcaption></figcaption></figure>
3. Search for the dashboard you want to view and click **View Details** in the **ACTIONS** column.\
   \
   You can review the selected dashboard's configuration, including the dashboard name, description, duration, and active status, along with the selected devices, users, data types, risks, and widgets. This helps you verify the dashboard setup before making changes.

## Set a Dashboard as Active

1. Navigate to ***INSIGHT > Dashboard***.
2. Click **Configure Dashboards**.
3. Search for the dashboard you want to set as active and enable the **SET AS ACTIVE** toggle.<br>

   <figure><img src="https://1102323068-files.gitbook.io/~/files/v0/b/gitbook-x-prod.appspot.com/o/spaces%2FSrTJQs663dZ9Te4UU3O8%2Fuploads%2FdgTGdEmENBCFnyFIloiN%2FSet%20as%20active.png?alt=media&amp;token=16e1b148-d7e3-4f09-92fa-bccbee8b34ca" alt=""><figcaption></figcaption></figure>

<br>


# Advanced Settings

Advanced Settings define the global monitoring parameters applied across audit reports and device policies in GuardWare INSIGHT. They function as the central control point for how monitoring is configured and enforced across the organisation.

These settings determine how INSIGHT operates on end-user devices, including the methods used to monitor the movement of sensitive data, the applications, URLs, and file extensions that are included or excluded from monitoring, and the configuration of communication between devices and the server.

## Reference Table

The table below provides an overview of every Advanced Setting and what it does.

<table><thead><tr><th width="269">Section</th><th>What It Does</th></tr></thead><tbody><tr><td><a href="#report-upload-and-communication-settings"><strong>Report Upload &#x26; Communication Settings</strong></a></td><td>Controls the intervals, durations, timeouts, and bandwidth settings for uploading reports and downloading policies and commands.</td></tr><tr><td><a href="#applications-monitored-at-network-level"><strong>Applications Monitored at Network Level</strong></a></td><td>Lists applications monitored for sensitive data uploads at the network level.</td></tr><tr><td><a href="#ip-address-monitored-at-network-level"><strong>IP Address Monitored at Network Level</strong></a></td><td>Lists IP addresses included or excluded from network-level monitoring.</td></tr><tr><td><a href="#applications-with-monitored-ssl-traffic"><strong>Applications with Monitored SSL Traffic</strong></a></td><td>Defines which applications have their SSL traffic monitored when network monitoring is used.</td></tr><tr><td><a href="#websites-with-monitored-ssl-traffic"><strong>Websites with Monitored SSL Traffic</strong></a></td><td>Defines which websites have their SSL traffic monitored using certificate common names.</td></tr><tr><td><a href="#applications-with-monitored-keystrokes-and-copy-paste"><strong>Applications with Monitored Keystrokes and Copy/Paste</strong></a></td><td>Specifies applications where keystroke and copy/paste activity is monitored or excluded.</td></tr><tr><td><a href="#websites-with-monitored-keystrokes-and-copy-paste"><strong>Websites with Monitored Keystrokes and Copy/Paste</strong></a></td><td>Specifies websites where keystroke and copy/paste activity is monitored or excluded.</td></tr><tr><td><a href="#applications-monitored-at-network-level-lsp"><strong>Applications Monitored at Network Level (LSP)</strong></a></td><td>Lists applications monitored at the network level using the LSP approach.</td></tr><tr><td><a href="#status-of-client-components"><strong>Status of Client Components</strong></a></td><td>Lists client components and controls whether each is enabled or disabled.</td></tr><tr><td><a href="#file-extensions-monitored-at-file-system-level"><strong>File Extensions Monitored at File System Level</strong></a></td><td>Filters file upload monitoring by file extension type.</td></tr><tr><td><a href="#applications-monitored-at-file-system-level"><strong>Applications Monitored at File System Level</strong></a></td><td>Lists applications monitored for sensitive data uploads at the file system level.</td></tr><tr><td><a href="#applications-monitored-at-file-system-level-to-provide-file-path-information"><strong>Applications Monitored at File System Level to Provide File Path Information</strong></a></td><td>Lists applications monitored to provide full file path data for network monitoring.</td></tr><tr><td><a href="#applications-monitored-at-file-system-level-where-repeated-incidents-are-ignored"><strong>Applications Monitored at File System Level where Repeated Incidents are Ignored</strong></a></td><td>Suppresses repeated incident alerts from specified applications at the file system level.</td></tr><tr><td><a href="#applications-hosting-websites-with-end-to-end-encryption"><strong>Applications Hosting Websites with End-to-End Encryption</strong></a></td><td>Lists browser applications monitored at the file system level to intercept file uploads on end-to-end encrypted websites.</td></tr><tr><td><a href="#websites-with-end-to-end-encryption"><strong>Websites with End-to-End Encryption</strong></a></td><td>Lists websites with end-to-end encryption where file system monitoring is required alongside network monitoring.</td></tr></tbody></table>

## Create an Advanced Setting

Before configuring any monitoring parameters, an Advanced Setting policy must be created first. Once created, it starts in an Inactive state and needs to be configured before being activated and applied to devices.

<figure><img src="https://1102323068-files.gitbook.io/~/files/v0/b/gitbook-x-prod.appspot.com/o/spaces%2FSrTJQs663dZ9Te4UU3O8%2Fuploads%2FgYmrcxM3R5PjAWclyXIc%2Fimage.png?alt=media&amp;token=1c7af734-fb96-433a-9c91-92065ac978ba" alt=""><figcaption></figcaption></figure>

1. Navigate to **INSIGHT** > **Advanced Settings**.
2. Click **+ New Advanced Setting**.

{% stepper %}
{% step %}

### Configure Policy Info

3. In the **Policy Info** tab, fill in the following fields and click **Next**:<br>

   <figure><img src="https://1102323068-files.gitbook.io/~/files/v0/b/gitbook-x-prod.appspot.com/o/spaces%2FSrTJQs663dZ9Te4UU3O8%2Fuploads%2FW75J3SceJMlwrcpJTR7w%2Fimage.png?alt=media&amp;token=2c9a19f4-c1cd-43bd-8d92-475195eb8436" alt="" width="563"><figcaption></figcaption></figure>

   1. **Copy Settings From (Optional):** Select an existing Advanced Setting to copy its configuration into this new one. Useful for duplicating a baseline policy instead of starting from scratch.
   2. **Setting Name:** Enter a clear, identifiable name for the setting.
   3. **Description:** Briefly describe what this setting is for, who it applies to, or how it differs from other settings.
   4. **Set as Default Setting (Optional):** Marks this as the organisation-wide default. Only one default setting can be active at a time; it is automatically assigned to all newly created users and can be duplicated to create policy variations from a common baseline.
      {% endstep %}

{% step %}

### Configure Settings

Once created, the **Advanced Setting** starts in an **Inactive** state. Configure the required settings, then activate when ready to apply to devices. Each setting can be enabled or disabled. Disabling a setting reverts it to its default state, which disables the functionality associated with it.

<figure><img src="https://1102323068-files.gitbook.io/~/files/v0/b/gitbook-x-prod.appspot.com/o/spaces%2FSrTJQs663dZ9Te4UU3O8%2Fuploads%2FIwyXAFKbipiLxRsErTQt%2Fimage.png?alt=media&amp;token=421ea632-b105-4fdf-9c1d-01f9f9edcd32" alt=""><figcaption></figcaption></figure>

<details>

<summary>Report Upload &#x26; Communication Settings</summary>

The intervals, durations, timeouts, and bandwidth settings that control the uploading of reports and downloading of policies and commands.

<figure><img src="https://1102323068-files.gitbook.io/~/files/v0/b/gitbook-x-prod.appspot.com/o/spaces%2FSrTJQs663dZ9Te4UU3O8%2Fuploads%2FAmXOfTmKfkqwzHr58UcA%2Fimage.png?alt=media&amp;token=47bbe8e9-db09-4709-a443-d507579a15f8" alt=""><figcaption></figcaption></figure>

1. Click the checkbox to select the setting or click **View Setting** to open the configuration window.

**Report Upload Settings:** This setting controls how monitoring data is packaged and sent from client devices to the server.

<table><thead><tr><th width="148">Field</th><th width="112">Default</th><th>What It Means</th></tr></thead><tbody><tr><td><strong>Bulk Report Packet Size</strong></td><td>(in Bytes)</td><td>The size of each data packet sent during a bulk report upload. Smaller packets result in more frequent sends; larger packets mean fewer, heavier transfers.</td></tr><tr><td><strong>Report Interval</strong></td><td>(in Min)</td><td>How often the client sends a report to the server. Lower values provide more real-time data; higher values reduce server load.</td></tr><tr><td><strong>Bulk Report Time</strong></td><td>(in Min)</td><td>The time window during which bulk reports are sent. Use this to schedule heavy uploads during off-peak hours.</td></tr><tr><td><strong>Bulk Report Bandwidth</strong></td><td>(in Bytes/Sec)</td><td>The maximum bandwidth the client can use when uploading bulk reports. Set to <strong>0</strong> for no limit.</td></tr><tr><td><strong>Bulk Report Retry Interval</strong></td><td>(in Min)</td><td>How long the client continues retrying a failed report upload before stopping.</td></tr></tbody></table>

**Communication Settings:** This setting controls connection behaviour, timeouts, polling frequency, and heartbeat signals between the client and server.

<table><thead><tr><th width="154">Field</th><th width="98">Default</th><th>What It Means</th></tr></thead><tbody><tr><td><strong>Connection Timeout</strong></td><td>(in Sec)</td><td>How long the client waits for a server response before considering the connection failed.</td></tr><tr><td><strong>Common Timeout</strong></td><td>(in Sec)</td><td>A general timeout applied across standard communication operations.</td></tr><tr><td><strong>Communication Interval</strong></td><td>(in Min)</td><td>How frequently the client initiates a general communication cycle with the server.</td></tr><tr><td><strong>Communication Interval Status</strong></td><td>—</td><td>Indicates whether scheduled communication with the server is currently active.</td></tr><tr><td><strong>Command Interval</strong></td><td>(in Min)</td><td>How often the client checks for new commands from the server.</td></tr><tr><td><strong>Setting Interval</strong></td><td>(in Min)</td><td>How often settings are synchronized between client and server.</td></tr><tr><td><strong>Setting Status Interval</strong></td><td>—</td><td>Indicates whether automatic settings synchronization is currently active.</td></tr><tr><td><strong>Client Status Interval</strong></td><td>(in Min)</td><td>How often the client reports its status back to the server.</td></tr><tr><td><strong>Client Command Interval Status</strong></td><td>—</td><td>Indicates whether periodic command polling is currently active.</td></tr></tbody></table>

</details>

<details>

<summary>Applications Monitored at Network Level</summary>

List of applications that are monitored for sensitive data uploads at the network level. The proxy can only monitor applications that are explicitly on this list. If an application is not listed, its traffic will not be captured.

Use an exclude list with an empty list to apply monitoring to all applications. Using an include list for broad coverage is impractical and not recommended.

<figure><img src="https://1102323068-files.gitbook.io/~/files/v0/b/gitbook-x-prod.appspot.com/o/spaces%2FSrTJQs663dZ9Te4UU3O8%2Fuploads%2F0QqosuJIIGcXvoJ396tR%2Fimage.png?alt=media&amp;token=773b829a-a21a-4ead-acea-56ceda67b3d2" alt=""><figcaption></figcaption></figure>

1. Click the checkbox to select the setting or click **View Setting** to open the configuration window.
2. Use the **Search applications...** to check if the application is already listed.
3. If found, select the checkbox next to it to enable monitoring.
4. If not listed, enter the application name with its extension (e.g., `chrome.exe`) in the **Add Application** field and click **Add Application**.
5. Confirm the application appears in the list and is selected for monitoring.

</details>

<details>

<summary>IP Addresses Not Monitored at Network Level</summary>

List of IP addresses that are monitored, or not monitored, for sensitive data. This list is usually used to exclude IP addresses used by internal applications that are considered secure and do not need monitoring for the uploading of sensitive data.

<figure><img src="https://1102323068-files.gitbook.io/~/files/v0/b/gitbook-x-prod.appspot.com/o/spaces%2FSrTJQs663dZ9Te4UU3O8%2Fuploads%2FaPhCjPeGnz6gcsqpTBSw%2Fimage.png?alt=media&amp;token=7e841e97-de59-4fcd-adb4-552632ea1e34" alt=""><figcaption></figcaption></figure>

1. Click the checkbox to select the setting or click **View Setting** to open the configuration window.
2. Enter the IP address in the **Add IP** field.
3. Click **Add IP** to add it to the list.
4. Confirm the IP address appears in the list.

</details>

<details>

<summary>Applications with Monitored SSL Traffic</summary>

List of applications whose SSL traffic is monitored for sensitive data uploads. This setting is tied to the network monitoring approach. If network monitoring is enabled, SSL traffic monitoring should also be enabled for the relevant applications. This section can be configured as either an include list or an exclude list, depending on the scope of monitoring required.

<figure><img src="https://1102323068-files.gitbook.io/~/files/v0/b/gitbook-x-prod.appspot.com/o/spaces%2FSrTJQs663dZ9Te4UU3O8%2Fuploads%2F2CsRsE46shuplTrTFqml%2Fimage.png?alt=media&amp;token=3a3a0e06-00f3-44ca-93ba-a040e0c389ac" alt=""><figcaption></figcaption></figure>

1. Click the checkbox to select the setting or click **View Setting** to open the configuration window.
2. Select the appropriate mode:
   * **Include list:** Only the listed applications will have their SSL traffic monitored.
   * **Exclude list:** All applications will have their SSL traffic monitored except those listed. Leave the list empty to monitor all applications.
3. Select the checkbox next to the application to add it to the list.

</details>

<details>

<summary>Websites with Monitored SSL Traffic</summary>

List of websites whose SSL traffic is monitored for sensitive data uploads. To monitor SSL traffic for specific websites only, add their URLs to the include list. To monitor all SSL traffic, use the **Exclude List** option and leave the list empty.

<figure><img src="https://1102323068-files.gitbook.io/~/files/v0/b/gitbook-x-prod.appspot.com/o/spaces%2FSrTJQs663dZ9Te4UU3O8%2Fuploads%2F0xpyrm4IyLpqozCaMpKd%2Fimage.png?alt=media&amp;token=5bae95ac-f6cd-4854-8a8a-a5f91cc88df4" alt=""><figcaption></figcaption></figure>

1. Click the checkbox to select the setting or click **View Setting** to open the configuration window.
2. Select the appropriate mode:
   * **Include list:** Only SSL traffic for the listed websites will be monitored.
   * **Exclude list:** All SSL traffic will be monitored except for the listed websites.
3. If your desired website is not on the list, enter the website URL (e.g., `google.com`) in the **Add Website** field, confirm it appears in the list, and select it.

</details>

<details>

<summary>Applications with Monitored Keystrokes and Copy/Paste</summary>

List of applications where keystrokes and copy/paste activity are monitored, or not monitored, for sensitive data. This is particularly useful for restricting monitoring in sensitive applications such as password managers or tools that handle confidential input.

<figure><img src="https://1102323068-files.gitbook.io/~/files/v0/b/gitbook-x-prod.appspot.com/o/spaces%2FSrTJQs663dZ9Te4UU3O8%2Fuploads%2FtWZ41iIkYPWAR6dxSBKK%2Fimage.png?alt=media&amp;token=b4446a14-db2f-4047-a530-9a58ee7bf960" alt=""><figcaption></figcaption></figure>

1. Click the checkbox to select the setting or click **View Setting** to open the configuration window.
2. Select the appropriate mode:
   * **Include list:** Keystroke and copy/paste monitoring will apply only to the listed applications.
   * **Exclude list:** Keystroke and copy/paste monitoring will apply to all applications except those listed. Leave the list empty to monitor all applications.
3. Select the checkbox next to the application to add it to the list.

</details>

<details>

<summary>Websites with Monitored Keystrokes and Copy/Paste</summary>

List of websites where keystrokes and copy/paste activity are monitored, or not monitored, for sensitive data. This list is usually used to exclude banking or similar websites where users may type personal passwords.

<figure><img src="https://1102323068-files.gitbook.io/~/files/v0/b/gitbook-x-prod.appspot.com/o/spaces%2FSrTJQs663dZ9Te4UU3O8%2Fuploads%2F79AhHcVhurxqEufYNXVA%2Fimage.png?alt=media&amp;token=cebfb993-3a54-47c7-bd60-065f4e92e1a1" alt=""><figcaption></figcaption></figure>

1. Click the checkbox to select the setting or click **View Setting** to open the configuration window.
2. Select the appropriate mode:
   * **Include list:** Keystroke and copy/paste monitoring will apply only to the listed websites.
   * **Exclude list:** Keystroke and copy/paste monitoring will apply to all websites except those listed. Leave the list empty to monitor all websites.
3. Select the checkbox next to the website to add it to the list.

</details>

<details>

<summary>Applications Monitored at Network Level (LSP)</summary>

List of applications that are monitored for sensitive data uploads at the network level using the Layered Service Provider (LSP) approach. LSP is an alternative network interception method to WFP (Windows Filtering Platform).

<figure><img src="https://1102323068-files.gitbook.io/~/files/v0/b/gitbook-x-prod.appspot.com/o/spaces%2FSrTJQs663dZ9Te4UU3O8%2Fuploads%2FcFxW4HRyKEj0rgKZi9Le%2Fimage.png?alt=media&amp;token=889b99c5-743f-4a06-9838-ff832177709a" alt=""><figcaption></figcaption></figure>

1. Click the checkbox to select the setting or click **View Setting** to open the configuration window.
2. Enter the full file path to the application's DLL in the **Add Winsock Exception** field (e.g., `C:\Windows\System32\wsock32.dll`).
3. Click **Add New Exception** to add it to the list.
4. Confirm the entry appears in the list.

</details>

<details>

<summary>Status of Client Components</summary>

List of client components, such as drivers, and whether they are enabled or not. Each component can be set to **Default**, **Enable**, or **Disable** individually.

<figure><img src="https://1102323068-files.gitbook.io/~/files/v0/b/gitbook-x-prod.appspot.com/o/spaces%2FSrTJQs663dZ9Te4UU3O8%2Fuploads%2FS8SUovzLHQ9i1FmE6dLI%2Fimage.png?alt=media&amp;token=e06be926-c5ab-448e-bc4c-e428c1643d2f" alt=""><figcaption></figcaption></figure>

1. Click the checkbox to select the setting or click **View Setting** to open the configuration window.
2. Review the components listed and adjust each toggle as required.

<table><thead><tr><th width="125">Component</th><th width="102">Default</th><th width="107">Options</th><th>Description</th></tr></thead><tbody><tr><td><strong>Proxy Options</strong></td><td>Default</td><td>OFF / WFP / LSP</td><td>Controls the proxy mode used for network traffic interception. WFP (Windows Filtering Platform) and LSP (Layered Service Provider) are the two available interception methods.</td></tr><tr><td><strong>Proxy Extension</strong></td><td>Default</td><td>Enable / Disable</td><td>Enables or disables the proxy browser extension.</td></tr><tr><td><strong>GW Scanner</strong></td><td>Default</td><td>Enable / Disable</td><td>Monitors USB device insertions and tracks file-level changes on the system.</td></tr><tr><td><strong>GW Dogfile</strong></td><td>Default</td><td>Enable / Disable</td><td>Protects files within GuardWare directories from unauthorised modification or deletion.</td></tr><tr><td><strong>Chat Docmon</strong></td><td>Default</td><td>Enable / Disable</td><td>Monitors file usage by instant messaging applications at the file system level, including cloud-based services.</td></tr><tr><td><strong>USB Monitor</strong></td><td>Default</td><td>Enable / Disable</td><td>Tracks file transfers to USB devices connected to the system.</td></tr><tr><td><strong>GWPG (Process Guard)</strong></td><td>Default</td><td>Enable / Disable</td><td>Protects GuardWare processes from unauthorised termination. Operates as a kernel-level process for enhanced protection against tampering.</td></tr></tbody></table>

</details>

<details>

<summary>File Extensions Monitored at File System Level</summary>

List of file extensions that are monitored for sensitive data uploads at the file system level. Use this to focus monitoring on high-risk file types or to exclude low-risk types to reduce noise in reports.

<figure><img src="https://1102323068-files.gitbook.io/~/files/v0/b/gitbook-x-prod.appspot.com/o/spaces%2FSrTJQs663dZ9Te4UU3O8%2Fuploads%2FY3UimFpArYH5tJVgL7zB%2Fimage.png?alt=media&amp;token=fc990920-92a6-473a-a4eb-c7c98e127ec0" alt=""><figcaption></figcaption></figure>

1. Click the checkbox to select the setting or click **View Setting** to open the configuration window.
2. Select the appropriate mode:
   * **Include list:** Only uploads of the specified file extensions will be monitored.
   * **Exclude list:** All file uploads will be monitored except those with the specified extensions. Leave the list empty to monitor all file extensions.
3. Enter the file extension in the **Add Extension** field (e.g., `pdf`, `xlsx`, `zip`) and click **Add Extension**.
4. Confirm the extension appears in the list.

</details>

<details>

<summary>Applications Monitored at File System Level</summary>

List of applications that are monitored for sensitive data uploads at the file system level.

<figure><img src="https://1102323068-files.gitbook.io/~/files/v0/b/gitbook-x-prod.appspot.com/o/spaces%2FSrTJQs663dZ9Te4UU3O8%2Fuploads%2Fg7KLCeZdbpW0jbCLD47z%2Fimage.png?alt=media&amp;token=c7057036-0eb5-4b16-8c12-61bd103b129c" alt=""><figcaption></figcaption></figure>

1. Click the checkbox to select the setting or click **View Setting** to open the configuration window.
2. Select the checkbox next to the application to add it to the monitoring list.
3. If the application is not listed, enter the application name in the **Add Application** field and click **Add Application**.
4. Confirm the application appears in the list and is selected for monitoring.

</details>

<details>

<summary>Applications Monitored at File System Level to Provide File Path Information</summary>

List of applications monitored at the file system level to provide full file path information in network monitoring. Network monitoring captures the destination (the website) and the name of the uploaded file.

<figure><img src="https://1102323068-files.gitbook.io/~/files/v0/b/gitbook-x-prod.appspot.com/o/spaces%2FSrTJQs663dZ9Te4UU3O8%2Fuploads%2FDXdNCz4gpOPF4AtbOC56%2Fimage.png?alt=media&amp;token=b5b8e772-72fc-4e4a-a674-fc1499c7a0ea" alt=""><figcaption></figcaption></figure>

1. Click the checkbox to select the setting or click **View Setting** to open the configuration window.
2. Select the checkbox next to the application to add it to the monitoring list.
3. If the application is not listed, enter the application name in the **Add Application** field and click **Add Application**.
4. Confirm the application appears in the list and is selected for monitoring.

</details>

<details>

<summary>Applications Monitored at File System Level where Repeated Incidents are Ignored</summary>

List of applications monitored at the file system level where repeated incidents are ignored. This is usually used to prevent the over-reporting of file system activity that can occur when an application regularly uploads its internal files to its server, and those files contain content tagged as sensitive.

<figure><img src="https://1102323068-files.gitbook.io/~/files/v0/b/gitbook-x-prod.appspot.com/o/spaces%2FSrTJQs663dZ9Te4UU3O8%2Fuploads%2FxptkST9L8PeiYHPAiaqs%2Fimage.png?alt=media&amp;token=06ef6920-f488-4462-8cb5-203d1870d466" alt=""><figcaption></figcaption></figure>

1. Click the checkbox to select the setting or click **View Setting** to open the configuration window.
2. Select the appropriate mode:
   * **Include list:** Repeated incident suppression will apply only to the listed applications.
   * **Exclude list:** Repeated incident suppression will apply to all applications except those listed.
3. Select the checkbox next to the application to add it to the list.

</details>

<details>

<summary>Applications Hosting Websites with End-to-End Encryption</summary>

List of browser applications to be monitored at the file system level in order to intercept file uploads on websites with end-to-end encryption. For websites implementing end-to-end encryption, it is not possible to intercept file uploads using network monitoring alone.

Where end-to-end encrypted websites are permitted, and there is a concern that files containing sensitive data may be uploaded, both file system monitoring (file paths and contents) and network monitoring (destinations) are required in order to produce reports containing URL and file path information for the uploaded sensitive data.

<figure><img src="https://1102323068-files.gitbook.io/~/files/v0/b/gitbook-x-prod.appspot.com/o/spaces%2FSrTJQs663dZ9Te4UU3O8%2Fuploads%2Fwb0oA57oFJiUXrOxbDEh%2Fimage.png?alt=media&amp;token=0196ec90-0980-4a17-8885-8ad41b62a03f" alt=""><figcaption></figcaption></figure>

1. Click the checkbox to select the setting or click **View Setting** to open the configuration window.
2. Select the checkbox next to the application to add it to the monitoring list.
3. If the application is not listed, enter the application name in the **Add Application** field and click **Add Application**.
4. Confirm the application appears in the list and is selected for monitoring.

</details>

<details>

<summary>Websites with End-to-End Encryption</summary>

List of websites with end-to-end encryption. For websites implementing end-to-end encryption, it is not possible to intercept file uploads using network monitoring alone. Where end-to-end encrypted websites are permitted, and there is a concern that files containing sensitive data may be uploaded, both file system monitoring (file paths and contents) and network monitoring (destinations) are required in order to produce reports containing URL and file path information for the uploaded sensitive data.

<figure><img src="https://1102323068-files.gitbook.io/~/files/v0/b/gitbook-x-prod.appspot.com/o/spaces%2FSrTJQs663dZ9Te4UU3O8%2Fuploads%2FxExoKtQnUtRHR4Fxrrun%2Fimage.png?alt=media&amp;token=27304b59-dc87-4978-9fbf-05f04acfc0f5" alt=""><figcaption></figcaption></figure>

1. Click the checkbox to select the setting or click **View Setting** to open the configuration window.
2. Select the appropriate mode:
   * **Include list:** Only the listed websites will be subject to end-to-end encryption file upload monitoring.
   * **Exclude list:** All websites will be monitored except those listed.
3. Enter the website URL or page title in the input field and click **Add**.
4. Confirm the entry appears in the list.

</details>
{% endstep %}

{% step %}

### Review & Save

1. Scroll to the top of the page and click **Review & Save**. A summary of all configured settings will appear in the side panel.

   <figure><img src="https://1102323068-files.gitbook.io/~/files/v0/b/gitbook-x-prod.appspot.com/o/spaces%2FSrTJQs663dZ9Te4UU3O8%2Fuploads%2FDjN1gWE1encdnCGlMHK4%2Fimage.png?alt=media&amp;token=4b45238a-c114-49e0-bf6b-0fee20eb9aa0" alt="" width="563"><figcaption></figcaption></figure>
2. Review the configurations. To make any changes, close the panel, update the relevant settings, and click **Review & Save** again.

   <figure><img src="https://1102323068-files.gitbook.io/~/files/v0/b/gitbook-x-prod.appspot.com/o/spaces%2FSrTJQs663dZ9Te4UU3O8%2Fuploads%2FLdP4qAnUKyD31A0RNqz8%2Fimage.png?alt=media&amp;token=5491f739-af0a-41d2-b49e-461743cff3ee" alt="" width="563"><figcaption></figcaption></figure>
3. Once satisfied, click **Save** to apply the configuration.
   {% endstep %}
   {% endstepper %}

## Manage Advanced Settings

After creating an Advanced Setting, it can be assigned to devices, edited, or deleted from the Advanced Settings list. Devices assigned to a deleted setting automatically revert to the default setting, which cannot itself be deleted. Bulk actions are also available for deleting multiple settings or reassigning devices from one setting to another.

#### Assign Devices

1. Navigate to **INSIGHT** > **Advanced Settings.**
2. Click **Assign Devices** next to the setting you want to assign to a device.

   <figure><img src="https://1102323068-files.gitbook.io/~/files/v0/b/gitbook-x-prod.appspot.com/o/spaces%2FSrTJQs663dZ9Te4UU3O8%2Fuploads%2F3CZ8skG5lPRpNYrLujAE%2Fimage.png?alt=media&amp;token=bf02de2e-f19a-43cc-926e-4971d51e0bda" alt="" width="563"><figcaption></figcaption></figure>
3. Select devices to assign the setting to, or deselect them to remove the setting.
4. Click **Add** to apply changes.

{% hint style="info" %}

* A device can have only one advanced setting assigned at a time.
* Multiple devices can be assinged to an advanced setting.
* When a new advanced setting is assigned to a device, the existing advanced setting is automatically removed and replaced.
  {% endhint %}

#### Edit an Advanced Setting

1. Navigate to **INSIGHT** > **Advanced Settings.**
2. Click **Edit** next to the relevant setting.<br>

   <figure><img src="https://1102323068-files.gitbook.io/~/files/v0/b/gitbook-x-prod.appspot.com/o/spaces%2FSrTJQs663dZ9Te4UU3O8%2Fuploads%2Fb3oRH4omGFABNOJd4yH7%2Fimage.png?alt=media&amp;token=e0b09f7d-5520-41ed-8c20-56dba8b832e5" alt="" width="563"><figcaption></figcaption></figure>
3. Update the required fields and settings. The process follows the same steps as [creating a new Advanced Setting](#creating-an-advanced-setting).
4. Click **Review & Save** to review the changes.
5. Click **Update** to confirm changes.

#### Delete an Advanced Setting

1. Navigate to **INSIGHT** > **Advanced Settings**.
2. Click **Delete** next to the relevant setting.<br>

   <figure><img src="https://1102323068-files.gitbook.io/~/files/v0/b/gitbook-x-prod.appspot.com/o/spaces%2FSrTJQs663dZ9Te4UU3O8%2Fuploads%2FhhMckBnUMhUXKhbpeRCL%2Fimage.png?alt=media&amp;token=24f37c6b-6a8e-4d7d-afa6-9053c99b3d30" alt="" width="563"><figcaption></figcaption></figure>
3. Click **Yes, Delete it!** to confirm.

{% hint style="info" %}
To delete settings in bulk, click the checkboxes next to the settings and select the **Delete** <i class="fa-trash-can">:trash-can:</i> **icon**.
{% endhint %}


# DEVICES

The Devices section provides a centralised view of devices registered with the GuardWare server across licensed products. Administrators can monitor device status, manage assignments, and send commands directly from this section.

{% hint style="info" %}
Devices are displayed according to the products licensed for the organisation. If a product is not licensed, its associated device data will not appear.
{% endhint %}

### View Devices

The device list shows devices that register with the server when the relevant GuardWare agent is installed. Use this view to monitor agent status, verify assigned settings, and identify devices that need attention, such as devices that have not been online recently or are running an outdated agent version.

<figure><img src="https://1102323068-files.gitbook.io/~/files/v0/b/gitbook-x-prod.appspot.com/o/spaces%2FSrTJQs663dZ9Te4UU3O8%2Fuploads%2FBa9VeposLOf2hT3lfHjA%2Fimage.png?alt=media&amp;token=f38e918b-baa2-4eb3-b321-cff3a440871d" alt=""><figcaption></figcaption></figure>

<table><thead><tr><th width="236">Column</th><th>Description</th></tr></thead><tbody><tr><td><strong>Device Name</strong></td><td>The hostname of the device.</td></tr><tr><td><strong>User Name</strong></td><td>The user currently or last logged in to the device.</td></tr><tr><td><strong>Serial Number</strong></td><td>The device serial number.</td></tr><tr><td><strong>IP</strong></td><td>The device IP address.</td></tr><tr><td><strong>Setting Assigned</strong></td><td>The Advanced Setting currently assigned to the device.</td></tr><tr><td><strong>Location</strong></td><td>The physical or network location of the device.</td></tr><tr><td><strong>OS</strong></td><td>The operating system installed on the device.</td></tr><tr><td><strong>Last Online Time</strong></td><td>The date and time the device last communicated with the server.</td></tr><tr><td><strong>Hardware</strong></td><td>Hardware specification reported by the device.</td></tr><tr><td><strong>Software</strong></td><td>Applications reported as installed on the device.</td></tr><tr><td><strong>Agent Installation</strong></td><td>The installation status of the INSIGHT agent.</td></tr><tr><td><strong>Agent Version</strong></td><td>The version of the INSIGHT agent installed on the device.</td></tr></tbody></table>

{% hint style="info" %}
Report packet size, client status interval, settings interval, and command interval are configured under **INSIGHT** > **Advanced Settings** > **Report Upload and Communication Settings**.
{% endhint %}

#### Export Devices List

The device list can be exported in PDF or CSV format.

1. Navigate to **DEVICES**.
2. On the top-right,
   1. Click the **Excel icon** <i class="fa-file-excel">:file-excel:</i> to download the files in a `.csv` format.
   2. Click the **PDF icon** <i class="fa-file-pdf">:file-pdf:</i> to download the files in a `.pdf` format.

<figure><img src="https://1102323068-files.gitbook.io/~/files/v0/b/gitbook-x-prod.appspot.com/o/spaces%2FSrTJQs663dZ9Te4UU3O8%2Fuploads%2FWtoHI8oTA52whoLXsSHl%2Fimage.png?alt=media&amp;token=68dad69e-c00d-4393-840e-636e1f179594" alt="" width="563"><figcaption></figcaption></figure>

### Assign an Advanced Setting

An Advanced Setting defines the monitoring policy and configuration applied to a device. Assigning the correct setting ensures each device is monitored in line with organisational requirements, whether that means applying stricter policies to high-risk user groups or adjusting communication intervals to suit specific network conditions.

Each device can hold one Advanced Setting at a time. A single setting can be assigned to multiple devices. When a new setting is assigned to a device, the existing setting is automatically removed and replaced.

1. Navigate to **INSIGHT** > **Devices**.
2. Select one or more devices from the list.
3. Click **Assign Advanced Setting**.<br>

   <div align="left"><figure><img src="https://1102323068-files.gitbook.io/~/files/v0/b/gitbook-x-prod.appspot.com/o/spaces%2FSrTJQs663dZ9Te4UU3O8%2Fuploads%2FTsTVvDJiiVrWctMNxiUP%2Fimage.png?alt=media&amp;token=8c56da65-d70d-4d1a-8ab7-e7f80c065d69" alt="" width="519"><figcaption></figcaption></figure></div>
4. In the side drawer, select an Advanced Setting from the list to assign to the selected devices.<br>

   <div align="left"><figure><img src="https://1102323068-files.gitbook.io/~/files/v0/b/gitbook-x-prod.appspot.com/o/spaces%2FSrTJQs663dZ9Te4UU3O8%2Fuploads%2F6hjZTkAJjNDT9DlI8KqC%2Fimage.png?alt=media&amp;token=be9f19cd-a970-4992-b49c-0c1b594b0df8" alt="" width="491"><figcaption></figcaption></figure></div>
5. Click **Confirm**.

{% hint style="info" %}
If no Advanced Settings have been created yet, create an [**Advanced Setting**](/documentation/insight-v4/insight-v5/advanced-settings#create-an-advanced-setting) first. After creating, assign the setting here, or from the [**Assign Devices**](/documentation/insight-v4/insight-v5/advanced-settings#assign-devices) action in Advanced Settings.
{% endhint %}

### Assign a Command

Commands allow administrators to act on devices immediately, outside of normal scheduled intervals. This is useful when a change needs to take effect without waiting for the next settings sync, when troubleshooting a specific device, or when preparing a device for decommissioning.

Commands trigger one-off actions on selected devices without changing the assigned Advanced Setting. Use them to troubleshoot a device, force an update, collect current device data, or apply a temporary device action.

Assigned commands are picked up by the device agent during its next communication with the server. Only one command can be assigned per operation; however, multiple devices can be selected and assigned.

{% hint style="warning" %}
Review the effect of each command before assigning it broadly. Commands such as **Uninstall Client**, **Driver Options**, and **Network Monitoring Approach** can affect monitoring coverage, user experience, or device connectivity.
{% endhint %}

#### Before you assign a command

* Confirm the device has checked in recently.
* Select only the devices that need the action.
* Check whether the command is diagnostic, temporary, or permanent.
* Consider whether the command may interrupt the user or require follow-up.

<figure><img src="https://1102323068-files.gitbook.io/~/files/v0/b/gitbook-x-prod.appspot.com/o/spaces%2FSrTJQs663dZ9Te4UU3O8%2Fuploads%2FKaBzf7ikpSycOkBpF0lc%2Fimage.png?alt=media&amp;token=999e06e6-c067-42aa-8ebc-c74e5f915d97" alt="" width="521"><figcaption></figcaption></figure>

1. Navigate to **INSIGHT** > **Devices**,
2. Select one or more devices, and click **Assign Command**.

<details>

<summary>Enable Test Communication Settings</summary>

Switches the device Communication Settings to a configuration optimised for fast settings downloads and report uploads. This is intended for testing and diagnostic purposes only.

Use this when validating connectivity, testing server communication, or checking whether a device can receive updates promptly.

{% hint style="info" %}
Applying this command to all devices simultaneously will overload the server. Use selectively on individual or small groups of devices.
{% endhint %}

1. Navigate to **INSIGHT** > **Devices**.
2. Select one or more devices from the list and click **Assign Command**.
3. Select **Enable Test Communication Settings**.
4. Click **Confirm** to assign the command.

</details>

<details>

<summary>Disable Test Communication Settings</summary>

Reverts the device Communication Settings to their default values, undoing any changes made by the [Enable Test Communication](#enable-test-communication-settings) Settings command.

Use this after testing is complete so the device returns to its standard communication behaviour.

1. Navigate to **INSIGHT** > **Devices**.
2. Select one or more devices from the list and click **Assign Command**.
3. Select **Disable Test Communication Settings**.
4. Click **Confirm** to assign the command.

</details>

<details>

<summary>Update User Policies on Device</summary>

Instructs the agent to immediately apply the current policy and Advanced Settings, rather than waiting for the next scheduled settings interval.

Use this after changing an Advanced Setting or policy when you want the device to apply the latest configuration without waiting for the next scheduled sync.

1. Navigate to **INSIGHT** > **Devices**.
2. Select one or more devices from the list and click **Assign Command**.
3. Select **Update Setting**.
4. Click **Confirm** to assign the command.

</details>

<details>

<summary>Application Scan</summary>

Instructs the agent to report all applications currently installed on the device. Use this command to retrieve an up-to-date software inventory outside of the normal reporting schedule, for example, after a suspected unauthorised installation.

Use this when software inventory needs to be refreshed after an installation, removal, or other application change on the device.

1. Navigate to **INSIGHT** > **Devices**.
2. Select one or more devices from the list and click **Assign Command**.
3. Select **Application Scan**.
4. Click **Confirm** to assign the command.

</details>

<details>

<summary>Hardware Scan</summary>

Instructs the agent to report the device hardware specifications, installed peripherals, and available disk space. Use this command to get a current hardware snapshot when auditing or troubleshooting a device.

Use this when auditing device specifications or confirming changes to storage, peripherals, or other hardware components.

1. Navigate to **INSIGHT** > **Devices**.
2. Select one or more devices from the list and click **Assign Command**.
3. Select **Hardware Scan**.
4. Click **Confirm** to assign the command.

</details>

<details>

<summary>Reresolve PC</summary>

Assigns a new unique identifier to the device. Send this command when a device has been provisioned from an image that had INSIGHT pre-installed. Without it, cloned devices may share the same identifier and conflict when communicating with the server.

Use this after imaging or cloning a machine if multiple devices appear to be reporting as the same endpoint.

1. Navigate to **INSIGHT** > **Devices**.
2. Select one or more devices from the list and click **Assign Command**.
3. Select **Reresolve PC**.
4. Click **Confirm** to assign the command.

</details>

<details>

<summary>Reresolve User</summary>

Assign this command when the same non-Active Directory user account is shared across multiple devices. Without it, INSIGHT may treat those users as a single entity rather than separate individuals.

Use this when shared local accounts cause user activity to be grouped incorrectly across multiple devices.

1. Navigate to **INSIGHT** > **Devices**.
2. Select one or more devices from the list and click **Assign Command**.
3. Select **Reresolve User**.
4. Click **Confirm** to assign the command.

</details>

<details>

<summary>Network Monitoring Approach</summary>

The Network Monitoring Approach command specifies the method INSIGHT uses to monitor network traffic. The default approach is Windows Filtering Platform (WFP). If a conflict exists with another network monitoring application on the device, an alternative approach can be selected to maintain compatibility.

Change this only when troubleshooting compatibility issues with another networking product or when instructed to do so during support.

1. Navigate to **INSIGHT** > **Devices**.
2. Select one or more devices from the list and click **Assign Command**.
3. Select **Network Monitoring Approach** and select the monitoring approach (only one).
   1. **WFP** - Windows Filtering Platform. The default approach.
   2. **LSP** - Layered Service Provider. Use if WFP conflicts with another application.
   3. **OFF** - Disables network monitoring entirely.
4. Click **Confirm** to assign the command.

</details>

<details>

<summary>Driver Options</summary>

Allows individual INSIGHT drivers to be disabled. Use this command to resolve driver conflicts or compatibility issues without affecting other components.

Disable individual drivers only for troubleshooting or compatibility testing. Disabling drivers may reduce monitoring visibility on the device.

1. Navigate to **INSIGHT** > **Devices**.
2. Select one or more devices from the list and click **Assign Command**.
3. Select **Driver Options** and uncheck the box next to the driver to be disabled.
   1. Process Guardian- **GWPG**
   2. USB Monitoring- **GWScanner**
   3. USB File Transfers- **GWUSBMon**
   4. File Guardian- **GWDogFile**
   5. File System Monitoring- **GWChatDocMon**
4. Click **Confirm** to assign the command.

</details>

<details>

<summary>Refresh SSL Certificate</summary>

Renews the SSL certificate INSIGHT uses to monitor SSL traffic. Certificates are valid for **two years** and renew automatically on restart when close to expiry. This command allows renewal without restarting the agent, avoiding any interruption to the user.

Use this when SSL traffic monitoring needs to continue without restarting the agent or interrupting the user session.

1. Navigate to **INSIGHT** > **Devices**.
2. Select one or more devices from the list and click **Assign Command**.
3. Select **Refresh SSL Certificate**.
4. Click **Confirm** to assign the command.

</details>

<details>

<summary>Enable SSL Cache</summary>

Re-enables SSL encryption key caching if it has previously been disabled. Use this command to restore the default SSL monitoring behaviour after a [Disable SSL Cache](#disable-ssl-cache) command has been applied.

Use this after troubleshooting is complete and normal SSL cache behaviour should be restored.

1. Navigate to **INSIGHT** > **Devices**.
2. Select one or more devices from the list and click **Assign Command**.
3. Select **Enable SSL Cache**.
4. Click **Confirm** to assign the command.

</details>

<details>

<summary>Clear SSL Cache</summary>

The Clear SSL Cache command clears the SSL encryption keys cached by INSIGHT to speed up SSL traffic monitoring. If webpages are becoming corrupted for a user, clearing the cache will resolve the issue in most cases.

Use this as a first troubleshooting step when monitored web sessions become corrupted or pages do not render correctly.

1. Navigate to **INSIGHT** > **Devices**.
2. Select one or more devices from the list and click **Assign Command**.
3. Select **Clear SSL Cache**.
4. Click **Confirm** to assign the command.

</details>

<details>

<summary>Disable SSL Cache</summary>

Disables SSL encryption key caching entirely. If webpage corruption is occurring on a regular basis and clearing the cache has not resolved the issue, disabling the cache will prevent it from contributing to the problem.

Use this only if repeated web corruption continues after clearing the SSL cache.

1. Navigate to **INSIGHT** > **Devices**.
2. Select one or more devices from the list and click **Assign Command**.
3. Select **Disable SSL Cache**.
4. Click **Confirm** to assign the command.

</details>

<details>

<summary>Enable CLOSE_WAIT Management</summary>

Enables management of `CLOSE_WAIT` TCP connection states. `CLOSE_WAIT` occurs when the remote side of a connection initiates a close, but the browser fails to close the socket. This typically manifests as blank pages appearing in the browser. Enabling this command addresses the issue.

Use this when users report blank browser pages or symptoms that point to sockets remaining in a `CLOSE_WAIT` state.

1. Navigate to **INSIGHT** > **Devices**.
2. Select one or more devices from the list and click **Assign Command**.
3. Select **Enable CLOSE\_WAIT Management**.
4. Click **Confirm** to assign the command.

</details>

<details>

<summary>Disable CLOSE_WAIT Management</summary>

Disables the management of `CLOSE_WAIT` TCP connection states.

Use this only if `CLOSE_WAIT` management was enabled for troubleshooting and is no longer required.

1. Navigate to **INSIGHT** > **Devices**.
2. Select one or more devices from the list and click **Assign Command**.
3. Select **Disable CLOSE\_WAIT Management**.
4. Click **Confirm** to assign the command.

</details>

<details open>

<summary>Uninstall Client</summary>

The Uninstall Client command removes the INSIGHT agent from the selected devices.

Use this when permanently removing INSIGHT from a device, during device decommissioning, or before a clean reinstall.

1. Navigate to **INSIGHT** > **Devices**.
2. Select one or more devices from the list and click **Assign Command**.
3. Select **Uninstall Client**.
4. Select either **Immediate** or **Silent**.
   1. Selecting **Immediate** uninstalls the agent straight away. The user's session is interrupted and `explorer.exe` is restarted.
   2. Selecting **Silent** uninstalls the agent in the background. Cleanup completes on the next device restart with no user interruption.
5. Click **Confirm** to assign the command.

</details>

After assigning a command, verify the result from the device record. Check the last online time, reported hardware or software data, assigned settings, agent version, or the expected change in endpoint behaviour.


# END USERS

End Users displays the user accounts that have been detected by GuardWare. Administrators can view user details and manage INSIGHT User Policy assignments across the organisation. Each user account is listed with details such as last login time, assigned security group, device used, and currently assigned policy.&#x20;

Use this page to confirm which accounts are active, review assigned groups, and verify which INSIGHT User Policy applies to each user.

{% hint style="info" %}
Some user details depend on directory data. If a value is not available in Active Directory, the account still appears, but that field may be blank.
{% endhint %}

#### Searching and Filtering

<figure><img src="https://1102323068-files.gitbook.io/~/files/v0/b/gitbook-x-prod.appspot.com/o/spaces%2FSrTJQs663dZ9Te4UU3O8%2Fuploads%2FRDhHnDgYWgcEO9RffnVC%2Fimage.png?alt=media&amp;token=72b869f8-2bae-4181-8acb-6cfa6691a089" alt=""><figcaption></figcaption></figure>

1. Navigate to **END USERS**.
2. Click the search field at the top of the page to locate a user by name. The list can also be filtered by:
   1. **Security Group** filters users by their assigned security group. Security groups are created and managed [**in PROTECT**](broken://spaces/YjhDY2iYb0LtmwtBg1Kd/pages/UO9C6vYLDo2IKH6MuYgt#security-groups).
   2. **Policy** filters users by their currently assigned INSIGHT User Policy.

### User Details

Review directory information, the associated device, group membership, and the currently assigned policy from the **User Details** panel.

1. Navigate to **END USERS**.
2. From the available list of users, click **View** <i class="fa-eye">:eye:</i> in the **Action** column.

   <div align="left"><figure><img src="https://1102323068-files.gitbook.io/~/files/v0/b/gitbook-x-prod.appspot.com/o/spaces%2FSrTJQs663dZ9Te4UU3O8%2Fuploads%2FfK2BcJbokCtZhe2GFgLx%2Fimage.png?alt=media&amp;token=098250c7-9be7-40d7-a1a6-c4399a51b2b2" alt="" width="563"><figcaption></figcaption></figure></div>
3. This opens the **User Details panel**, which is organised into four sections:

* **Basic Info** shows the user's full name, email address, phone number, job title, department, and assigned manager. This information is pulled from the directory and is read-only.
* **Device & Network** shows the PC name associated with the user, the domain the device is joined to, and the user's location.
* **Access & Groups** shows the user group the account belongs to, as well as any security groups assigned to the user.
* **Policy** shows the INSIGHT User Policy currently assigned to the user and the date and time the assignment was last updated.

### Assign Policy to a User

INSIGHT User Policies define the monitoring and security behaviour applied to end-user accounts. Each user can hold one policy assignment at a time.

A **Base Policy** is available by default and acts as a fallback. If a policy is deleted and users were assigned to it, those users are automatically reassigned to the base policy to ensure no account is left unmanaged. The base policy can be assigned to or removed from users, but cannot be edited or deleted.

All other policies can be created, edited, and deleted as needed.

{% hint style="info" %}
For information on creating and configuring INSIGHT User Policies, see the [**INSIGHT User Policies guide**](/documentation/insight-v4/insight-v5/user-policies)**.**
{% endhint %}

Policies can be assigned to one or more users at a time. To assign a policy:

1. Navigate to **INSIGHT** > **End Users**.
2. Select the users to assign a policy to by clicking the checkbox next to each account.
3. Click **Assign Policies**.

   <div align="left"><figure><img src="https://1102323068-files.gitbook.io/~/files/v0/b/gitbook-x-prod.appspot.com/o/spaces%2FSrTJQs663dZ9Te4UU3O8%2Fuploads%2F7mxzJdJiw77cEPDNq5p8%2Fimage.png?alt=media&amp;token=1d3b18f3-fffe-4c50-b8e9-59c691ddeab3" alt="" width="563"><figcaption></figcaption></figure></div>
4. Select the policy to assign.

   <div align="left"><figure><img src="https://1102323068-files.gitbook.io/~/files/v0/b/gitbook-x-prod.appspot.com/o/spaces%2FSrTJQs663dZ9Te4UU3O8%2Fuploads%2FheT6UpEl3hDuT50ExWQx%2Fimage.png?alt=media&amp;token=595c9f77-ba0e-4c7d-8928-e20aa5ebdaf5" alt="" width="505"><figcaption></figcaption></figure></div>
5. Click **Confirm** to apply the policy.

{% hint style="info" %}
A user can only hold one policy at a time. Assigning a new policy replaces the existing one. Multiple users can be assigned the same policy at once.
{% endhint %}


# Download INSIGHT Agent

The **GuardWare INSIGHT Agent** is installed on endpoint devices, such as desktops, laptops, and servers, within your organisation. It continuously monitors user activities and file interactions, such as file uploads, downloads, and copies, email attachments, print actions, and access to non-corporate websites and applications.

You can **download** the INSIGHT Agent directly **from the Management Console**. The downloaded agent includes the MSI configuration defined for your organisation, so no additional setup is required during installation.

## Prerequisite

To download the agent, you must first set up the Agent Installation Settings. These settings allow administrators to configure installation parameters for the GuardWare INSIGHT Agent MSI installer.&#x20;

The download link only appears after the configuration is complete.&#x20;

### Set up Agent Installation

1. Log in to the Management Console.
2. Navigate to **RESOURCES** > **Agent Download**, click **INSIGHT Agent**, and enter the following details.
3. **Organisation ID:** Enter the organisation identifier under which agents are registered.
4. **Server Name:** Enter the hostname or domain of the server that agents connect to.
5. **Server IP:** Enter the IP address of the server. This is used by the agents to establish communication with the server.
6. **Server Port**: Enter the port used for communication between the agent and the server. Ensure the port is allowed in the firewall when required. The standard HTTPS port is 443.
7. **Location:** Specify the location or site of the endpoint.
8. **Update Link**: Specify the URL of the client update control file if it is hosted on a different server than the default. By default, agents look for this file on the connected Windows Server; however, you can use this field to point to a different server or location from which the agent retrieves update information.
9. **Uninstall Client Before Execute**: Enable this option to remove any existing agent before installing a new one. Use this when upgrading or redeploying the agent.&#x20;
10. **Proxy Override**: Enable **Proxy Override** and specify the override addresses or domains that should bypass the proxy. Traffic to these destinations is sent directly.
11. **Proxy Authentication**: Enable this option if the proxy requires authentication.
12. **Is Proxy Server**: Enable **Is Proxy Authentication** if endpoints connect to the server through a proxy.
    1. **Proxy Username**: Enter the username used to authenticate with the proxy server.
    2. **Proxy Password**: Enter the password used to authenticate with the proxy server.
13. **Advanced Options:**
    1. **Retain Advanced Options**: Enable this option to preserve selected advanced settings during updates or reinstallation.
    2. **Option Use WFP**: Enable this option to use Windows Filtering Platform (WFP) for network-level monitoring and control.
    3. **Option Kill Browsers During Uninstall**: Enable this option to close running browsers during uninstallation to avoid conflicts.
    4. **Option Server Installer**: Enable this option to allow the agent to be installed on a Windows Server. By default, installation is blocked on server operating systems; enabling this option overrides that restriction.
    5. **Option Check Close Wait**: Enable this option to ensure required applications are closed before installation continues.
14. **Driver Options:**
    1. **Retain Driver Option**: Enable this option to preserve selected driver settings during updates.
    2. **Enable** the required drivers. For a fresh installation, we recommend enabling all the following  drivers:
       1\.       GWDogFile: Prevents renaming and deletion of INSIGHT client system files.
       2\. GWScanner: Monitors USB file transfers with respect to productivity functionality.
       3\. GWProcessGuardian: Prevents termination of INSIGHT client processes.
       4\.       USBMon: Monitors USB file transfers for DLP functionality.
       5\. ChatDocMon: Monitors chat and cloud applications.
       6\. GWProxy: Monitors higher-level network traffic.
15. Click **Submit**.<br>

    <figure><img src="https://1102323068-files.gitbook.io/~/files/v0/b/gitbook-x-prod.appspot.com/o/spaces%2FSrTJQs663dZ9Te4UU3O8%2Fuploads%2F3WwtSN85rGr80xVlhdVg%2FINSIGHT%20Agent%20Configuration.png?alt=media&amp;token=93401a8c-1674-4ce2-85a2-38274be9e359" alt=""><figcaption></figcaption></figure>

## Download the Agent

Once the installation settings are complete, the **Download Installer** link becomes available. Click it to download the agent with the configured settings.

<figure><img src="https://1102323068-files.gitbook.io/~/files/v0/b/gitbook-x-prod.appspot.com/o/spaces%2FSrTJQs663dZ9Te4UU3O8%2Fuploads%2FziZJGWcls67zH6MvO3ok%2FINSIGHT%20MSI%20Ready.png?alt=media&amp;token=a2730f10-da24-4149-b5f7-0edc6a8e5813" alt=""><figcaption></figcaption></figure>

{% hint style="info" %}
Update the settings whenever required and download a new agent to apply the changes.
{% endhint %}


---

[Next Page](/llms-full.txt/1)